Highway bridges are designed to resist various systems of loads (actions) and load combinations. One of the most prominent actions on highway bridges is vehicular traffic. Practically, traffic actions on bridges consist of different vehicular categories, such as standard automobiles, lorries (trucks), and specialized industrial transport vehicles.
However, for the purpose of bridge design, traffic actions on highway bridges can simplified using traffic Load Models specified in the Eurocodes. Other codes in the world such as AASHTO, IRC, etc have their specialised loadings for bridges. The resulting loads manifest as a complex interplay of vertical and horizontal forces, further categorized as static (constant) and dynamic (variable).
In the Eurocodes, traffic load models were calibrated for highway bridges having carriageway width less than 42m, and span length up to 200m. The load models aim to reproduce the real values of the effects induced in the bridges by real traffic. Therefore, these models are artificial models and not necessarily real vehicles.
Calibration of the traffic models was based on real traffic data recorded in experiments performed in Europe between 1980 and 1994.
European Bridge Load Models
– Load Model 1 (LM 1): This load model reproduces traffic loads to be used for local and global verifications. It is made up of concentrated load and UDL, which can be thought of in terms of HA load of BS 5900, even though they are very different.
– Load Model 2 (LM 2): This load model reproduces effects on short structural members and is composed of single axle load on specific rectangular tyre contact areas.
– Load Model 3 (LM 3): This is for special vehicles, and it is to be considered on request. It represents abnormal vehicles.
– Load Model 4 (LM 4): Crowd loading.
To ensure a robust and safe bridge design, it is important to employ load models that are specifically tailored to the location of the bridge. By accounting for the aforementioned variations in traffic patterns and vehicle types, location-specific load models provide a more accurate representation of the actual loading conditions the bridge will encounter throughout its service life.
Read Also…
Static Analysis of Suspension Bridges
Analysis of influence lines for beams with overhangs
Division of Carriageway into notional lanes
A carriageway is the part of the roadway sustained by a single structure (deck, pier etc). It includes all the physical lanes, the hard shoulders, the hard strips, etc. The carriageway is divided into notional lanes and the remaining area.
The subdivision of roads into notional lanes is summarised in the table below;
| Carriageway width (w) | Number of notional lanes (n) | Width of the notional lane | Width of the remaining area |
| w < 5.4 m | 1 | 3m | w – 3m |
| 5.4 ≤ w < 6 | 2 | 0.52 | 0 |
| 6m ≤ w | int(w/3) | 3m | w – (3 x n) |
Load Model 1
Load Model 1 represents the effects of normal traffic and comprises tandem axles (TS) superimposed over a uniformly distributed load (UDL) whose intensity remains constant with the loaded length. The model is very different from the Type HA loading given in BD37. Type HA loading consists of a uniformly distributed load, the intensity which varies with the loaded length, and a constant Knife Edge Load (KEL) of 120 kN.
There are also lane factors for different lengths which account for the simultaneity of loading in adjacent lanes as a function of loaded length. Eurocode (EN 1991-2) load model also differs from BD37 in the way that the carriageway is divided into notional lanes. In EN 1991-2, the notional lane width is constant at 3.0m except for a small range of carriageway width between 5.4m and 6.0m when the lane width varies from 2.7m to 3.0m. (See Table above).
The load model 1 which generally represents normal vehicles consists of two sub-systems;
(1) A system of two concentrated axle loads representing a tandem system weighing 2.αkQk
(2) A system of distributed load having a weight density per square metre of αkqk
The characteristic values of LM 1 forces;
The Tandem System
For the assessment of local effects, a tandem axle system should be placed at the location on the bridge deck that experiences the most unfavourable loading conditions. In scenarios where two tandem systems are considered on adjacent design lanes, these systems may be positioned closer together. However, the minimum centre-to-centre spacing between wheel axles within each tandem system must not be less than 0.50 meters.
In Load Model 1, each axle within a tandem system shall be modelled as possessing two identical wheels. Consequently, the load acting on each individual wheel is calculated as one-half the product of the factor α, the characteristic axle load (Qk), and a distribution factor.
The contact surface of each wheel shall be idealized as a square with a side length of 0.40 meters. This simplifies the analysis by representing the wheel’s footprint as a uniformly distributed load over a defined area of 0.16 m2.
The Uniformly Distributed Load
This load model represents a constant weight distributed per unit area across a designated lane width. The characteristic load intensity (qk) is multiplied by an adjustment factor (αik) to obtain the characteristic value (αikqk) for UDL application. These adjustment factors account for potential variations in traffic patterns and weight distributions.
Load Model 1, incorporating the UDL system just described, should be applied to each designated traffic lane (“notional lane”) as well as any remaining bridge areas not designated as traffic lanes. For each notional lane “i,” the characteristic load magnitudes are denoted as αikQik and αikqik, respectively, referencing the values provided in Table 4.2 of EN-1991-2.
These symbols represent the adjusted axle load (αikQik ) and the adjusted UDL load (αikqik) specific to lane “i.” In the remaining bridge areas not designated for traffic, the design load magnitude is denoted as αrkqrk, where αrk is the corresponding adjustment factor and qrk is the characteristic load intensity for that area.
Selection of Adjustment Factors
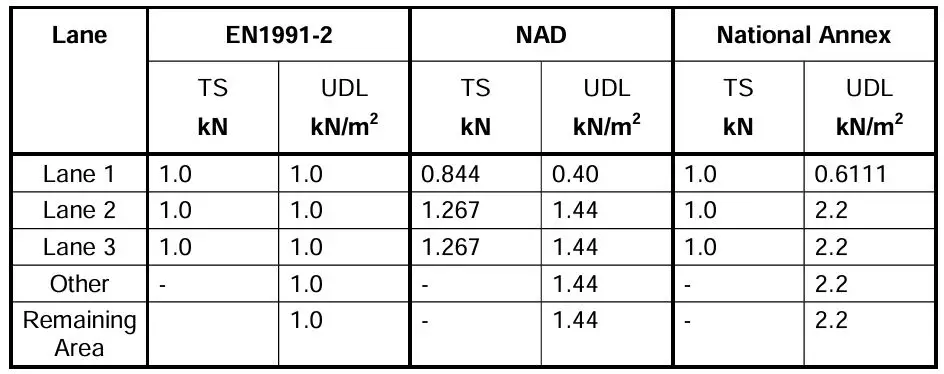
The specific values assigned to the adjustment factors depend on the anticipated traffic patterns on the bridge and may also vary based on the classification of the route (e.g., highway versus local road). They are however usually specified in the national annex. If no specific information is available regarding these factors, they should be assumed to be equal to 1.0 for all cases.
The adjustment factors specified in Eurocode 1, National Application Document (NAD, UK), and UK National Annex are shown in Table below.
Rules for applying Load Model 1
- In each notional lane, only one tandem system should be considered, situated in the most unfavourable position.
- The tandem system should be considered travelling in the longitudinal axis of the bridge.
- When present, the tandem system should be considered in full i.e with all four wheels
- The UDL’s are applied longitudinally and transversally on the unfavourable parts of the influence surface.
- The two load systems can insist on the same area.
- The dynamic impact factor is included in the two load systems.
- When static verification is governed by the combination of local and global effects, the same load arrangement should be considered for the calculation of local and global effects.
Solved Example
A simply supported bridge deck has a carriageway width of 8m and a span of 18m. Determine the maximum bending moment on the bridge deck due to Load Model 1.
Solution
Carriageway width w = 8 m
Number of notional lanes = 8/3 = 2
Width of the remaining area = 8m – (3 x 2) = 2m
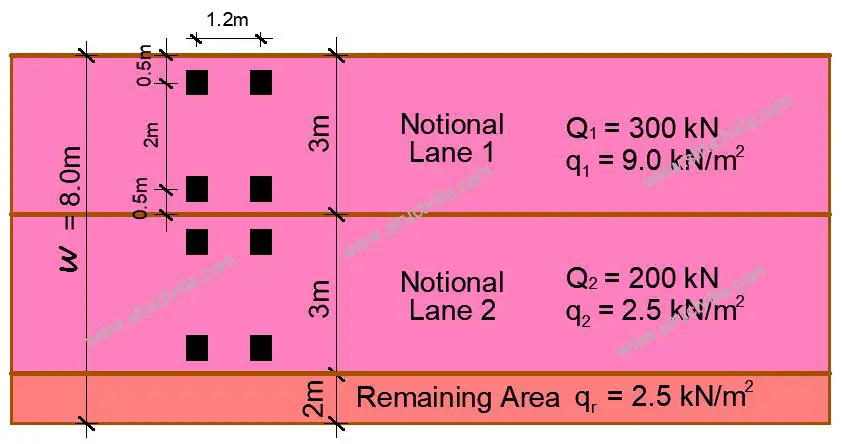
Let us analyse for the worst load condition on Notional Lane 1;
Axle Load
Each axle load of TS = αQ1Q1k = 1.0 x 300 = 300 kN
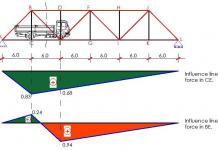
Figure 2 illustrates the calculation of bending moment (My) and shear force (Vz) at a specific section “s” located at a distance “x” from the support of a simply supported beam. The beam is subjected to two point loads positioned 1.2 metres apart, representing the configuration of a Load Model 1 Tandem System (LM1 TS) oriented longitudinally. The calculations are performed using the influence line method.
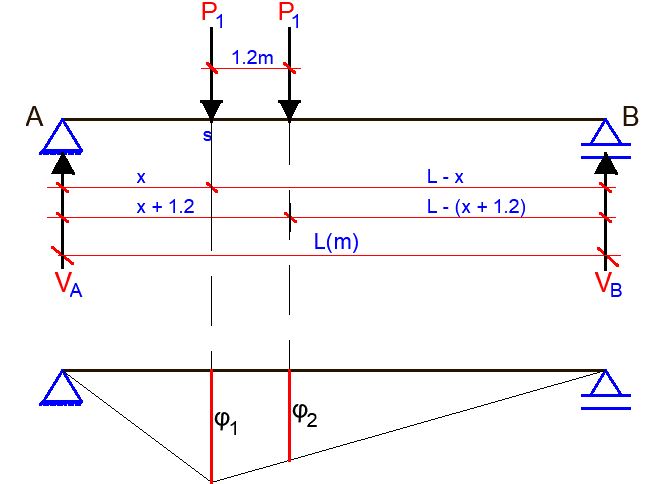
The influence line for the bending moment is drawn with their positive values below the reference line. Load effects from that model are as follows:
My = φ1 + φ2
Where φ1 and φ2 are the corresponding influence line ordinates under the point loads.
φ1 = x (L – x) /L
φ2 = x (L – x – 1.2) /L
Notably, the maximum bending moment induced by these tandem wheel loads does not occur precisely at the midpoint of the beam span. The location of the section experiencing the greatest bending moment can be determined by solving the following equation:
dM/dx = (2L – 4x – 1.2)/L = 0
The section with the maximum bending moment from the Load Model 1 tandem system is at a distance from the support:
x = 0.5L – 0.3
Therefore, in a simply supported beam system, the maximum bending moment for the Load Model 1 tandem system occurs under the axle when the vehicle is positioned such that the midpoint of the beam span coincides with the midpoint of the distance between the centre of gravity (centroid) of the entire vehicle load and the axle closest to that support.
With an 18m span and the axles spaced 1.2m apart, the rear axle is placed at 0.3m from the mid-span.
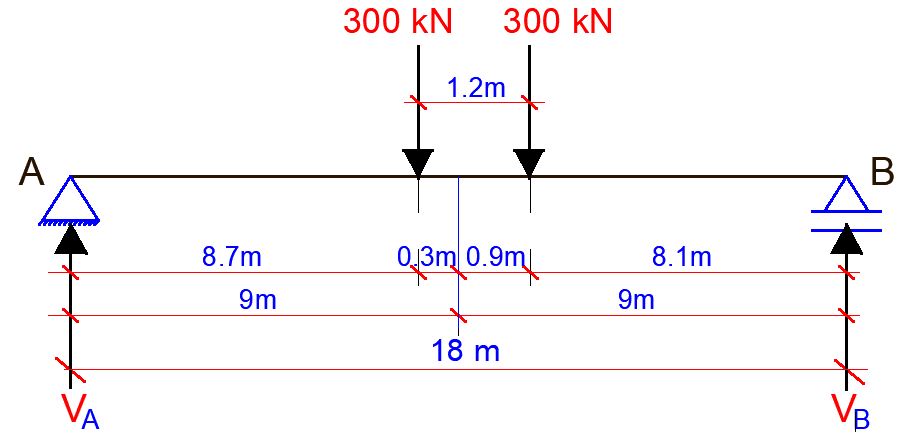
Support Reactions
Let ∑MB = 0
18VA – (300 x 9.3) – (300 x 8.1) = 0
VA = 290 kN
Let ∑MA = 0
18VB – (300 x 8.7) – (300 x 9.9) = 0
VB = 310 kN
M1 = 290 x 8.7 = 2523 kNm
M2 = 310 x 8.1 = 2511 kNm
Maximum bending moment on 1m width of the lane due to TS = 2523/3 = 841 kNm/m
Uniformly Distributed Load
Adjustment factor αq1 = 0.61
Hence UDL system = 0.61 x 9 = 5.5 kN/m2
The maximum mid-span moment on 1m width of lane due to UDL = 5.5 x 182/8 = 222.75 kNm/m
Total maximum moment due to LM1 = 841 + 222.75 = 1063.75 kNm per metre width of lane.
Sources and Citations
Pietro Croce et al (2010): Guidebook 2 Design of Bridges; Published by Czech Technical University in Prague, Klokner Institute. ISBN 978-80-01-04617-3





• Great content material and great layout. Your website deserves all of the positive feedback it’s been getting.
BIM Consulting
BIM Solutions
BIM Implementation
Point Cloud to BIM conversion
Fabrication Drawings preparation