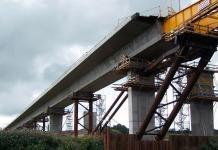
In the UK, HB loads are used to represent abnormal traffic on a bridge deck. Even though the use of HA and HB loads as traffic actions has been replaced with Load Models 1 to 4 of EN 1991-2, the use of HB load is still applied in the design of bridges especially in Nigeria. It is very important, therefore, to know how to analyse bridge girders (in beam and slab bridges) for HB loads in order to obtain the design forces due to moving traffic.
There are many methods through which the effects of traffic wheel load can be obtained on the longitudinal components of a bridge deck. Some of these methods are;
- Finite element analysis
- Grillage analysis, and
- Simplified methods
The simplified methods of analysing bridge decks are known as the manual methods. While bridge design all over the world is majorly carried out using computers, the simplified methods (which are pretty quick to apply) can be used for quick checks or for preliminary and/or detailed design. The difference between the results from computer methods and simplified methods is often not very wide.
The basis of many simplified/manual methods is the distribution coefficient methods, e.g. Morice and Little (1956). These methods can be applied manually to obtain the values of various load effects at any reference point on a transverse section of the bridge.
For most of the load distribution coefficient methods, a right simply supported bridge is idealized as an orthotropic plate whose load distribution characteristics are governed by two dimensionless parameters α and θ. These parameters depend largely on the geometry of the bridge deck (which is usually known prior to the analysis).
In North America, the simplified method of bridge deck analysis is widely used. Unlike the distribution coefficient methods, the simplified methods of bridge analysis provide only the maximum action effect for the purposes of design. As a result, a lesser computational effort is required when using this method compared with the distribution coefficient method. These simplified methods are permitted by the current and past design codes, being the AASHTO Specifications (1998, 2010), the CSA Code (1988), the Ontario Highway Bridge Design Code (1992), and the Canadian Highway Bridge Design Code (2000, 2006).
The results from the North American simplified methods are reliable and can be obtained rather quickly. It is important to note that the analysis depends on the specification of the magnitude and placement of the design live loads, and accordingly are not always transportable between the various design codes.
The D-Method of Bridge Deck Analysis
In the simplified method of analysis, a longitudinal girder, or a strip of unit width in the case of slabs, is isolated from the rest of the structure and treated as a one-dimensional beam. This isolated beam is subjected to loads comprising one line of wheels of the design vehicle multiplied by a load fraction (S/D), where S is the girder spacing and D, having the units of length, has an assigned value for a given bridge type (Bakht and Mufti, 2015).
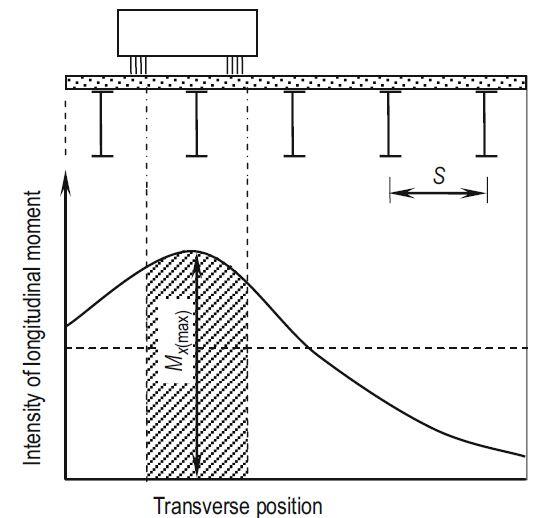
The concept of the factor D can be explained with reference to the figure above, which shows schematically the transverse distribution of live load longitudinal moment intensity in a slab-on-girder bridge at a cross-section due to one vehicle with two lines of wheels.
The intensity of longitudinal moment, having the units of kN.m/m, is obtained by idealizing the bridge as an orthotropic plate. A little consideration will show that the maximum girder moment, Mg, for the case under consideration occurs in the second girder from the left.
The moment in this girder is equal to the area of the shaded portion under the moment intensity curve. If the intensity of maximum moment is Mx(max) then this shaded area is approximately equal to SMx(max), so that:
Mg ≃ SMx(max) —— (1)
It is assumed that the unknown quantity Mx(max) is given by:
Mx(max) = M/D —— (2)
where M is equal to the total moment due to half a vehicle, i.e., due to one line of wheels. Substituting the value of Mx(max) from Eq. (2) into Eq. (1):
Mg = M(S/D) —— (3)
Thus if the value of D is known, the whole process of obtaining longitudinal moments in a girder is reduced to the analysis of a 1-dimensional beam in which the loads of one line of wheels are multiplied by the load fraction (S/D).
Simplified Method of Analysis for HB Load
A simplified method for two-lane slab-on-girder bridges in Hong Kong was presented by Chan et al. (1995). This was based on HB loads that are popularly used for bridge design in the UK.
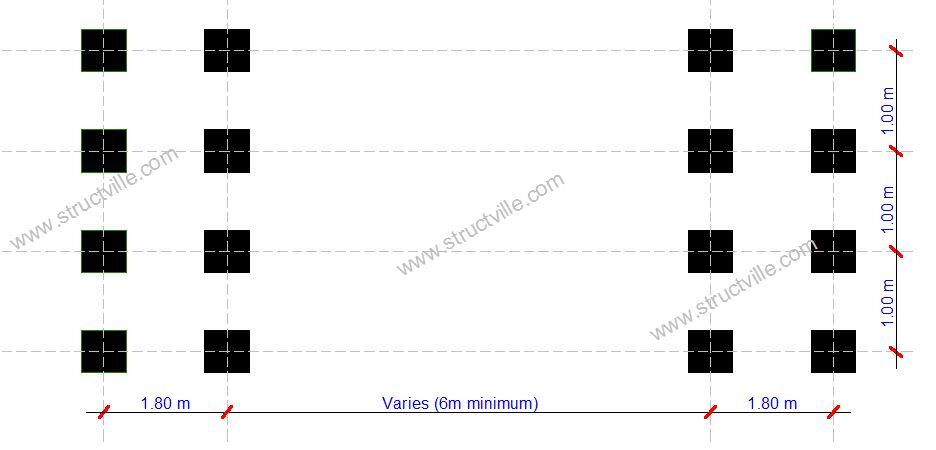
The HB loading comprises four axles, with four wheels in each axle. The weights of the wheels are governed by the units of the HB loading. In Great Britain,we have 30 units, 37.5, and 45 units of HB. Each unit of HB is equal to 10 kN. For instance, for 45 units of HB load, each axle has a total load of 450 kN, while each wheel has a load of 112.5 kN. It should, however, be noted that the units of the design loading does not affect the simplified method presented by Chan et al. (1995).
According to Chan et al (1995), the longitudinal flexural rigidity per unit width Dx, of slab-on-girder bridges in Hong Kong lies between two bounds defined by the following equations.
Dx = 48000L + 5100L2 (upper bound) —— (4)
Dx = 2000L + 3650L2 (lower bound) —— (5)
where the span of the bridge L is in metres and Dx in kN.m.
From a study of a large number of slab-on-girder highway bridges in Hong Kong, it was determined that the ranges of the various parameters which influence the transverse load distribution characteristics of a bridge are as follows.
(a) The deck slab thickness, t, varies between 150 and 230 mm, with the usual value being 200 mm.
(b) The centre-to-centre spacing of girders, S, varies between 0.2 and 2.0 m, with the usual value being 1.0 m.
(c) The lane width, We, varies between 3.2 and 3.8 m, with the usual value being 3.5 m.
(d) The vehicle edge distance, VED, being the transverse distance between the centre of the outermost line of wheels of the HB loading and the nearest longitudinal free edge of the bridge, varies between 0.75 and 5.00 m, with the usual value being 1.00 m.
From the above observations, the following values of the various parameters were adopted for the developmental analyses conducted for developing the simplified method: t = 200 mm; S = 1.0 m; We = 3.5 m; and VED = 1.00 m. In addition, it was assumed that the deck slab overhang beyond the outer girders was 0.55 m. Bridges with spans of 10, 20, 30 and 40 m were selected for the developmental analyses.
Chan et al. (1995), having plotted the values of D from the above analyses against the span length L, found that these values of D are related to L according to the following equations with a reasonable degree of accuracy, provided that the design value of D, i.e. Dd, is corrected.
For internal girders having L < 25 m:
D = 1.2 – 3.5/L —— (6)
For internal girders having L ≥ 25 m:
D = 1.06 —— (7)
For external girders having L < 30 m:
D = 0.95 + 2.1/L —— (8)
For external girders having L ≥ 30 m:
D = 1.03 —— (9)
The correcting equation for obtaining Dd is as follows;
Dd = D(1 + µCw/100) —— (10)
Where;
µ = (3.5 – We)/0.25 —— (11)
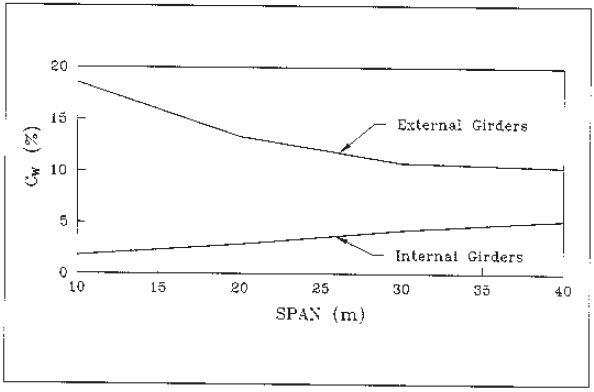
The values of cw for internal and external girders can be read from the chart below;
The following conditions must be met for applying the simplified method.
- The value of Dx lies between the upper and lower bound values given by Eqs. (4) and (5), respectively.
- The bridge has two design lanes
- The width is constant or nearly constant, and there are at least three girders in the bridge.
- The skew parameter ε = (S tan ψ)/L does not exceed 1/18 where S is girder spacing, L is span and ψ is the angle of skew.
- For bridges curved in plan, L2/bR does not exceed 1.0, where R is the radius of curvature; L is span length; 2b is the width of the bridge.
- The total flexural rigidity of transverse cross-section remains substantially the same over at least the central 50% length of each span.
- Girders are of equal flexural rigidity and equally spaced, or with variations from the mean of not more than 10% in each case.
- The deck slab overhang does not exceed 0.6S, and is not more than 1.8 m.
The steps for applying the simplified method in the analysis of bending moment due to HB load on a bridge girder are;
- Calculate the value of D from the relevant of Eqs. (6, 7, 8, and 9); for simply supported spans, L is the actual span length, and for continuous span bridges, the effective L for different spans should be obtained.
- For the design lane width, We, obtain μ from Eq. (11) and Cw from the chart and thereafter obtain Dd from Eq. (10).
- Isolate one girder and the associated portion of the deck slab, and analyse it by treating it as a one-dimensional beam under one line of wheels of the HB loading. The moment thus obtained at any transverse section of the beam is designated as M.
- For any of the internal and internal girders, obtain the maximum moment at the transverse section under consideration by multiplying M with (S/Dd), where Dd is as obtained in Step (b) for the relevant internal or external girders.
Worked Example
Obtain the maximum sagging moment in an interior girder of a one-span bridge deck carrying 45 units of HB load. The configuration of the bridge deck is shown below;
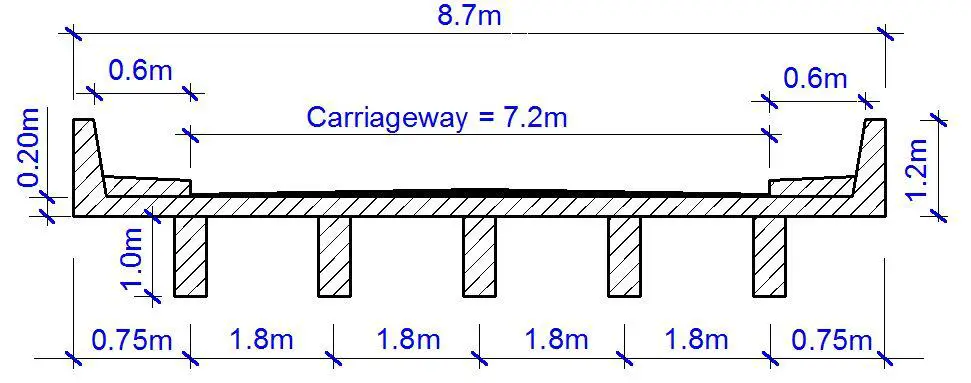
Actual span lengths, L = 18.0 m
Bridge width, 2b = 8.7 m
Carriageway width = 7.2 m
Number of notional lanes = 2
Design lane width (notional lane width) = We = 3.6 m
Deck slab thickness = 0.20 m
Girder spacing S = 1.80 m
Deck slab overhang = 0.75 m
Vehicle edge distance VED = 1.35 m
HB line beam analysis
Isolating a girder of the bridge and placing a line of HB wheel load on it to determine the maximum moment. The wheel load position that will produce the maximum moment is shown below;

When analysed;
M = 1203.75 kNm
From equations (6) and (8);
Internal girder (L < 25 m)
D = 1.2 – 3.5/L = 1.2 – 3.5/18 = 1.0055
External girder (L < 25 m)
D = 0.95 + 2.1/L = 0.95 + 2.1/18 = 1.067
Applying a correction factor to the value of D;
Dd = D(1 + µCw/100)
Where;
µ = (3.5 – We)/0.25 = (3.5 – 3.6)/0.25 = -0.4
For internal girder;
Cw = 6L/40 = (6 x 18)/40 = 2.7%
Dd = 1.0055[1 – (0.4 x 2.7)/100] = 0.9946
Load Fraction S/D = 1.8/0.9946 = 1.8097
For external girder;
Cw = 14 %
Dd = 1.067[1 – (0.4 x 15)/100] = 1.00298
Load Fraction S/D = 1.8/1.00298 = 1.794
Therefore the maximum moment in the internal girder = 1.8097 x 1203.75 = 2178 kNm
Therefore the maximum moment in the external girder = 1.794 x 1203.75 = 2159 kNm
Kindly check for the accuracy of this answer using any method available to you and post your findings in the comment section.
Disclaimer:
Most of the procedures presented here are as described by Bakht and Mufti (2015) with minor alterations after studying the original article cited (Chan et al, 2015). The copyright to those contents, therefore, belongs to the original owners. The worked example used to illustrate the procedure was however developed by Structville.com
References
Bakht B., Mufti A. (2015): Bridge Analysis, Design, Structural Health Monitoring, and Rehabilitation. Springer
Chan THT, Bakht B, Wong MY (1995): An introduction to simplified methods of bridge analysis for Hong Kong. HKIE Trans 2(1):1–8
Morice P. B. and Little G. (1956): The Analysis of Right BridgeDecks Subjected to Abnormal Loading. Cement and Concrete Association, London, Report Db 11


