During the siting and geometric design of highways, incorporating adequate drainage systems is a critical consideration. Drainage conditions often determine the durability and performance of highway pavement structures. Therefore, highway and street drainage facilities must effectively convey water away from the pavement surface and into appropriately designed channels.
Inadequate drainage will inevitably lead to severe degradation of the highway structure. Furthermore, accumulated water on the pavement can impede traffic flow, and hydroplaning and reduced visibility due to splash and spray can contribute to accidents.
The importance of adequate drainage systems is reflected in the budgetary allocation for drainage facilities within highway construction projects. Approximately 25% of highway construction funds are designated for erosion control and drainage structures, encompassing culverts, bridges, channels, and ditches.
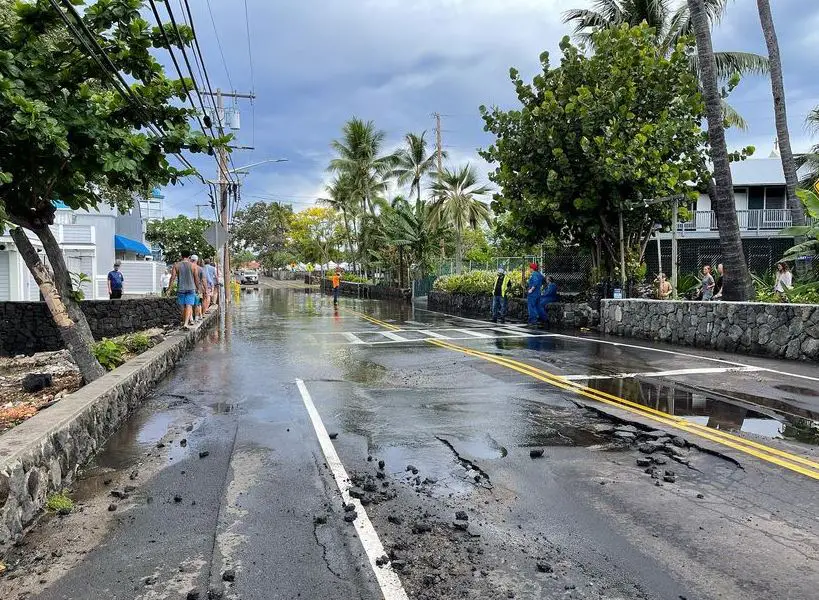
In highway engineering, two primary water sources demand attention, which are surface water and groundwater. Surface water occurs from precipitation in the form of rain or snow. While a portion infiltrates the soil, the remaining surface water presents a potential threat to the highway pavement and requires removal. Drainage systems designed to address this concern are categorized as surface drainage.
The second source, subsurface water, refers to water flowing through the permeable zones of the soil. This becomes particularly relevant in situations involving highway cuts or areas with a high water table situated near the pavement structure. Drainage strategies employed to mitigate this source are classified as subsurface drainage.
This article is concerned with the estimation of surface water runoff from pavements and streets.
Parameters Influencing Surface Water Runoff
During the design of drainage facilities for highway construction, engineers utilise three key parameters of rainfall:
- intensity (rate of fall),
- duration (length of time for a specific intensity), and
- frequency (the expected time interval between occurrences of a specific intensity-duration combination).
For example, the U.S. Weather Bureau maintains a network of automated rainfall gauges that gather nationwide intensity and duration data. This data serves as the basis for the development of rainfall-intensity curves, which are then employed to determine the rainfall intensity for a designated return period and duration.
It is important to acknowledge that any estimations of rainfall intensity, duration, or frequency derived from this data are based on the principles of probability. For instance, designing a culvert to handle a “50-year” flood implies a 1 in 50 chance of the culvert reaching capacity in a given year.
This does not guarantee a precipitation event of that exact intensity and duration will occur precisely every 50 years. In actuality, there’s a possibility of experiencing higher-intensity storms one or more times within the design period, albeit with a lower probability.
This highlights the trade-off between minimizing overflow risk and cost. Designing for infrequent storms translates to significantly larger and more expensive drainage facilities. As such, selecting a design frequency necessitates a cost-benefit analysis.
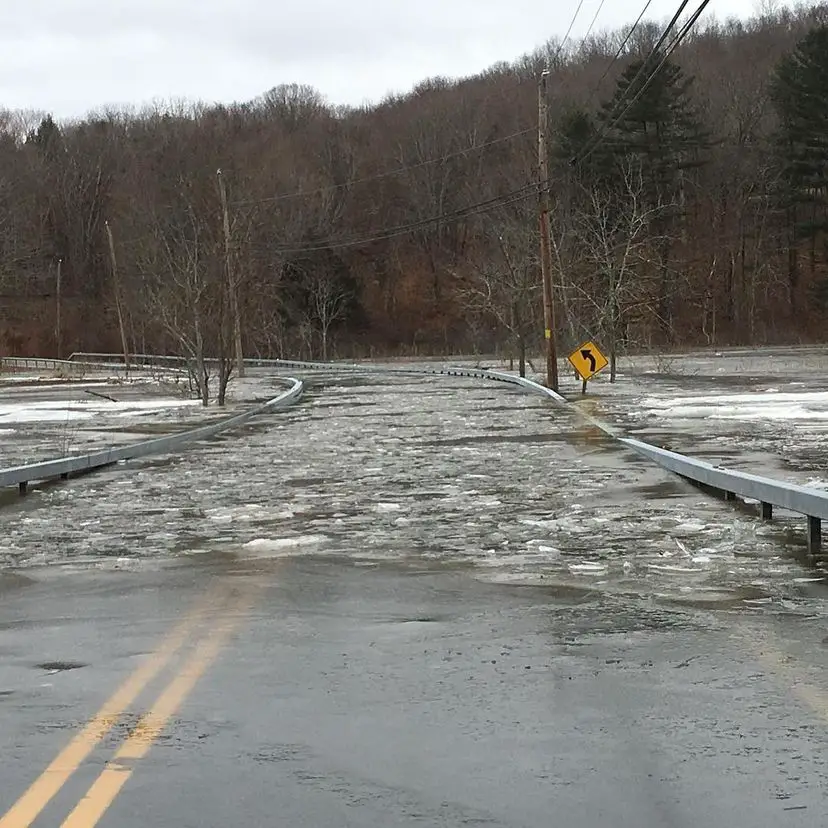
Capital costs for the drainage system are weighed against potential public costs associated with severe highway damage from storm runoff. Factors influencing this decision typically include the highway’s significance, traffic volume, and the surrounding area’s population density.
Beyond rainfall, several other hydrological variables are crucial for the engineer’s determination of surface runoff rates. These include:
Drainage Area: This encompasses the land surface contributing runoff to the specific location where channel capacity needs to be assessed. This is also called the catchment area. Drainage areas are typically delineated using topographic maps. Recently, Google Earth maps have been used to analyse watershed areas.
Runoff Coefficient (C): This coefficient represents the ratio of runoff to rainfall for the designated drainage area. Factors influencing the runoff coefficient include ground cover type, drainage area slope, storm duration, prior ground saturation, and overall land slope.
In cases where the drainage area consists of different ground characteristics with different runoff coefficients, a representative value Cw is computed by determining the weighted coefficient.
Cw = ∑CiAi/∑Ai
where:
Cw = weighted runoff coefficient for the whole drainage area
Ci = runoff coefficient for watershed i
Ai = area of watershed i (acres)
Typical values of runoff coefficient C are;
| Type of Drainage Area | Runoff Coefficient |
| Downtown areas | 0.70 – 0.95 |
| Neighbourhood areas | 0.50 – 0.70 |
| Apartment dwelling areas | 0.50 – 0.70 |
| Light industrial areas | 0.50 – 0.80 |
| Heavy industrial areas | 0.60 – 0.90 |
| Parks, cemetries | 0.10 – 0.25 |
| Unimproved areas | 0.10 – 0.30 |
| Asphaltic pavement streets | 0.70 – 0.85 |
| Concrete pavement streets | 0.80 – 0.95 |
| Cultivated fields | 0.20 – 0.40 |
| Steep grassed areas (2:1) | 0.50 – 0.70 |
It is important to note that a runoff coefficient of 0.75 means that 75% of precipitation in the area will translate to runoff or stormwater.
Time of Concentration (Tc): This parameter reflects the time required for runoff to travel from the farthest hydraulic point within the watershed to the point of interest. Determining the time of concentration for a drainage area is essential for selecting the appropriate average rainfall intensity for a chosen frequency of occurrence.
The time of concentration itself is influenced by several factors such as the size and shape of the drainage area, surface characteristics, slope of the drainage area, rainfall intensity, and whether the flow path is entirely overland or partially channelized.
Determination of Runoff for Drainage Design
The type of surface significantly impacts the amount of runoff generated for a given rainfall intensity and duration. Impervious surfaces like bare rock, roofs, and pavements exhibit much higher runoff rates compared to permeable surfaces such as ploughed fields or dense forests. Therefore, highway engineers strive to quantify the portion of rainfall that translates to runoff.
This task presents a challenge as runoff rates for a specific area during a single rainfall event are typically not static. Fortunately, various methods exist to estimate runoff, with the rational method being explored in this article.
Rational Method
The rational method centres on the principle that a storm’s runoff rate is dictated by three factors: average rainfall intensity, the drainage area’s size, and its surface characteristics. It’s important to acknowledge that real-world rainfall intensity isn’t uniform across large areas or throughout a storm’s duration.
To address this, the rational formula adopts the assumption that for an impervious area (A) experiencing rainfall of average intensity (I), the peak runoff rate (Q) at the drainage area’s outlet occurs when the entire area contributes runoff at a constant rate.
This necessitates a storm duration that’s at least equal to the time of concentration, which signifies the time it takes runoff to travel from the farthest point in the drainage area to the outlet. However, achieving this condition in practice can be challenging, especially for large drainage areas. Consequently, the rational formula is typically applied to relatively small drainage areas, generally not exceeding 200 acres.
The mathematical expression for the rational formula is provided below;
Q = CIA
where:
Q = peak rate of runoff (volume/time)
A = drainage area (Area)
I = average intensity for a selected frequency and duration equal to at least the time of concentration (depth/time)
C = a coefficient representing the fraction of rainfall that remains on the surface of the ground (runoff coefficient)
The units in the rational formula need to be consistent.

Design Example
A 120-acre (485623 m2) urban drainage area in Port Harcourt City Nigeria consists of three different watershed areas as follows.
Streets (asphalt pavement) = 10%
Apartment dwelling areas = 60%
Unimproved areas = 10%
Light industrial area = 20%
If the time of concentration for the drainage area is 1 hr, determine the runoff rate for a storm of 50-yr frequency.
From the rational formula;
Q = 0.278CIA
A = drainage area (km2)
I = rainfall intensity (mm/hr)
C = Average (weighted) runoff coefficient
Runoff coefficients
Streets (asphalt pavement) = 0.75
Apartment dwelling areas = 0.6
Unimproved areas = 0.2
Light industrial area = 0.65
Weighted runoff coefficient = Cw = [0.485(0.1 × 0.75 + 0.6 × 0.6 + 0.1 × 0.2 + 0.2 × 0.65)]/0.485 = 0.585
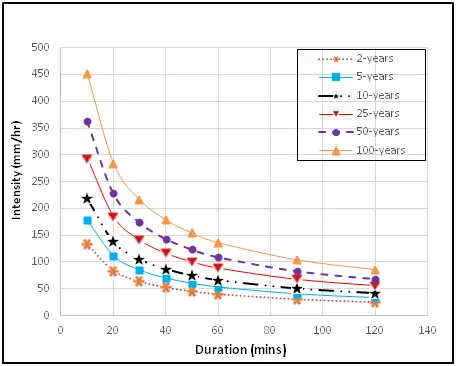
From the rainfall intensity graph of the City of PortHarcourt, the rainfall intensity of a return period of 50 years and duration of 1 hour (60 minutes) is 110 mm/hr
Q = 0.278 × 0.585 × 110 × 0.485 = 8.67 m3/sec
Conclusion
Drainage design for highways considers rainfall as the primary source of water. The rational method, a common tool for this purpose, focuses on three key factors: average rainfall intensity, drainage area size, and surface type.
While real rainfall varies in intensity and duration, the method assumes a constant rate of runoff from an impervious area for a storm whose duration equals the time for water to travel from the farthest drainage point to the outlet. This time is called the time of concentration. Due to limitations in achieving this ideal scenario, the rational method is best suited for relatively small drainage areas, typically under 200 acres.
The results from the rational formula can be used in sizing stormwater drainage facilities such as ditches, culverts, gutters, channels, sewer pipes, etc.
Sources and Citations
Nwaogazie IL, Sam MG. Probability and non-probability rainfall intensity-duration-frequency modeling for port-harcourt metropolis, Nigeria. Int J Hydro. 2019;3(1):66-75. DOI: 10.15406/ijh.2019.03.00164




Thank you for a very informative article.