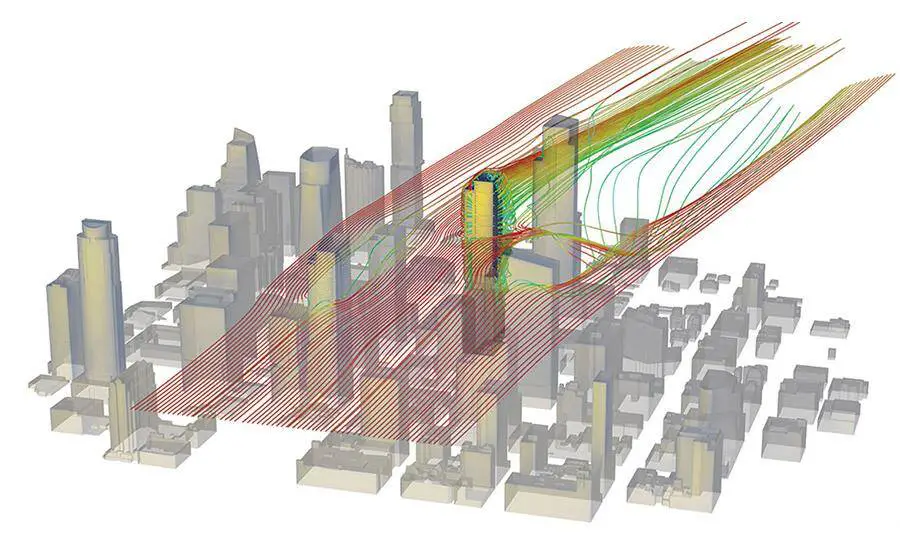
The effect of wind on a building gets more significant as the height of the building increases. Due to the various flow scenarios that result from wind’s interaction with structures, wind load analysis on tall buildings is a very complex phenomenon. In a general stream of air flowing in relation to the earth’s surface, wind is made up of several eddies with different diameters and rotational properties. The wind is turbulent or gusty because of these eddies.
Strong winds’ lower atmosphere gustiness is mostly caused by contact with surface structures. While the gustiness of the wind tends to diminish with height, the average wind speed tends to increase over a period of time of the order of ten minutes or more. The size of the eddies affects the dynamic loading on a structure as a result of turbulence. Large eddies that are comparable in size to the structure create well-correlated pressures as they encircle it. On the other hand, minor eddies cause stresses on different regions of a structure that are essentially unrelated to the separation between them.
Some buildings, especially tall or slender ones, react to the influences of wind in a dynamic way. The causes of a structure’s dynamic response to wind are a variety of different occurrences. These include galloping, fluttering, buffeting, and vortex shedding. Due to turbulence buffeting, thin structures are likely to be sensitive to dynamic reactions in the direction of the wind.
Although turbulence buffeting can also cause a transverse or cross-wind reaction, vortex shedding or galloping is more likely to cause one. Flutter is a linked motion that frequently combines torsion and bending and can cause instability.
Design Wind Load Pressure
The geometry of the structure under consideration, the geometry and proximity of the structures upwind, and the characteristics of the approaching wind all influence the features of wind pressures on that structure. The wind is gusty, which contributes to the pressure fluctuations, but local vortex shedding around the borders of the buildings themselves is also a factor.
If a structure is dynamically wind-sensitive, the varying pressures can cause fatigue damage to it as well as dynamic excitation. Additionally, the pressures are not constant along the surface of the structure but rather change according to position.
When using a design document, it is important to keep in mind the complexity of wind loading. The maximum wind loads that a structure would sustain over the course of its lifetime may differ significantly from those estimated during design due to the numerous unknowns involved. As a result, the success or failure of a structure in a windstorm cannot always be interpreted as a sign of the conservatism or non-conservatism of the Wind Loading Standard.
Buildings and constructions with distinctive shapes or locations are exempt from the Standards’ application. Some types of constructions, such as tall skyscrapers and thin towers, are designed according to wind loading. It frequently becomes appealing to use experimental wind tunnel data instead of the Wind Loading Code coefficients for these buildings.
In this article, wind load analysis has been carried out on a 60m tall high-rise building using the method described in EN 1991-1-4:2005 (General actions – Wind action). The structure is assumed to be located in an area with a basic wind speed of 40 m/s.
Basic Data
Height of building = 60m
Width of a building = 30m
Structure – Framed building
The structure is located at terrain category II (see Table below)
Basic wind velocity
The fundamental value of the basic wind velocity Vb,0 is the characteristic 10 minute mean wind velocity irrespective of wind direction and time of the year, at 10 m above ground level in open-country terrain with low vegetation such as grass, and with isolated obstacles with separations of at least 20 obstacle heights.
The basic wind velocity Vb,0 is calculated from;
Vb = Cdir . Cseason .Vb,0
Where:
Vb is the basic wind velocity defined as a function of wind direction and time of the year at 10m above the ground of terrain category II
Vb,0 is the fundamental value of the basic wind velocity
Cdir is the directional factor (defined in the National Annex, but recommended value is 1.0)
Cseason is the season factor (defined in the National Annex, but recommended value is 1.0)
For the area and location of the building that we are considering;
Basic wind velocity Vb,0 = 40 m/s
Vb = Cdir. Cseason.Vb,0 = 1.0 × 1.0 × 40 = 40 m/s
Mean Wind
The mean wind velocity Vm(z) at a height z above the terrain depends on the terrain roughness and orography, and on the basic wind velocity, Vb, and should be determined using the expression below;
Vm(z) = cr(z). co(z).Vb
Where;
cr(z) is the roughness factor (defined below)
co(z) is the orography factor often taken as 1.0
The terrain roughness factor accounts for the variability of the mean wind velocity at the site of the structure due to the height above the ground level and the ground roughness of the terrain upwind of the structure in the wind direction considered. Terrain categories and parameters are shown in Table 2.0.
cr(z) = kr. In (z/z0) for zmin ≤ z ≤ zmax
cr(z) = cr.(zmin) for z ≤ zmin
Where:
Z0 is the roughness length
kr is the terrain factor depending on the roughness length Z0 calculated using;
kr = 0.19 (Z0/Z0,II)0.07
Where:
Z0,II = 0.05m (terrain category II)
Zmin is the minimum height = 2 m
z = 60 m
Zmax is to be taken as 200 m
Kr = 0.19 (0.05/0.05)0.07 = 0.19
cr(60) = kr.In (z/z0) = 0.19 × In(60/0.05) = 1.347
Therefore;
Vm(60) = cr(z). co(z).Vb = 1.347 × 1.0 × 40 = 53.88 m/s
Wind turbulence
The turbulence intensity Iv(z) at height z is defined as the standard deviation of the turbulence divided by the mean wind velocity. The recommended rules for the determination of Iv(z) are given in the expressions below;
Iv(z) = σv/Vm = kl/(c0(z).In (z/z0)) for zmin ≤ z ≤ zmax
Iv(z) = Iv.(zmin) for z ≤ zmin
Where:
kl is the turbulence factor of which the value is provided in the National Annex but the recommended value is 1.0
Co is the orography factor described above
Z0 is the roughness length described above.
For the building that we are considering, the wind turbulence factor at 60m above the ground level;
Iv(60) = σv/Vm = k1/[c0(z).In(z/z0)] = 1/[1 × In(60/0.05)] = 0.141
Peak Velocity Pressure
The peak velocity pressure qp(z) at height z is given by the expression below;
qp(z) = [1 + 7.Iv(z)] 1/2.ρ.Vm2(z) = ce(z).qb
Where:
ρ is the air density, which depends on the altitude, temperature, and barometric pressure tobe expected in the region during wind storms (recommended value is 1.25kg/m3)
ce(z) is the exposure factor given by;
ce(z) = qp(z)/qb
qb is the basic velocity pressure given by; qb = 0.5.ρ.Vb2
qp(60m) = [1 + 7(0.141)] × 0.5 × 1.25 × 53.882 = 3605.23 N/m2
Therefore, qp(60m) = 3.605 kN/m2
External Pressure Coefficients
From Table 7.1 of EN 1991-1-4:2005 (E)
For the building, taking the height to width ratio h/d = 2.0
Pressure coefficient for windward side = +0.8
Pressure coefficient for leeward side = –0.6
The net pressure coefficient Cpe10 = +0.8 – (–0.6) = 1.4
The net external surface pressure on the structure = qp(z) Cpe10 = 3.6057 × 1.4 = 5.05 kN/m2
Therefore, we = 5.05 kN/m2
Detailed Calculation
Wind loading of a high-rise building in accordance with EN1991-1-3:2005+A1:2010 and the UK national annex.

Building data
Type of roof; Flat
Length of building; L = 30000 mm
Width of building; W = 30000 mm
Height to eaves; H = 60000 mm
Eaves type; Sharp
Total height; h = 60000 mm
Basic values
Location; Ibadan, Nigeria
Wind speed velocity (FigureNA.1); vb,map = 40.0 m/s
Distance to shore; Lshore = 250.00 km
Altitude above sea level; Aalt = 100.0m
Altitude factor; calt = Aalt/1m × 0.001 + 1 = 1.100
Fundamental basic wind velocity; vb,0 = vb,map × calt = 44.0 m/s
Direction factor; cdir = 1.00
Season factor; cseason = 1.00
Shape parameter K; K = 0.2
Exponent n; n = 0.5
Air density; ρ = 1.226 kg/m3
Probability factor; cprob = [(1 – K × ln(-ln(1-p)))/(1 – K × ln(-ln(0.98)))]n = 1.00
Basic wind velocity (Exp. 4.1); vb = cdir × cseason × vb,0 × cprob = 44.0 m/s
Reference mean velocity pressure; qb = 0.5 × ρ × vb2 = 1.187 kN/m2
Orography
Orography factor not significant; co = 1.0
Terrain category; Country
Displacement height (sheltering effect excluded); hdis = 0mm
The velocity pressure for the windward face of the building with a 0 degree wind is to be considered as 2 parts as the height h is greater than b but less than 2b (cl.7.2.2)
The velocity pressure for the windward face of the building with a 90 degree wind is to be considered as 2 parts as the height h is greater than b but less than 2b (cl.7.2.2)
Peak velocity pressure – windward wall (lower part) – Wind 0 deg
Reference height (at which q is sought); z = 30000mm
Displacement height (sheltering effects excluded); hdis = 0 mm
Exposure factor (Figure NA.7); ce = 3.05
Library item: Peak velocity factors output
Peak velocity pressure; qp = ce × qb = 3.62 kN/m2
Structural factor
Structural damping; ds = 0.100
Height of element; hpart = 30000 mm
Size factor (Table NA.3); cs = 0.895
Dynamic factor (Figure NA.9); cd = 1.000
Structural factor; csCd = cs × cd = 0.895
Peak velocity pressure – windward wall (upper part) – Wind 0 deg and roof
Reference height (at which q is sought); z = 60000mm
Displacement height (sheltering effects excluded); hdis = 0 mm
Exposure factor (Figure NA.7); ce = 3.50
Peak velocity pressure; qp = ce × qb = 4.16 kN/m2
Structural damping; ds = 0.100
Height of element; hpart = 30000 mm
Size factor (Table NA.3); cs = 0.907
Dynamic factor (Figure NA.9); cd = 1.000
Structural factor; csCd = cs × cd = 0.907
Structural factor
Structural damping; ds = 0.100
Height of element; hpart = 60000 mm
Size factor (Table NA.3); cs = 0.888
Dynamic factor (Figure NA.9); cd = 1.000
Structural factor; csCd = cs × cd = 0.888
Peak velocity pressure – windward wall (lower part) – Wind 90 deg
Reference height (at which q is sought); z = 30000mm
Displacement height (sheltering effects excluded); hdis = 0 mm
Exposure factor (Figure NA.7); ce = 3.05
Peak velocity pressure; qp = ce × qb = 3.62 kN/m2
Structural factor
Structural damping; ds = 0.100
Height of element; hpart = 30000 mm
Size factor (Table NA.3); cs = 0.895
Dynamic factor (Figure NA.9); cd = 1.000
Structural factor; csCd = cs × cd = 0.895
Peak velocity pressure – windward wall (upper part) – Wind 90 deg and roof
Reference height (at which q is sought); z = 60000mm
Displacement height (sheltering effects excluded); hdis = 0 mm
Exposure factor (Figure NA.7); ce = 3.50
Peak velocity pressure; qp = ce × qb = 4.16 kN/m2
Structural damping; ds = 0.100
Height of element; hpart = 30000 mm
Size factor (Table NA.3); cs = 0.907
Dynamic factor (Figure NA.9); cd = 1.000
Structural factor; csCd = cs × cd = 0.907
Structural factor
Structural damping; ds = 0.100
Height of element; hpart = 60000 mm
Size factor (Table NA.3); cs = 0.888
Dynamic factor (Figure NA.9); cd = 1.000
Structural factor; csCd = cs × cd = 0.888
Peak velocity pressure for internal pressure
Peak velocity pressure – internal (as roof press.); qp,i = 4.16 kN/m2
Pressures and forces
Net pressure; p = csCd × qp × cpe – qp,i × cpi;
Net force; Fw = pw × Aref;
Roof load case 1 – Wind 0, cpi 0.20, -cpe

| Zone | Ext pressure coeff cpe | Peak velocity pressure qp (kN/m2) | Net pressure element, pe (kN/m2) | Net pressure structure ps (kN/m2) | Area Aref (m2) | Net force element Fw,e (kN) | Net force structure Fw,s (kN) |
| F (-ve) | -2.00 | 4.16 | -9.15 | -8.22 | 45.00 | -411.69 | -369.93 |
| G (-ve) | -1.40 | 4.16 | -6.65 | -6.00 | 45.00 | -299.41 | -270.18 |
| H (-ve) | -0.70 | 4.16 | -3.74 | -3.42 | 360.00 | -1347.33 | -1230.43 |
| I (-ve) | -0.20 | 4.16 | -1.66 | -1.57 | 450.00 | -748.52 | -706.77 |
Total vertical net force; Fw,v = -2577.31 kN
Total horizontal net force; Fw,h = 0.00 kN
Walls load case 1 – Wind 0, cpi 0.20, -cpe
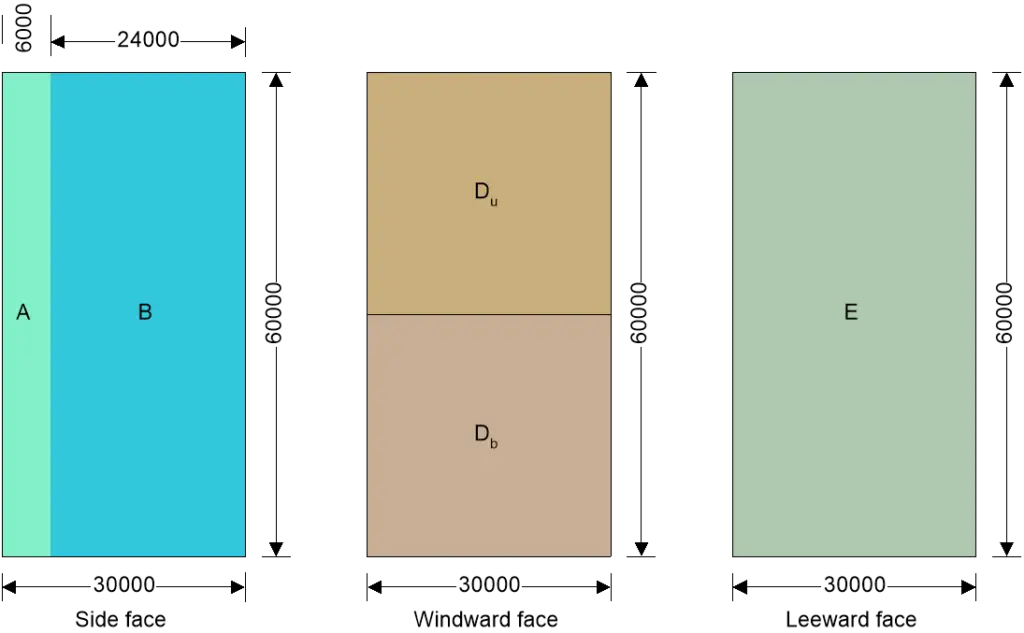
| Zone | Ext pressure coeff cpe | Peak velocity pressure qp (kN/m2) | Net pressure element, pe (kN/m2) | Net pressure structure ps (kN/m2) | Area Aref (m2) | Net force element Fw,e (kN) | Net force structure Fw,s (kN) |
| A | -1.20 | 4.16 | -5.82 | -5.36 | 360.00 | -2095.85 | -1928.18 |
| B | -0.80 | 4.16 | -4.16 | -3.85 | 1440.00 | -5988.15 | -5541.03 |
| Db | 0.80 | 3.62 | 2.07 | 1.76 | 900.00 | 1859.33 | 1585.51 |
| Du | 0.80 | 4.16 | 2.50 | 2.18 | 900.00 | 2245.55 | 1966.11 |
| E | -0.55 | 4.16 | -3.12 | -2.91 | 1800.00 | -5613.89 | -5229.65 |
Overall loading
Equivalent leeward net force for upper section;
Fl = Fw,wEs / Aref,wE × Aref,wu = -2614.8 kN
Net windward force for upper section;
Fw = Fw,wus = 1966.1 kN
Lack of correlation (cl.7.2.2(3) – Note);
fcorr = 0.89; as h/W is 2.000
Overall loading upper section;
Fw,u = fcorr × (Fw – Fl + Fw,h) = 4065.6 kN
Equiv leeward net force for bottom section;
Fl = Fw,wEs / Aref,wE × Aref,wb = -2614.8 kN
Net windward force for bottom section;
Fw = Fw,wbs = 1585.5 kN
Lack of correlation (cl.7.2.2(3) – Note);
fcorr = 0.89; as h/W is 2.000
Overall loading bottom section;
Fw,b = fcorr × (Fw – Fl) = 3727.8 kN
Roof load case 2 – Wind 0, cpi -0.3, +cpe
| Zone | Ext pressure coeff cpe | Peak velocity pressure qp (kN/m2) | Net pressure element, pe (kN/m2) | Net pressure structure ps (kN/m2) | Area Aref (m2) | Net force element Fw,e (kN) | Net force structure Fw,s (kN) |
| F (+ve) | -2.00 | 4.16 | -7.07 | -6.14 | 45.00 | -318.12 | -276.37 |
| G (+ve) | -1.40 | 4.16 | -4.57 | -3.92 | 45.00 | -205.84 | -176.62 |
| H (+ve) | -0.70 | 4.16 | -1.66 | -1.34 | 360.00 | -598.81 | -481.91 |
| I (+ve) | 0.20 | 4.16 | 2.08 | 1.99 | 450.00 | 935.65 | 893.90 |
Total vertical net force; Fw,v = -41.00 kN
Total horizontal net force; Fw,h = 0.00 kN
Walls load case 2 – Wind 0, cpi -0.3, +cpe
| Zone | Ext pressure coeff cpe | Peak velocity pressure qp (kN/m2) | Net pressure element, pe (kN/m2) | Net pressure structure ps (kN/m2) | Area Aref (m2) | Net force element Fw,e (kN) | Net force structure Fw,s (kN) |
| A | -1.20 | 4.16 | -3.74 | -3.28 | 360.00 | -1347.33 | -1179.66 |
| B | -0.80 | 4.16 | -2.08 | -1.77 | 1440.00 | -2994.07 | -2546.96 |
| Db | 0.80 | 3.62 | 4.15 | 3.84 | 900.00 | 3730.63 | 3456.80 |
| Du | 0.80 | 4.16 | 4.57 | 4.26 | 900.00 | 4116.85 | 3837.40 |
| E | -0.55 | 4.16 | -1.04 | -0.83 | 1800.00 | -1871.30 | -1487.06 |
Overall loading
Equivalent leeward net force for upper section;
Fl = Fw,wEs / Aref,wE × Aref,wu = -743.5 kN
Net windward force for upper section;
Fw = Fw,wus = 3837.4 kN
Lack of correlation (cl.7.2.2(3) – Note);
fcorr = 0.89; as h/W is 2.000
Overall loading upper section;
Fw,u = fcorr × (Fw – Fl + Fw,h) = 4065.6 kN
Library item: Overall loading output
Equiv leeward net force for bottom section;
Fl = Fw,wEs / Aref,wE × Aref,wb = -743.5 kN
Net windward force for bottom section;
Fw = Fw,wbs = 3456.8 kN
Lack of correlation (cl.7.2.2(3) – Note);
fcorr = 0.89; as h/W is 2.000
Overall loading bottom section;
Fw,b = fcorr × (Fw – Fl) = 3727.8 kN
Roof load case 3 – Wind 90, cpi 0.20, -cpe

| Zone | Ext pressure coeff cpe | Peak velocity pressure qp (kN/m2) | Net pressure element, pe (kN/m2) | Net pressure structure ps (kN/m2) | Area Aref (m2) | Net force element Fw,e (kN) | Net force structure Fw,s (kN) |
| F (-ve) | -2.00 | 4.16 | -9.15 | -8.22 | 45.00 | -411.69 | -369.93 |
| G (-ve) | -1.40 | 4.16 | -6.65 | -6.00 | 45.00 | -299.41 | -270.18 |
| H (-ve) | -0.70 | 4.16 | -3.74 | -3.42 | 360.00 | -1347.33 | -1230.43 |
| I (-ve) | -0.20 | 4.16 | -1.66 | -1.57 | 450.00 | -748.52 | -706.77 |
Total vertical net force; Fw,v = -2577.31 kN
Total horizontal net force; Fw,h = 0.00 kN
Walls load case 3 – Wind 90, cpi 0.20, -cpe

| Zone | Ext pressure coeff cpe | Peak velocity pressure qp (kN/m2) | Net pressure element, pe (kN/m2) | Net pressure structure ps (kN/m2) | Area Aref (m2) | Net force element Fw,e (kN) | Net force structure Fw,s (kN) |
| A | -1.20 | 4.16 | -5.82 | -5.36 | 360.00 | -2095.85 | -1928.18 |
| B | -0.80 | 4.16 | -4.16 | -3.85 | 1440.00 | -5988.15 | -5541.03 |
| Db | 0.80 | 3.62 | 2.07 | 1.76 | 900.00 | 1859.33 | 1585.51 |
| Du | 0.80 | 4.16 | 2.50 | 2.18 | 900.00 | 2245.55 | 1966.11 |
| E | -0.55 | 4.16 | -3.12 | -2.91 | 1800.00 | -5613.89 | -5229.65 |
Overall loading
Equiv leeward net force for upper section;
Fl = Fw,wEs / Aref,wE × Aref,wu = -2614.8 kN
Net windward force for upper section;
Fw = Fw,wus = 1966.1 kN
Lack of correlation (cl.7.2.2(3) – Note);
fcorr = 0.89; as h/L is 2.000
Overall loading upper section;
Fw,u = fcorr × (Fw – Fl + Fw,h) = 4065.6 kN
Library item: Overall loading output
Equiv leeward net force for bottom section;
Fl = Fw,wEs / Aref,wE × Aref,wb = -2614.8 kN
Net windward force for bottom section;
Fw = Fw,wbs = 1585.5 kN
Lack of correlation (cl.7.2.2(3) – Note);
fcorr = 0.89; as h/L is 2.000
Overall loading bottom section;
Fw,b = fcorr × (Fw – Fl) = 3727.8 kN
Roof load case 4 – Wind 90, cpi -0.3, +cpe
| Zone | Ext pressure coeff cpe | Peak velocity pressure qp (kN/m2) | Net pressure element, pe (kN/m2) | Net pressure structure ps (kN/m2) | Area Aref (m2) | Net force element Fw,e (kN) | Net force structure Fw,s (kN) |
| F (+ve) | -2.00 | 4.16 | -7.07 | -6.14 | 45.00 | -318.12 | -276.37 |
| G (+ve) | -1.40 | 4.16 | -4.57 | -3.92 | 45.00 | -205.84 | -176.62 |
| H (+ve) | -0.70 | 4.16 | -1.66 | -1.34 | 360.00 | -598.81 | -481.91 |
| I (+ve) | 0.20 | 4.16 | 2.08 | 1.99 | 450.00 | 935.65 | 893.90 |
Total vertical net force; Fw,v = -41.00 kN
Total horizontal net force; Fw,h = 0.00 kN
Walls load case 4 – Wind 90, cpi -0.3, +cpe
| Zone | Ext pressure coeff cpe | Peak velocity pressure qp (kN/m2) | Net pressure element, pe (kN/m2) | Net pressure structure ps (kN/m2) | Area Aref (m2) | Net force element Fw,e (kN) | Net force structure Fw,s (kN) |
| A | -1.20 | 4.16 | -3.74 | -3.28 | 360.00 | -1347.33 | -1179.66 |
| B | -0.80 | 4.16 | -2.08 | -1.77 | 1440.00 | -2994.07 | -2546.96 |
| Db | 0.80 | 3.62 | 4.15 | 3.84 | 900.00 | 3730.63 | 3456.80 |
| Du | 0.80 | 4.16 | 4.57 | 4.26 | 900.00 | 4116.85 | 3837.40 |
| E | -0.55 | 4.16 | -1.04 | -0.83 | 1800.00 | -1871.30 | -1487.06 |
Overall loading
Equiv leeward net force for upper section;
Fl = Fw,wEs / Aref,wE × Aref,wu = -743.5 kN
Net windward force for upper section;
Fw = Fw,wus = 3837.4 kN
Lack of correlation (cl.7.2.2(3) – Note);
fcorr = 0.89; as h/L is 2.000
Overall loading upper section;
Fw,u = fcorr × (Fw – Fl + Fw,h) = 4065.6 kN
Library item: Overall loading output
Equiv leeward net force for bottom section;
Fl = Fw,wEs / Aref,wE × Aref,wb = -743.5 kN
Net windward force for bottom section;
Fw = Fw,wbs = 3456.8 kN
Lack of correlation (cl.7.2.2(3) – Note);
fcorr = 0.89; as h/L is 2.000
Overall loading bottom section;
Fw,b = fcorr × (Fw – Fl) = 3727.8 kN






I want to request for PDf file on tall buildings, sodekeaugustine3@gmail.com Thanks
Kindly send me a pdf on murageantony24@gmail.com
stefano.barone.87@gmail.com
Thank you in advance!
Please send me pdf on harshvardhanpatil123@gmail.com, i’m a Mtech student I need this research paper for my project purpose.
Could I kindly have the pdf to this adress giuseppemartino.erbi@gmail.com? Thank you so much. I am following all your fabulous articles. Thank for share them. Kind Regards.
maazina.khan@gmail.com
Is it possible I get the pdf file on tall buildings sir? bspcltd@yahoo.com
Thank you
ahmad.naqvi@hotmail.com
From these calculations, it is not clear that the wind profile varies with height….or the requirements that lead to your assumptions.
Congratulations for your contributions…keep up
The Eurocode National Annex to BS EN 1991-1-4 Allows the use of an coefficient which can be used to calculate the overall wind load on the building.
Please arrange to mail pdf file in my email id:- kishor_bsnl@yahoo.com
Please, kindly send this pdf format to email: kayodeoni@aol.com. Thanks and God bless
Please provide the PDF file… simplyajaylamba@gmail.com
Nice Content Thanks for sharing .. COBie adaptation
BIM documentation in India
BIM Consulting in India
cad services in India
Dear Engineer help in analysis wind load
on vertical wall having height between width and two times width and
height greater than two times width if you have related data as per
Euro code 1991,1-4 0r Es En 1991,1-4 ,2015 please help me
how calculate the wind pressure variation due to height or height b/n b and 2b or more than 2 width b.
You are doing a great job sir???