Signboards, with their captivating visuals and strategic placements, are very popular elements for advertisement in our towns, streets, and highways. However, the structural stability of signboards hinges on their ability to withstand the dynamic forces of wind. This requires a detailed wind load analysis from the design engineer.
Billboard advertising, despite facing competition from digital alternatives, remains a significant player in the marketing landscape. To understand its economic impact, global billboard advertising spending reached $36.8 billion in 2022, with predictions of a steady rise to $44.2 billion by 2027. The United States accounts for the largest share (around 40%), followed by China and Europe.

Wind Loads on Signboards
Wind force is the most critical action on billboards. Their cantilevered design, supported by a single column, exposes them to wind-induced stresses. Failure due to wind and hurricanes has been reported, necessitating rigorous analysis and design. Other effects, such as imperfections and the p-delta phenomenon, also impact structural performance under wind load. Wind exerts pressure on objects, generating a force proportional to the wind speed squared. This force, known as wind load, varies with factors like:
- Location: Geographic location determines wind speeds within established design wind speed maps.
- Terrain: Topography influences wind turbulence and local wind speeds.
- Exposure category: Building codes categorize zones based on surrounding obstructions, impacting wind pressures.
- Signboard geometry: Size, shape, and orientation of the signboard directly influence the wind load experienced.
Methods and Tools for Wind Load Analysis
Several methods are employed for wind load analysis of signboards:
- Simplified methods: Building codes often provide simplified equations based on specific geometries and exposure categories. However, these methods may not always be suitable for complex designs.
- Wind tunnel testing: Physical scale models of the signboard are subjected to simulated wind conditions in a wind tunnel, providing accurate pressure data. This method is expensive but precise, especially for unique designs.
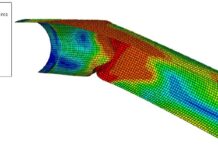
- Computational Fluid Dynamics (CFD) simulations: Numerical simulations model wind flow around the signboard using specialized software. This is a cost-effective alternative to wind tunnel testing, offering valuable insights into complex geometries.
Dynamic Considerations
While static wind loads are vital, signboards may experience dynamic effects like flutter and vortex shedding, resulting in vibrations and potential fatigue failure. Advanced analysis methods or wind tunnel testing may be necessary to assess these dynamic effects, especially for tall and slender signboards.
Wind Load Analysis Example
Let us carry out a wind load analysis on an 8m high signboard in a city centre where the basic wind speed is 35 m/s. The calculated effective wind pressure weff, total wind force FW, and total wind overturning moment MW correspond to the total wind action effects and they are appropriate for global verifications of the element according to the force coefficient method.
For local verifications, appropriate wind pressure on local surfaces must be estimated according to the relevant external pressure coefficients, as specified in EN1991-1-4 §5.2. The calculated wind action effects are characteristic values (unfactored). Appropriate load factors should be applied to the relevant design situation. For ULS verifications the partial load factor γQ = 1.50 is applicable for variable actions.
Input Data
- Terrain category: = II
- Basic wind velocity: vb = 35 m/s
- Width of the signboard wind-loaded area: b = 10 m
- Height of the signboard wind-loaded area: h = 3 m
- Separation height of the signboard wind-loaded area from the ground: zg = 5 m
- Orography factor at reference height ze: c0(ze) = 1
- Structural factor: cscd = 1
- Air density: ρ = 1.25 kg/m3
- Additional rules defined in the National Annex for the calculation of peak velocity pressure qp(ze): = None
- The horizontal eccentricity of the centre of pressure from the centre of the signboard as a fraction of the width b: e/b = 0.25
Calculation of peak velocity pressure
Reference area and height
The reference height for the wind action ze is located at the centre of the signboard, as specified in EN1991-1-4 §7.4.3(3). The reference area for the wind action Aref is the wind-loaded area of the signboard, as specified in EN1991-1-4 §7.4.3(3). Therefore:
ze = zg + h / 2 = 5.000 m + 3.000 m / 2 = 6.500 m
Aref = b ⋅ h = 10.000 m ⋅ 3.000 m = 30.00 m2

Basic wind velocity
The basic wind velocity vb is defined in EN1991-1-4 §4.2(2)P as a function of the wind direction and time of year at 10 m above ground of terrain category II. The value of vb includes the effects of the directional factor cdir and the seasonal factor cseason and it is provided in the National Annex. In the following calculations, the basic wind velocity is considered as vb = 35.00 m/s.
Terrain roughness
The roughness length z0 and the minimum height zmin are specified in EN1991-1-4 Table 4.1 as a function of the terrain category. For terrain category II the corresponding values are z0 = 0.050 m and zmin = 2.0 m. The terrain factor kr depending on the roughness length z0 = 0.050 m is calculated in accordance with EN1991-1-4 equation (4.5):
kr = 0.19 ⋅ (z0 / z0,II)0.07 = 0.19 ⋅ (0.050 m / 0.050 m)0.07 = 0.1900
The roughness factor cr(ze) at the reference height ze accounts for the variability of the mean wind velocity at the site. It is calculated in accordance with EN1991-1-4 equation 4.4. For the examined case ze ≥ zmin:
cr(ze) = kr ⋅ ln(max{ze, zmin} / z0) = 0.1900 ⋅ ln(max{6.500 m, 2.0 m} / 0.050 m) = 0.9248
Orography factor
Where orography (e.g. hills, cliffs etc.) is significant its effect on the wind velocities should be taken into account using an orography factor c0(ze) different than 1.0, as specified in EN1994-1-1 §4.3.3. The recommended procedure in EN1994-1-1 §4.3.3 for the calculation of the orography factor c0(ze) is described in EN1994-1-1 §A.3.
In the following calculations, the orography factor is considered as c0(ze) = 1.000.
Mean wind velocity
The mean wind velocity vm(ze) at reference height ze depends on the terrain roughness, terrain orography and the basic wind velocity vb. It is determined using EN1991-1-4 equation (4.3):
vm(ze) = cr(ze) ⋅ c0(ze) ⋅ vb = 0.9248 ⋅ 1.000 ⋅ 35.00 m/s = 32.37 m/s
Wind turbulence
The turbulence intensity Iv(ze) at reference height ze is defined as the standard deviation of the turbulence divided by the mean wind velocity. It is calculated in accordance with EN1991-1-4 equation 4.7. For the examined case ze ≥ zmin.
Iv(ze) = kI / [ c0(ze) ⋅ ln(max{ze, zmin} / z0) ] = 1.000 / [ 1.000 ⋅ ln(max{6.500 m, 2.0 m} / 0.050 m) ] = 0.2054
Basic velocity pressure
The basic velocity pressure qb is the pressure corresponding to the wind momentum determined at the basic wind velocity vb. The basic velocity pressure is calculated according to the fundamental relation specified in EN1991-14 §4.5(1):
qb = (1/2) ⋅ ρ ⋅ vb2 = (1/2) ⋅ 1.25 kg/m3 ⋅ (35.00 m/s)2 = 766 N/m2 = 0.766 kN/m2
where ρ is the density of the air in accordance with EN1991-1-4 §4.5(1). In this calculation the following value is considered: ρ = 1.25 kg/m3. Note that by definition 1 N = 1 kg⋅m/s2.
Peak velocity pressure
The peak velocity pressure qp(ze) at reference height ze includes mean and short-term velocity fluctuations. It is determined according to EN1991-1-4 equation 4.8:
qp(ze) = (1 + 7⋅Iv(ze)) ⋅ (1/2) ⋅ ρ ⋅ vm(ze)2 = (1 + 7⋅0.2054) ⋅ (1/2) ⋅ 1.25 kg/m3 ⋅ (32.37 m/s)2 = 1597 N/m2
⇒ qp(ze) = 1.597 kN/m2
Note that by definition 1 N = 1 kg⋅m/s2.
Calculation of wind forces on the structure
Structural factor
The structural factor cscd is determined in accordance with EN1991-1-4 Section 6. A value of cscd = 1.0 is generally conservative for small structures not susceptible to wind turbulence effects. In the following calculations, the structural factor is considered as cscd = 1.000.
Force coefficient
The force coefficient cf is given in EN1991-1-4 Sections 7 and 8 depending on the type of structure or structural element. According to EN1991-1-4 §7.4.3, for signboards with zg ≥ h / 4 or b / h ≤ 1, the force coefficient is cf = 1.800.
Total wind force
The wind force on the structure Fw for the overall wind effect is estimated according to the force coefficient method as specified in EN1991-1-4 §5.3.
Fw = cscd ⋅ cf ⋅ qp(ze) ⋅ Aref = 1.000 ⋅ 1.800 ⋅ 1.597 kN/m2 ⋅ 30.00 m2 = 86.216 kN
The total wind force Fw takes into account the overall wind effect. The corresponding effective wind pressure weff on the reference wind area Aref is equal to:
weff = Fw / Aref = 86.216 kN / 30.00 m2 = 2.874 kN/m2
This effective pressure weff = 2.874 kN/m2 is appropriate for global verifications of the structure according to the force coefficient method. It is not appropriate for local verifications of structural elements. For the latter case appropriate wind pressure on local surfaces must be estimated according to the relevant pressure coefficients, as specified in EN1991-1-4 §5.2.
Overturning moment
According to EN1991-1-4 §7.4.3 the resultant force normal to the signboard should be taken to act at the height of the center of the signboard. The total overturning moment Mw acting at the base of the structure is equal to:
Mw = Fw ⋅ (zg + h / 2) = 86.216 kN ⋅ (5.000 m + 3.000 m / 2) = 560.40 kNm
The overturning moment corresponds to the wind action total effect, i.e. it is the total overturning moment for all the base supports.
Horizontal eccentricity
According to EN1991-1-4 §7.4.3 and the National Annex, the resultant force normal to the signboard should be taken to act with a horizontal eccentricity e. In this calculation, the following normalized eccentricity is considered e/b = ±0.250, where b is the width of the signboard wind-loaded area. The total torsional moment Tw acting at the base of the structure is equal to:
Tw = ±0.250 ⋅ b ⋅ Fw = ±0.250 ⋅ 10.000 m ⋅ 86.216 kN = 215.54 kNm
The torsional moment corresponds to the wind action total effect, i.e. it is the total torsional moment for all the base supports.
Conclusion
Wind load analysis is a crucial step in ensuring the safety and durability of signboards. By understanding wind forces, employing appropriate analysis methods, and considering structural design principles, engineers can guarantee structurally sound signboards that stand the test of time.


