Courbon’s theory is one of the popular classical methods of analysing slab and beam girder (T-beam) bridges. However, the results obtained from the method are usually very uneconomical when compared with other numerical methods like grillage analogy. It is one of the easiest manual calculation methods that can be adopted in evaluating the effect of traffic actions in bridge deck girders.
Courbon’s theory was originally developed for bridge girders with series of cross beams (diaphragm) in which the cross beams are stiff enough to provide adequate lateral stiffness. By implication, the application of the method requires that the cross beams will have a depth not less than 75% of the main longitudinal girders. It also requires that the span to width ratio of the bridge will be greater than 2 but less than 4.

Let us consider the application of Courbon’s theory on the bridge deck arrangement shown above. When the beams are equally spaced and geometrically equal, the reaction factor for each beam is given by equation (1);
Ri = P{(1/n) + 6ei/[nS(n + 1)]} ——- (1)
Where;
Ri = Reaction factor
P = Applied load
n = Number of longitudinal beams
S = Spacing of longitudinal beams
ei = Eccentricity of load with respect to the centroidal axis of the bridge deck
If we set P = 1.0, we can obtain the influence line pertaining to each beam.
Solved Example
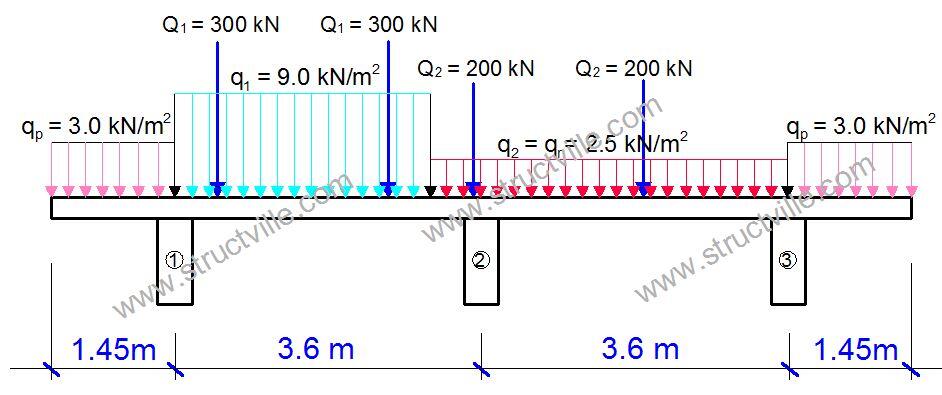
A T-beam bridge deck with 3 girders is loaded according to Load Model 1 of EN 1991-2 as shown below. Using Courbon’s method, calculate the bending moment and shear force on girder number 1.
Setting P= 1.0 at girder number 1 as shown below, we can obtain the influence diagram using equation (1).
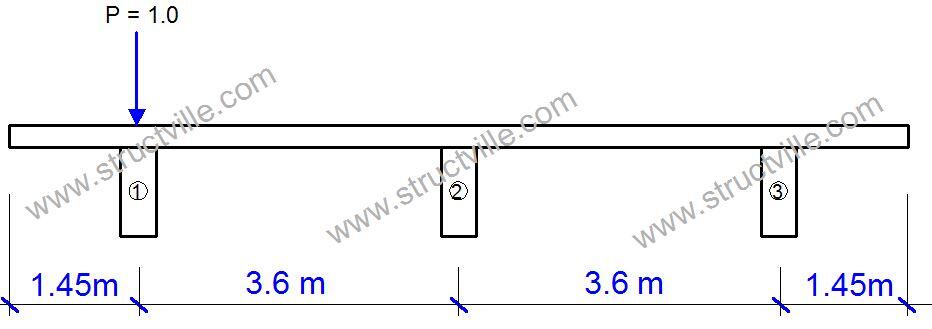
Ri = P{(1/n) + 6ei/[nS(n + 1)]}
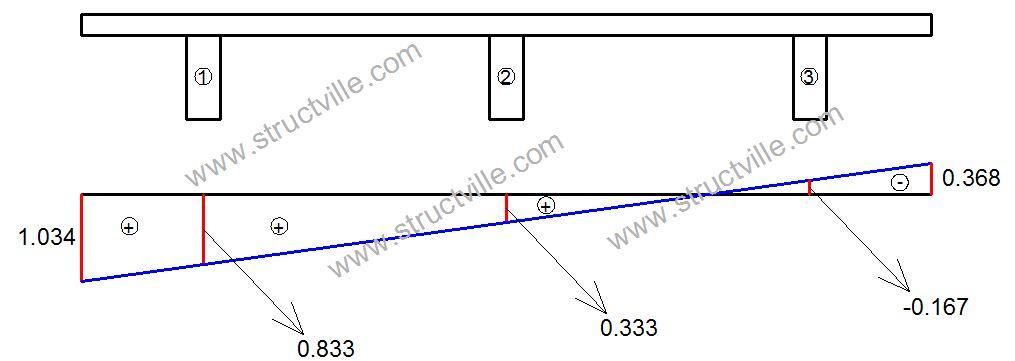
R1 = 1.0{(1/3) + (6 x 3.6)/[3 x 3.6(3 + 1)]} = 0.833
R2 = 1.0{(1/3) + (6 x 0)/[3 x 3.6(3 + 1)]} = 0.333
R3 = 1.0{(1/3) + (6 x -3.6)/[3 x 3.6(3 + 1)]} = -0.167
The influence diagram for the girder is therefore given below. The values at the two cantilever portions of the bridge deck can be obtained using similar triangles.
We can therefore apply the Load Model 1 on the influence line diagram. You will need careful calculation of the ordinates of the influence line diagram using similar triangle.
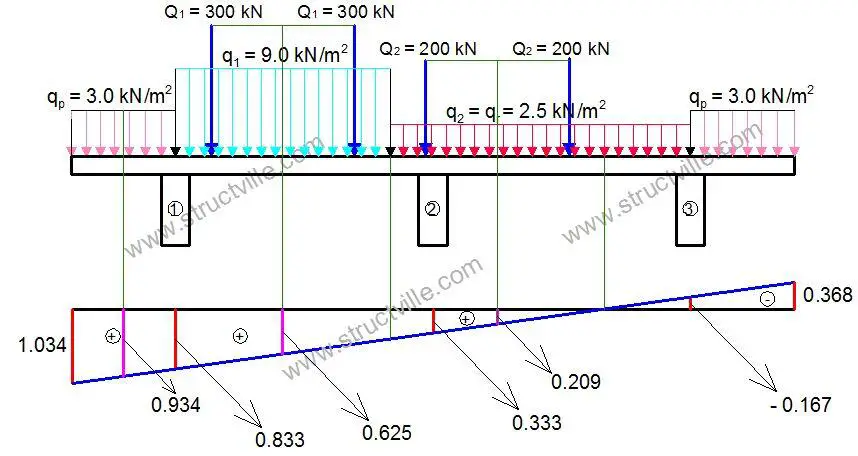
For the tandem wheel loads (concentrated wheel actions), we will multiply the wheel load by the ordinate that the influence line makes with the centreline of each tandem wheel load;
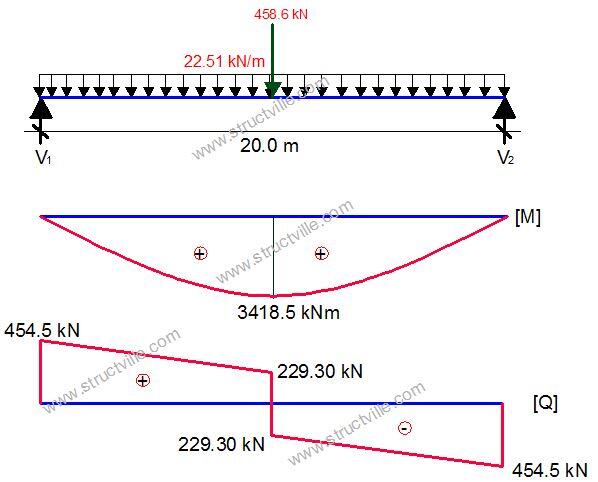
QT = (600 x 0.625) + (400 x 0.209) = 458.6 kN
For the uniformly distributed loads, we will multiply the load (udl) by the width and by the centroid the load makes with the ordinate of the influence line. We normally neglect the beneficial effect of the negative part of the influence line.
wT = (3 x 1.45 x 0.934) + (9 x 3 x 0.625) + (2.5 x 3 x 0.209) = 22.51 kN/m
Let us assume that we are dealing with 20m span bridge, the preliminary effect of the vehicle action on the girder can be taken as given below;
Thank you for visiting Structville today, and remember to share this post.





Interesting and I would love to be tutored some more on this.