During the shear strength test of soils using a triaxial machine, one of the major ways of monitoring stress changes is by showing the Mohr’s stress circles at different stages of loading/unloading. However, this may be difficult to plot as well as confusing when a number of circles are to be shown in the same diagram. In this case, a stress path may be used to show the changes in stress in the soil or material.
A Stress Path is therefore a curve or a straight line which is the locus of a series of stress points showing the changes in stress in a test specimen or in a soil element in-situ, during loading or unloading, engineered as in a triaxial test in the former case or caused by forces of nature as in the latter. This idea that the locus of points depicting the maximum shear stress acting on a soil sample can be drawn as a stress path in place corresponding Mohr’s circle was suggested by Lambe and Whitman (1969). This is shown in Fig 2.
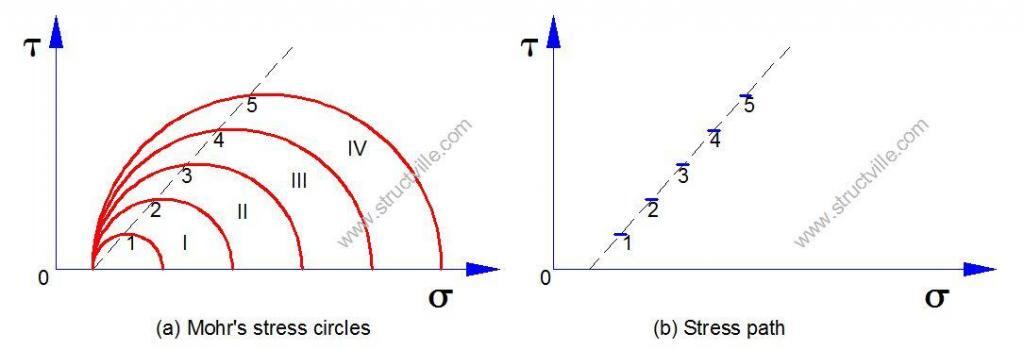
The co-ordinates of the points on the stress path are (σ1 + σ3)/2 and (σ1 – σ3)/2.
When stress paths only are plotted then the axes of the diagram are really particular values of the shear stress τ and normal stress σ. These values are commonly referred to as q and p. Mean stress, p, is the average stress on a body or the average of the orthogonal stresses in three dimensions. Deviatoric stress, q, is the shear or distortional stress or stress difference on a body. p and q are called stress invariants and do not depend on the axis system chosen.
p = mean stress = (σ1 + σ3)/2
q = deviator stress = (σ1 – σ3)/2
If q is considered in terms of effective stress;
(σ’1 – σ’3)/2 = [(σ1 – u) – (σ3 – u)]/2 = (σ1 – σ3)/2
This shows that q is the same regardless of whether total stresses or effective stresses are being considered. In other words, the deviatoric (shear) stress is unaffected by pore water pressure. Since q is equal to the radius of the Mohr circle this means that the total and effective Mohr circles must always have the same size
By implication, either the effective stresses or the total stresses may be used for plotting stress paths. The basic types of stress path and the co-ordinates are:
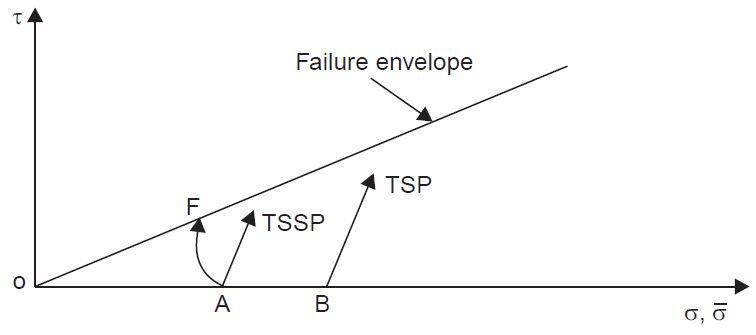
(a) Effective Stress Path (ESP) (p, q) = [(σ’1 + σ’3)/2, (σ’1 – σ’3)/2]
(b) Total Stress Path (TSP) (p, q) = [(σ1 + σ3)/2, (σ1 – σ3)/2]
(c) Stress path of total stress less static pore water pressure (TSSP) (p, q) = [(σ1 + σ3)/2 – u0, (σ1 – σ3)/2]
Where u0 is the static pore water pressure.
The static pore water pressure is zero in the conventional triaxial test, and (b) and (c) coincide in this case. But if backpressure is used in the test, u0 equals the backpressure. For an in-situ element, the static pore water pressure depends upon the level of the groundwater table. Typical stress paths for triaxial compression and extension tests (loading as well as unloading cases) are shown in Fig. 3.
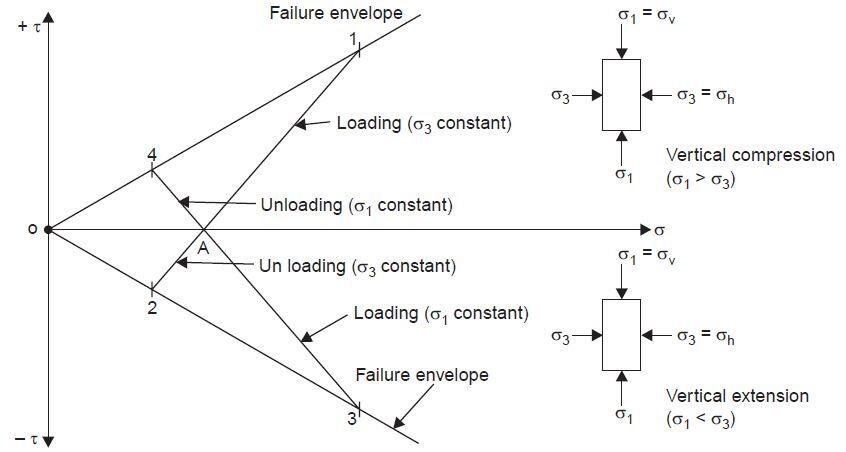
A-1 is the effective stress path for conventional triaxial compression test during loading. (Δσv = positive and Δσh = 0, i.e., σh is constant). A typical field case is a footing subjected to vertical loading.
A-2 is the unloading case of the triaxial extension text (Δσh = 0 and Δσv = negative). Foundation excavation is a typical field example.
A-3 is the loading case of the triaxial extension test (Δσv = 0 and Δσh = positive). Passive earth resistance is represented by this stress path.
A-4 is the unloading case of the triaxial compression test (Δσu = 0 and Δσh = negative). Active earth pressure on retaining walls is the typical field example for this stress path.
Figure 4 shows the typical stress paths for a drained test. Point A corresponds to the stress condition with only the confining pressure acting (σ1 = σ3 and τ = 0). Point F represents failure. Stress paths for effective stresses, total stresses, and total stresses less static pore water pressure are shown separately in the same figure.
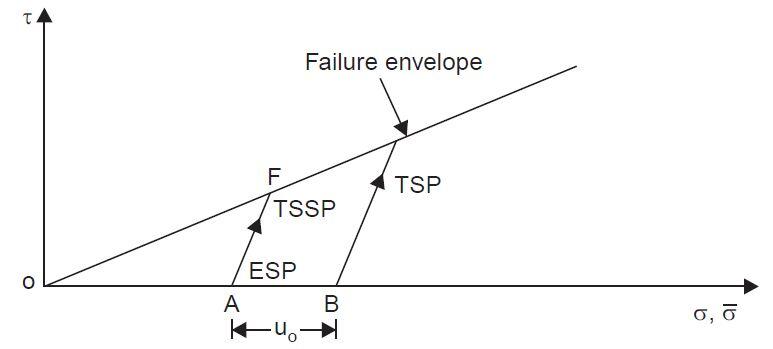
Figure 5 shows the stress paths for a consolidated undrained test on a normally consolidated clay.
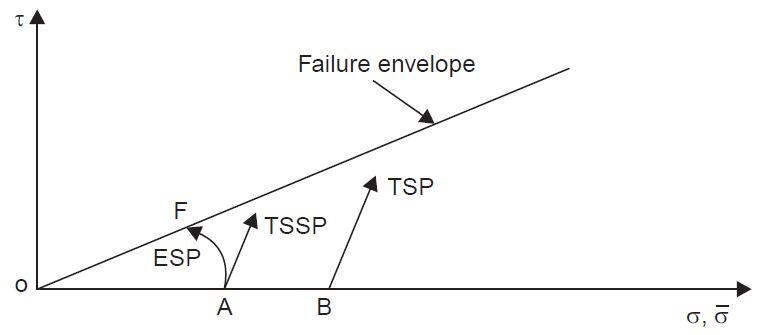
Figure 6 shows the stress paths for a consolidated undrained test on an overconsolidated clay.
Stress path approach enables the engineer to predict and monitor the shear strength mobilized at any stage of loading/unloading in order to ensure the stability of foundation soil.
Procedure for Plotting Stress Paths
A summary of the procedure for plotting stress paths is as follows:
- Determine the loading conditions drained or undrained, or both.
- Calculate the initial loading values of p’o, po, and qo.
- Set up a graph of p’ (and p, if you are going to also plot the total stress path) as the abscissa and q as the ordinate. Plot the initial values of (p’o, qo) and (po, qo).
- Determine the increase in stresses ∆σ1, ∆σ2, and ∆σ3. These stresses can be negative.
- Calculate the increase in stress invariants ∆p’, ∆p, and ∆q. These stress invariants can be negative.
- Calculate the current stress invariants as p’ = p’o + ∆p’ , p = po + ∆p, and q = qo + ∆q. The current value of p’ cannot be negative, but q can be negative.
- Plot the current stress invariants (p’, q) and (p, q).
- Connect the points identifying effective stresses, and do the same for total stresses.
- Repeat items 4 to 8 for the next loading condition.
- The excess porewater pressure at a desired level of deviatoric stress is the mean stress difference between the total stress path and the effective stress path. Remember that for a drained loading condition, ESP = TSP, and for an undrained condition, the ESP for a linear, elastic soil is vertical.
Sources:
Venkatramaiah, C. (2006): Geotechnical Engineering. New Age Publishers, India
Budhu M. (2010): Soil mechanics and foundations (3rd Edition). John Wiley and Sons, USA

