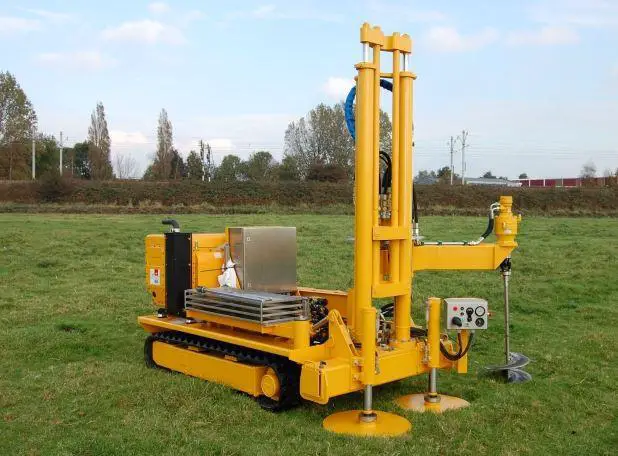
The cone penetration test (CPT), often called the Dutch cone penetration test, is a versatile sounding method for determining the materials in a soil profile and estimating their engineering properties. This test is also known as the static penetration test, and it can be performed without the use of boreholes. In the original form of the test, a 60° cone with a 10 cm2 base area is pushed into the ground at a steady rate of around 20 mm/sec, and the resistance to penetration (called the point resistance) was measured.
The test’s results from cone penetration test can also be used to determine the soil’s bearing capacity at various depths below ground level. This test can also be used to determine the skin friction values that are used to establish the needed pile lengths in a given condition, in addition to bearing capacity values.
The current cone penetrometers used in the field of geotechnical engineering measure;
(a) the cone resistance to penetration, qc, which is equal to the vertical force applied to the cone divided by its horizontally projected area; and
(b) the frictional resistance, fc, which is measured by a sleeve located above the cone with the local soil surrounding it. The frictional resistance is calculated by dividing the vertical force applied to the sleeve by the surface area of the sleeve—in other words, the sum of friction and adhesion.
(c) Pore water pressure
To measure qc and fc, two types of penetrometers are commonly used:
(a) Mechanical friction-cone penetrometer
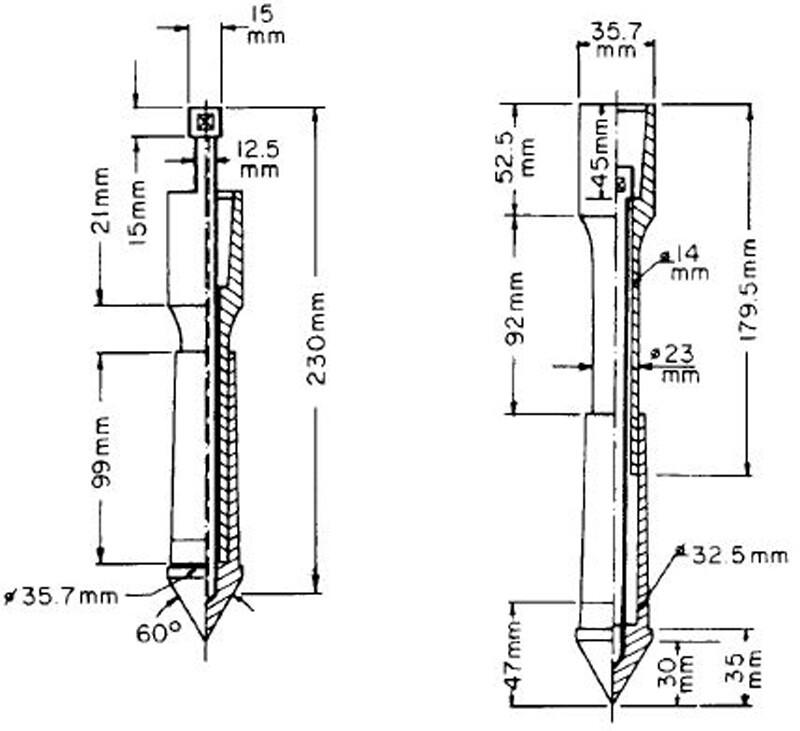
The penetrometer tip is attached to an inner set of rods in this case as shown in Figure 1. The tip is advanced into the soil to a depth of about 40 mm at first, providing cone resistance. The tip engages the friction sleeve with more thrusting. The rod force is the sum of the vertical forces on the cone and sleeve as the inner rod advances. The side resistance is calculated by subtracting the force on the cone.
(b) Electric friction-cone penetrometer
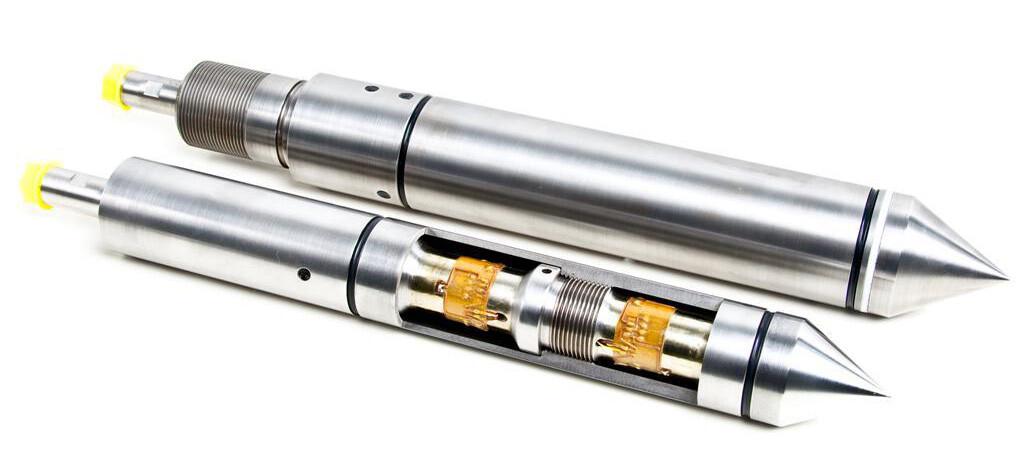
The tip is fastened to a string of steel rods in this case as shown in Figure 2. At a rate of 20 mm/sec, the tip is pushed into the soil. Wires from the transducers are threaded through the center of the rods and continuously give the cone and side resistances.
The static cone penetration test works best in soft or loose soils like silty sands, loose sands, layered deposits of sands, silts, and clays, as well as clayey deposits. Static cone penetration tests can be used to avoid the usage of test piles and loading tests in regions where some knowledge about the foundation strata is already available.
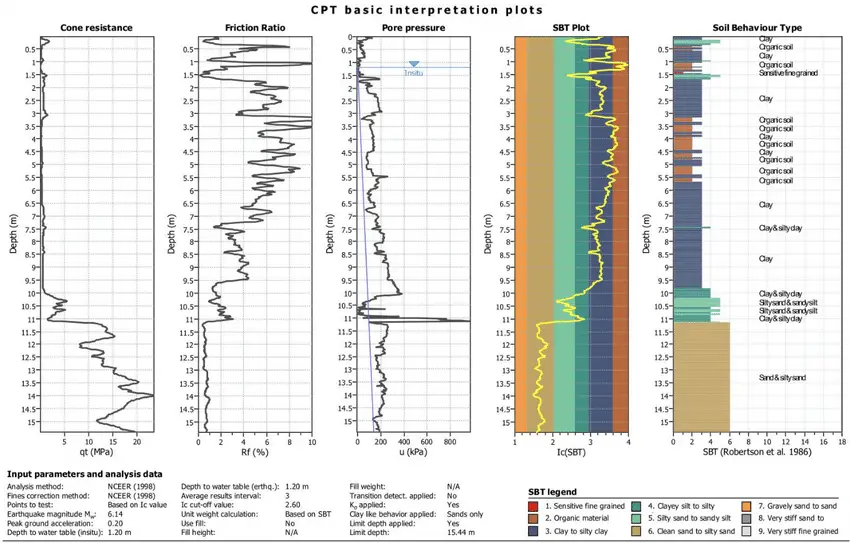
The results from a typical static cone penetration test are given in Figure 3;
For the cone resistance, qc, and the friction ratio, Fr, obtained from cone penetration tests, several correlations have been developed that are useful in evaluating the properties of soils encountered during an exploratory program. Fr stands for friction ratio and is defined as;
Fr = frictional resistance/cone resistance = fc/qc
In a more recent study on several soils in Greece, Anagnostopoulos et al. (2003) expressed Fr as;
Fr(%) = 1.45 – 1.36 logD50 (electric cone)
and
Fr(%) = 0.7811 – 1.611 logD50 (mechanical cone)
where D50 is size through which 50% of soil will pass through (mm). The D50 for soils on which the equations are based have been developed ranged from 0.001 mm to about 10 mm.
Soil classification based on friction ratio Fr was proposed by Sanglerat, (1972) and shown in the Table below;
| Fr (%) | Soil classification |
| 0 – 0.5 | Loose gravel fill |
| 0.5 – 2.0 | Sands or gravels |
| 2 – 5 | Clay sand mixtures and silts |
| > 5 | Clays, peats etc. |
Correlation of Cone Penetration Test Result with Engineering Properties of Soil
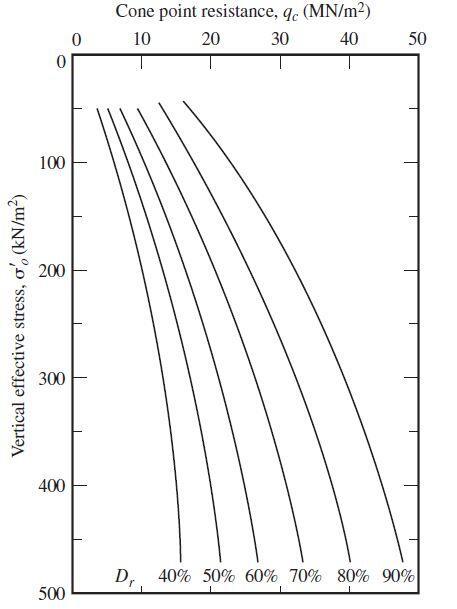
The relative density of normally consolidated sand, Dr, and qc can be correlated according to the formula;
Dr (%) = 68[log(qc/√Poσ’o) – 1]
where;
Po = atmospheric pressure
σ’o = vertical effective stress
The variation of Dr, σ’o, qc for normally consolidated quartz sand is shown in Figure 4;
Correlation between qc and Drained Friction Angle (ϕ’) for Sand
On the basis of experimental results, Robertson and Campanella (1983) suggested the variation of qc, ϕ’, and σ’o for normally consolidated quartz sand. This relationship was expressed in (Kulhawy and Mayne, 1990);
ϕ’ = tan-1[0.1 + 0.38 log(qc/σ’o)]
Based on the cone penetration tests on the soils in the Venice Lagoon (Italy), Ricceri et al. (2002) proposed a similar relationship for soil with classifications of ML and SP-SM as;
ϕ’ = tan-1[0.38 + 0.27 log(qc/σ’o)]
In a more recent study, Lee et al. (2004) developed a correlation between ϕ’, qc, and the horizontal effective stress (σ’h) in the form;
ϕ’ = 15.575(qc/σ’h)0.1714
Correlation between qc and Undrained Shear Strength (Cu) for Clays
The undrained shear strength, cu, can be expressed as;
cu = (qc – σ’o)/NK
where
σ’o = total vertical stress
NK = bearing capacity factor
The bearing capacity factor, NK, may vary from 11 to 19 for normally consolidated clays and may approach 25 for overconsolidated clay. According to Mayne and Kemper (1988);
NK = 15 (for electric cone)
and
NK = 20 (for mechanical cone)
Based on tests in Greece, Anagnostopoulos et al. (2003) determined;
NK = 17.2 (for electric cone)
and
NK = 18.9 (for mechanical cone)
These field tests also showed that;
cu = fc/1.26 (for mechanical cones) and
cu = fc (for electrical cones)
Correlation between qc and Ultimate Bearing Capacity
To estimate the allowable bearing capacity from cone penetration tests, a set of empirical equations developed by Schmertmann (1978) and listed below are used;
For cohesionless soils:
Strip footing: qult = 28 – 0.0052 (300 – qc)1.5 (kg/cm2)
Square footing: qult = 48 – 0.009 (300 – qc)1.5 (kg/cm2)
For clay:
Strip footing: qult = 2 + 0.28qc (kg/cm2)
Square footing: qult = 5 + 0.34qc (kg/cm2)
where:
qult = ultimate bearing capacity
qc = cone friction averaged over the depth interval from about B/2 to 1.1B below the footing base with B is the foundation’s width.
References
[1] Anagnostopoulos, A., Koukis, G., Sabatakakis, N. et al. (2003): Empirical correlations of soil parameters based on Cone Penetration Tests (CPT) for Greek soils. Geotechnical and Geological Engineering 21, 377–387 (2003). https://doi.org/10.1023/B:GEGE.0000006064.47819.1a
[2] Cavallaro, A.; Capilleri, P.P.; Grasso, S. (2018): Site Characterization by Dynamic In Situ and Laboratory Tests for Liquefaction Potential Evaluation during Emilia Romagna Earthquake. Geosciences 2018, 8, 242. https://doi.org/10.3390/geosciences8070242
[3] Kulhawy, F. H., and Mayne, P. W. (1990). Manual on Estimating Soil Properties for Foundation Design, Electric Power Research Institute, Palo Alto, CA.
[4] Lee, J., Salgado, R., and Carraro, A. H. (2004). “Stiffness Degradation and Shear Strength of Silty Sand,” Canadian Geotechnical Journal, Vol. 41, No. 5, 831–843.
[5] Mayne, P. W., and Kemper J. B. (1988). “Profiling OCR in Stiff Clays by CPT and SPT,” Geotechnical Testing Journal, ASTM, Vol. 11, No. 2, 139–147.
[6] Murthy, V.N.S. (2002). Principles and Practices of Soil Mechanics and Foundation Engineering. CRC Press, Florida
[7] Ricceri, G., Simonin, P., and Cola, S. (2002). “Applicability of Piezocone and Dilatometer to Characterize the Soils of the Venice Lagoon” Geotechnical and Geological Engineering, Vol. 20, No. 2, 89–121.
[8] Robertson, P. K., and Campanella, R. G. (1983). “Interpretation of Cone Penetration Tests. Part I: Sand,” Canadian Geotechnical Journal, Vol. 20, No. 4, 718–733.
[9] Sanglerat, G. (1972). The Penetrometer and Soil Exploration. Elsevier Publishing Co., Amsterdam
[10] Schmertmann, J.H. (1978). Guidelines for Cone Penetration Test: Performance and Design. U.S. Dept. of Transportation, Washington, D.C.





Hello there,
First of i would like to greet you and appreciate you for this information , I’m young Geotechnical engineer from Rwanda laboratory technician at university of Rwanda College of Science and technology school of engineering department Civil, environmental and geomatics engineering please can you share with me the pdf document, I would like to learn more about cpt ,about how we can predict settlement from CPT data.
Best regards