Liquefaction refers to the process in which a granular material changes from a solid to a liquid state due to increased pore-water pressure and decreased effective stress. This phenomenon occurs during ground shaking when loose or medium-compact granular soils experience pore space shrinkage, causing the pore water to be squeezed and leading to loss of bearing capacity.
If the pore water cannot easily drain, it leads to a significant increase in pore-water pressure (u) and a reduction in effective stress (𝜎′). The effective stress (𝜎′) is related to the total stress (𝜎) by the equation;
𝜎′ = 𝜎 − u —— (1)
When the effective stress drops below a certain value, the soil loses contact between grains and starts behaving like a liquid. This is very dangerous for structures supported on such soils.

In effect, when loose or medium-compact granular soils experience ground shaking, the pore spaces shrink and squeeze the pore water. If the pore water cannot easily drain, the pore-water pressure significantly increases, leading to a reduction in effective stress. When the effective stress drops to a certain value, the soil loses its grain-to-grain contact and behaves like a liquid.

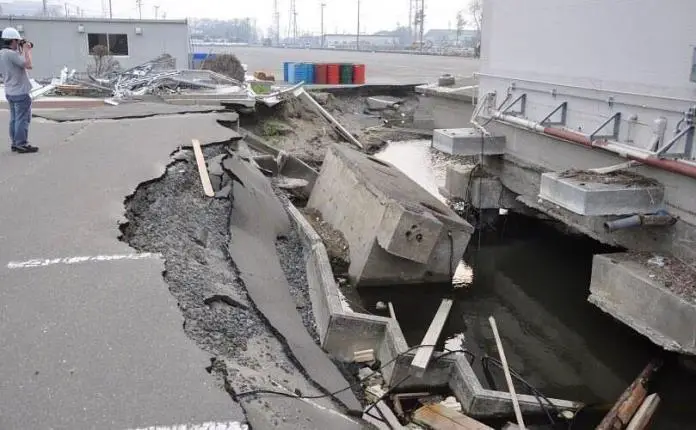
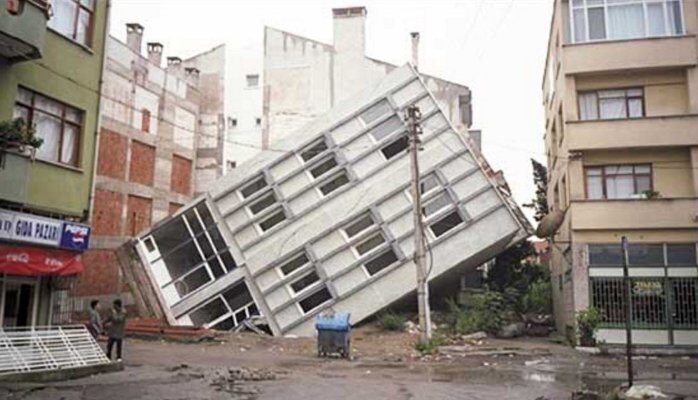
Liquefaction can have severe consequences for structures and the surrounding environment. It can result in reduced bearing capacity, causing buildings and infrastructure to sink or collapse. Lateral spreads of liquefied soils can cause large settlements and horizontal displacements. These effects can lead to significant damage and pose risks to human safety.
Figure 2 illustrates the mechanism of liquefaction, which can result in reduced bearing capacity, significant settlement, and horizontal displacement due to lateral spreads of liquefied soils. This can manifest as sand boils or lateral spread of surface soils.
Liquefaction has been observed in various earthquakes, including the 1964 Niigata, 1964 Alaska, 1971 San Fernando, 1985 Mexico City, 1994 Northridge, 1994 Kobe, 1999 Taiwan, 1999 Turkey, 2010 Baja California, 2011 Tōhoku, and 2018 Palu Sulawesi Indonesia earthquakes.
Certain conditions must be met for liquefaction to occur:
- The soil deposit consists of sandy or silty soil.
- The soil is saturated or nearly saturated (usually below the groundwater table).
- The soil is loose or moderately compacted.
- The soil is subjected to seismic action (e.g., from an earthquake).
Soils that are relatively well-drained, such as well or poorly graded gravels (GW, GP), are less susceptible to liquefaction compared to sand or silty sand (SW, SP, or SM). Denser granular soils are less prone to liquefaction than loose soils. Liquefaction is less likely to occur in granular soils under higher initial confining effective stress (e.g., deeper soils). Based on case histories, liquefaction typically occurs within a depth of 15 meters.
Cohesive soils generally do not experience liquefaction. To qualitatively evaluate cohesive soils, the Chinese criteria defined by Seed and Idriss (1982) can be used. Liquefaction in cohesive soils can only occur if all three of the following conditions are met:
- The clay content (particles smaller than 75μm) is less than 15% by weight.
- The liquid limit is less than 35%.
- The natural moisture content is greater than 0.9 times the liquid limit.
Screening investigations should also consider the possibility of a locally perched groundwater table, which may occur due to changes in local or regional water management practices, leading to a significant rise in the groundwater table.
Assessment of Liquefaction Hazard
Liquefaction hazard assessments are commonly conducted by employing a factor of safety (Equation 2). This factor represents the relationship between the available resistance to liquefaction, measured in terms of the cyclic stresses required to induce liquefaction, and the cyclic stresses generated by the design earthquake.
Both of these stress parameters, the resistance and the generated stresses, are typically normalized with respect to the effective overburden stress at the specific depth under consideration. They are known as the cyclic resistance ratio (CRR) and cyclic stress ratio (CSR) respectively.
FS = CRR/CSR —— (2)
The recommended guidelines provide guidance on selecting an appropriate factor of safety. For instance, the National Earthquake Hazards Reduction Program (NEHRP) Recommended Provisions for Seismic Regulations for New Buildings and Other Structures (2004) suggest that a factor of safety ranging from 1.2 to 1.5 is generally suitable for building sites. The actual value chosen depends on factors such as the significance of the structure and the potential for ground displacement.
Other authorities also provide recommendations on acceptable levels of risk. The California Geological Survey (1997) proposes that a factor of safety greater than 1.3 can be considered an acceptable level of risk. The DOD Handbook on Soil Dynamics and Special Design Aspects (1997) specifies that a factor of safety of 1.2 is appropriate for engineering design. Empirical methods are commonly used in practice to calculate the factor of safety and are widely adopted.
Evaluation of CSR
Seed and Idriss (1971) presented the following equation for the calculation of the cyclic stress ratio (CSR), and this equation is still the most widely used empirical method:
CSR = 𝜏av/𝜎′vo = 0.65 (amax/g)⋅(𝜎vo/𝜎′vo)⋅rd —— (3)
where:
𝜏av = average cyclic shear stress induced by design ground motion,
𝜎′vo = initial vertical effective stress at the depth under consideration in static condition,
𝜎vo = initial vertical total stress at the depth under consideration in static condition,
amax = peak horizontal acceleration at the ground surface generated by the earthquake,
rd = stress reduction coefficient.
The NCEER workshop (1997) recommended the following equations by Liao and Whitman (1986a) for routine practice and noncritical projects:
rd = 1.0 − 0.00765z (for z ≤ 9.15m) ——-(4a)
rd = 1.174 − 0.0267z (for 9.15m < z ≤ 23m) ——-(4b)
The NCEER workshop (1997) cautioned users that there is considerable variability in rd, and the rd calculated from Equation (4) is the mean of a wide range of possible rd, and the range of rd increases with depth.
Evaluation of CRR
The standard penetration test (SPT), the cone penetration test (CPT), shear wave velocity measurements, and the Becker penetration test (BPT) are the four field tests that are typically utilized by empirical methods for the evaluation of the CRR.
The SPT and CPT methods are often favoured because of the more extensive database and previous experience, although the other tests may be done at sites underlain by gravelly sediment or where access to large equipment is limited. This preference is due to the fact that the SPT and CPT methods have been around longer.
SPT Method of CRR Assessment
The CRR is graphically determined from the SPT blow count as shown in Figure 4. This CRR curve – the SPT clean-sand base curve – is for fines content ≤ 5% under magnitude 7.5 earthquakes. The SPT blow count is first corrected to consider overburden stress, equipment used to conduct the SPT, and the fines content (>5%); then Figure 4 is used to derive the CRR, which in turn is corrected for other earthquake magnitudes.

Step 1: Corrections to overburden stress and various SPT equipment
To account for the effect of overburden stress and various equipment used for SPT, the following equation is used:
(N1)60 = NmCNCECBCRCS ——– (5)
Nm = measured standard penetration blow count,
CN = correction factor based on the effective overburden stress, 𝜎′vo,
CE = correction for SPT hammer energy ratio (ER)
CB = correction factor for borehole diameter,
CR = correction factor for SPT rod length,
CS = correction factor for samplers with or without liners.
Step 2: Corrections to fines content
The corrected (N1)60 in Equation (5) is further corrected for the fines content (FC) in the soil.
(N1)60CS = 𝛼 + 𝛽(N1)60 ——– (6)
where:
(N1)60CS = the (N1)60 for equivalent clean sand; (N1)60CS is used in Figure 4 to find the CRR under magnitude 7.5 earthquakes,
(N1)60 = corrected SPT blow count calculated in Equation (5),
𝛼 and 𝛽 = coefficients determined from the following relationships:
𝛼 = 0 for FC ≤ 5%
𝛼 = exp[1.76 − (190∕FC2)] for 5% < FC < 35%
𝛼 = 5.0 for FC ≥ 35%
𝛽 = 1.0 for FC≤ 5%
𝛽 = [0.99 + (FC1.5∕1000)] for 5% < FC < 35%
𝛽 = 1.2 for FC ≥ 35%
Step 3: Magnitude scaling factors (MSFs)
A magnitude scaling factor (MSF) is used to correct the factor of safety (FS) when the earthquake magnitude is not 7.5:
FS =(CRR7.5/CSR)⋅ MSF ——- (7)
where:
CRR7.5 = the cyclic resistance ratio for a magnitude 7.5 earthquake.
The NCEER workshop (1997) summarized the MSFs proposed by various investigators (Figure 5).

Solved Example
Liquefaction Analysis Using SPT Method (After Xiao, 2015)
It is proposed to build a new bridge across a river. The construction site contains poorly graded sandy soil with fines content (passing #200 sieve) of 18%. The soil deposit of the riverbed is fully saturated with 𝛾sat =19.5 kN/m3. The nearby Foot Hill fault system could generate a peak (horizontal) ground acceleration, amax, of 0.25 g at this construction site. Caissons are used as the bridge foundation.
The bottom of the caissons is at a depth of 5m below the riverbed. SPT were performed in a 10.2-cm (4-inch) diameter borehole using a safety trip hammer with a blow count of 6 for the first 15 cm (6 inches), 7 blows for the second 15cm (6 inches), and 9 blows for the third 15cm (6 inches) of driving penetration.
During the design earthquake of magnitude 6.0, will the saturated sand located at the bottom of the caisson liquefy?
Solution:
(1) Calculate CSR:
CSR = 𝜏av/𝜎′vo = 0.65 (amax/g)⋅(𝜎vo/𝜎′vo)⋅rd
where:
Total overburden stress: 𝜎vo = 19.5 × 5 = 97.5 kN/m2
Effective overburden stress: 𝜎′vo = 97.5 − 9.81 × 5 = 48.5 kN/m2
Peak horizontal acceleration: amax = 0.25 g
As z = 5m ≤ 9.15m,
Stress reduction resistance: rd = 1.0 − 0.00765 × 5 = 0.965
So: CSR = 0.65 × 0.25g/g × 97.5/48.5 × 0.965 = 0.304
(2) Calculate CRR using the SPT method:
First, calculate the corrected SPT blow count:
(N1)60 = NmCNCECBCRCS
Nm is the measured SPT blow count, which is the total blow count of the second and third six-inch penetrations.
So Nm = 7 + 9 = 16.
The correction factor on the basis of effective stress (note: Pa = 1 atm = 101.3 kN/m2):
CN = 2.2/(1.2 + 𝜎′vo/pa) = 2.2/(1.2 + 48.5/101.3) = 1.31
Given the automatic trip hammer, the borehole diameter of 102 mm (4 inch), and the rod length of 5m (15 ft),
the correction factor for SPT hammer energy ratio CE =1.0,
the correction factor for borehole diameter CB =1.0,
the correction factor for SPT rod length CR = 0.85, and
the correction factor for samplers with liner CS =1.0.
So ∶ (N1)60 = 16 × 1.31 × 1.0 × 1.0 × 0.85 × 1.0 ≈ 18
Then calculate the equivalent clean-sand SPT blow count (N1)60:
(N1)60CS = 𝛼 + 𝛽(N1)60
As fines content (FC) = 18%,
𝛼 = exp[1.76 − (190∕FC2)] = exp [1.76 − (190∕182)] = 3.234
𝛽 = [0.99 + (FC1.5∕1000)] = [0.99 + (181.5∕1000)] = 1.066
(N1)60cs = 3.234 + 1.066 × 18 = 23
From Figure 4, find CRR7.5 = 0.26.
(3) Calculate MSF:
From Figure 5, at M = 6.0, MSF is between 1.76 and 2.1. On the basis of the critical nature of the project (the foundation of a bridge), the MSF is chosen as the lower bound, 1.76.
(4) Factor of safety against liquefaction:
FS = (CRR7.5/CSR) × MSF = (0.26/0.304) × 1.76 = 1.5 > 1.3
Conclusion: The SPT analysis concludes that the site will not liquefy under the design earthquake.
References:
Xiao M. (2015): Geotechnical Engineering Design (1st Edition). ISBN: 9780470632239 John Wiley & Sons, UK.

