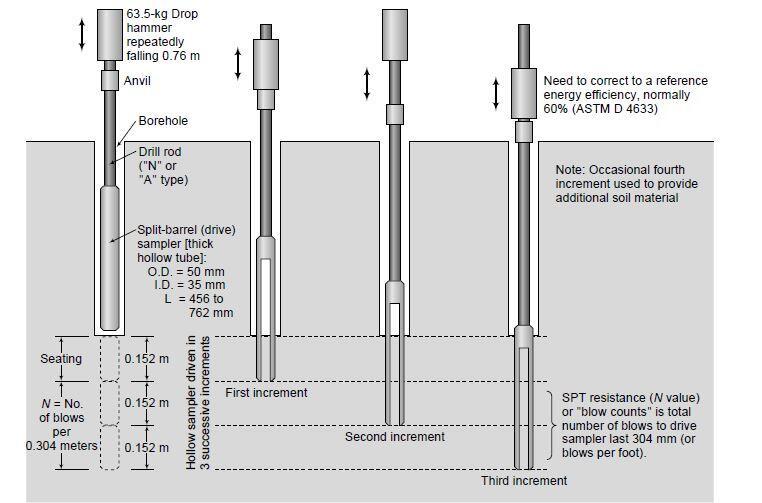
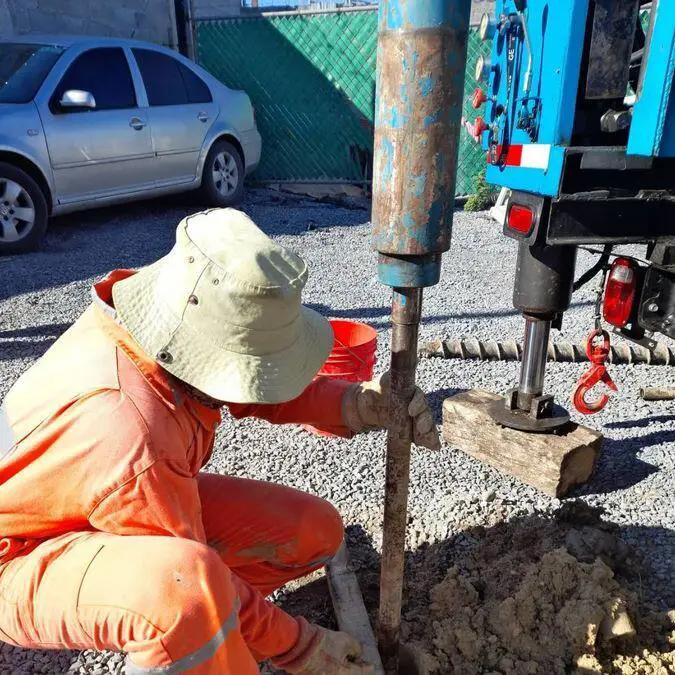
The standard penetration test (SPT) is made in boreholes by means of the standard 50.8 mm outside and 33.8 mm inside diameter split spoon sampler. It is a very useful method for estimating the in-situ density of cohesionless soils, and when modified by a cone end, it can also be used to assess the relative strength or deformability of rocks.
An automatic trip device triggers repeated strikes from a 63.5 kg weight falling freely through 760 mm, driving the sampler to a penetration of 450 mm.The only blows counted as part of the conventional penetration number are those for the final 300 mm of driving (N-value). For the entire 450 mm of drive, it is standard practice to count the blows for every 75 mm of penetration.
By doing so, it is possible to determine the depth of any disturbed soil in the borehole’s bottom and the height at which any obstacles to driving, such as cobblestones, huge gravel, or cemented layers, are encountered. In the test, typically no more than 50 blows are made (including the number of blows necessary to position the sampler below the disturbed zone).
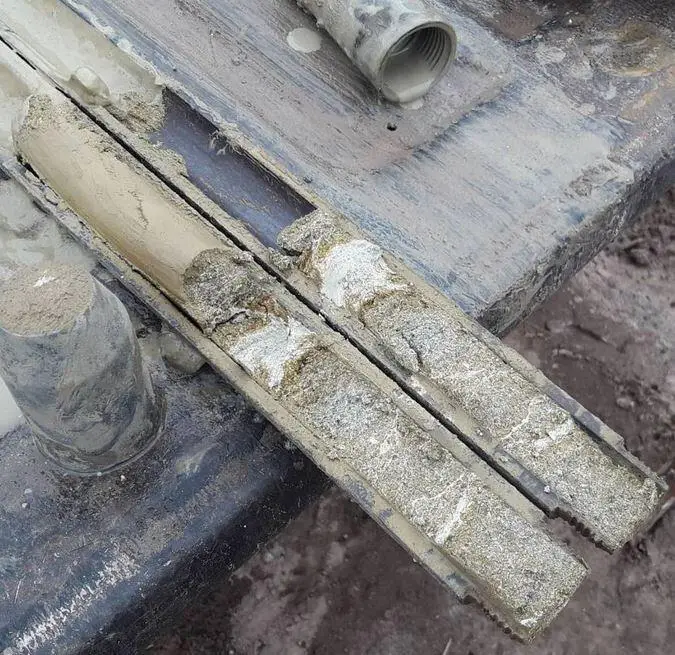
Both the depth at the start of the test and the depth at which it is concluded must be given in the borehole record if the full 300mm penetration below the initial seating drive is not achieved, i.e., when 50 blows are made before full penetration is achieved. Appropriate symbols must be used to indicate whether the test was completed within or below the initial seating drive. The tube is disassembled for analysis of the soil samples after removal from the borehole (see Figure 3).
In gravelly soil and rocks the open-ended sampler is replaced by a cone end. Investigations have shown a general similarity in N-values for the two types in soils of the same density.
The standard penetration test was first developed in the USA as a simple tool to determine the density of soils. The test was adopted by various nations throughout the world, and numerous relationships between the test results and soil characteristics and analytical methods were developed.
According to published data, test methodologies vary greatly across different countries. Non-standard types of hammers and samplers were being utilised, and there were several ways to manage the hammer drop, including free-fall or rope and pulley arrangement.
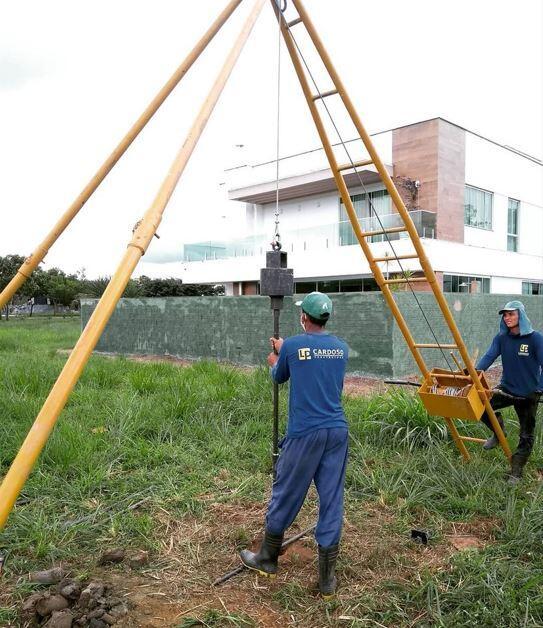
The two most common types of SPT hammers used in the field are the safety hammer and donut hammer. They are commonly dropped by a rope with two wraps around a pulley (see Figure 2).
Correction Factors to SPT Test
There are several factors that will contribute to the variation of the standard penetration number, N, at a given depth for similar soil profiles. These factors include SPT hammer efficiency, borehole diameter, sampling method, and rod length factor.
It therefore became evident that if the test data were to be used for correlation with different soil parameters, as will be explained below, corrections to N-values produced by non-standard techniques would be required. The following is a summary of the correction factors that should be applied to the measured blow-count.
The primary correction is focused on the energy that the drill rods and hammer send to the sampler. This has been normalised using a 60% of the theoretical maximum energy ratio (ERM). The term N stands for the measured blow-count , while N60 stands for the hammer energy correction. A further correction is applied to allow for the energy delivered by the drill rods. The N60 value is corrected to N by multiplying N’60 by 0.75 for rod lengths of 3 m or shorter. The correction factor is unity for lengths greater than 10 m. No correction for sampler size or weight is necessary if a British Standard or ASTM standard sampler is used.
Thus;
N60 = N(ERm/60) = NCE ——– (1)
where ERm is the energy ratio and CE is the 60% rod energy ratio correction factor. Correction factors for rod lengths, sampler type, borehole diameter, and equipment (60% rod energy ratio correction) are given in Tables 1 – 4.
In the field, the magnitude of ERM can vary from 30 to 90%. The standard practice now in the U.S. is to express the N-value to an average energy ratio of 60% (≈ N60). Thus, correcting for field procedures and on the basis of field observations, it appears reasonable to standardize the field penetration number as a function of the input driving energy and its dissipation around the sampler into the surrounding soil, or;
N60 = NCHCBCSCR/60 ——– (2)
where N60 = standard penetration number corrected for field conditions
N = measured penetration number
CH = hammer efficiency (%)
CB = correction for borehole diameter
CS = sampler correction
CR = correction for rod length
| Country | Hammer Type | Hammer Release | CH (%) |
| Japan | Donut Donut | Free Fall Rope and pulley | 78 67 |
| USA | Safety Donut | Rope and pulley Rope and pulley | 60 45 |
| Argentina | Donut | Rope and pulley | 45 |
| China | Donut | Free fall Rope and pulley | 60 50 |
| Diameter (mm) | Diameter (inches) | CB |
| 60 – 120 | 2.4 – 4.7 | 1.0 |
| 150 | 6 | 1.05 |
| 200 | 8 | 1.15 |
| Variable | CS |
| Standard sampler | 1.00 |
| With liner for dense sand and clay | 0.80 |
| With liner for loose sand | 0.90 |
| Rod length (m) | CR |
| > 10 | 1.0 |
| 6 – 10 | 0.95 |
| 4 – 6 | 0.85 |
| 0 – 4 | 0.75 |
Worked Example on SPT Number Calculation
The blow counts for an SPT test at a depth of 6 m in a coarse-grained soil at every 150mm are 9, 16, and 19. A donut automatic trip hammer and a standard sampler were used in a borehole 152 mm in diameter.
(a) Determine the N value.
(b) Correct the N value for rod length, sampler type, borehole size, and energy ratio to 60%.
(c) Make a preliminary description of the compactness of the soil.
Strategy:
The N value is the sum of the blow counts for the last 0.304 m of penetration. Just add the last two blow counts.
Solution
Step 1: Add the last two blow counts.
N = 16 + 19 = 35
Step 2: Apply correction factors.
From the Tables above;
CH = 60%
CB = 1.05
CS = 1.00
CR = 0.95
N60 = NCHCBCSCR/60 = (35 × 60 × 1.05 × 1.00 × 0.95)/60 = 34
Step 3: Use Table 5 to describe the compactness.
For N = 34, the soil is dense.
Correlations Using SPT
Although the applications of SPT results are entirely empirical, their extensive use has allowed for the accumulation of vast knowledge regarding the behaviour of foundations in sands and gravels. Relationships between N-values and properties like density and shearing resistance angle have been identified.
BS 5930 gives the following relationship between the SPT N-values and the relative density of a sand as shown in Table 5;
| N’60 (blows/300 mm of penetration) | Relative Density | Dr (10%) |
| Below 4 | Very loose | < 20 |
| 4 – 10 | Loose | 20 – 40 |
| 10 – 30 | Medium – Dense | 40 – 60 |
| 30 – 50 | Dense | 60 – 80 |
| Over 50 | Very dense | > 80 |
Some correlations of the SPT with soil characteristics, in particular the susceptibility of a soil to liquefaction under earthquake conditions, require a further correction to N’60 to allow for the effective overburden pressure at the level of the test. In granular soils, the standard penetration number is highly dependent on the effective overburden pressure.
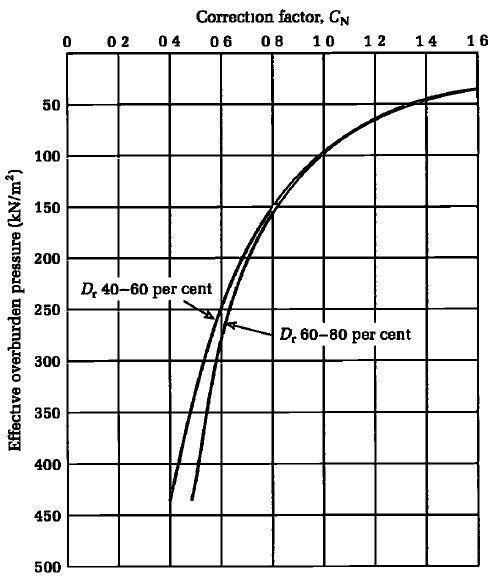
A number of empirical relationships have been proposed to convert the field standard penetration number N60 to a standard effective overburden pressure σ0‘, of 96 kN/m2 (2000 lb/ft2). The general form for standard sampler is;
N’60 = CNN60 ——– (3)
Several correlations have been developed over the years for the correction factor, CN. In standard geotechnical engineering textbooks, two of these given in Equations (4) and (5) are recommended for use (SI Units);
CN = 9.78√(1/σ0‘) ——– (4)
or
CN = 2/(1 + 0.01σ0‘) ——– (5)
Values of CN derived by Seed et al (1984) are shown in the Figure below;
Correlation of SPT with Cohesive Soils (Clays)
The consistency and unconfined compressive strength (qu) of clay soils can be estimated from the standard penetration number N60. It is important to point out that the correlation between N60 and unconfined compressive strength is very approximate. The sensitivity, St, of clay soil also plays an important role in the actual N60 value obtained in the field. In any case, for clays of a given geology, a reasonable correlation between N60 and qu can be obtained as shown in Equation (6).
qu/Pa = 0.58N600.72 ——– (6)
Where Pa is the atmospheric pressure (in the same unit with qu).
| Standard Penetration Number N60 | Consistency | Consistency Index | Unconfined Compressive Strength kN/m2 (lb/ft2) |
| < 2 | Very soft | < 0.5 | < 25 (500) |
| 2 – 8 | Soft to medium | 0.5 – 0.75 | 25 – 80 (500 – 1700) |
| 8 – 15 | Stiff | 0.75 – 1.0 | 80 – 150 (1700 – 3100) |
| 15 – 30 | Very Stiff | 1.0 – 1.5 | 150 – 400 (3100 – 8400) |
| > 30 | Hard | > 1.5 | > 400 (8400) |
Stroud (1975) has established relationships between the N-value, undrained shear strength, modulus of volume compressibility, and plasticity index of clays as shown in Figure 6.
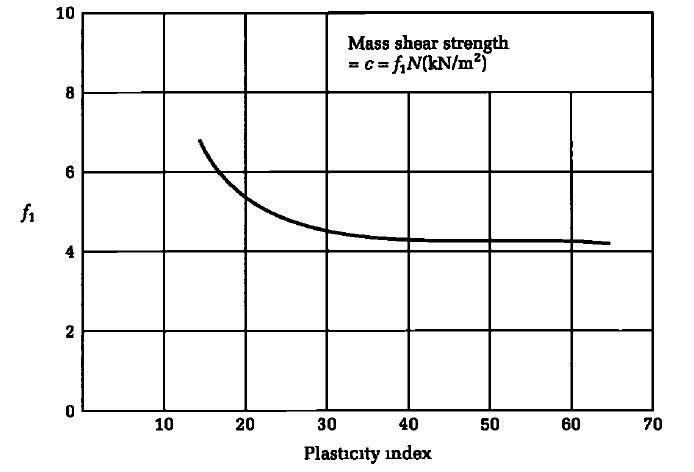
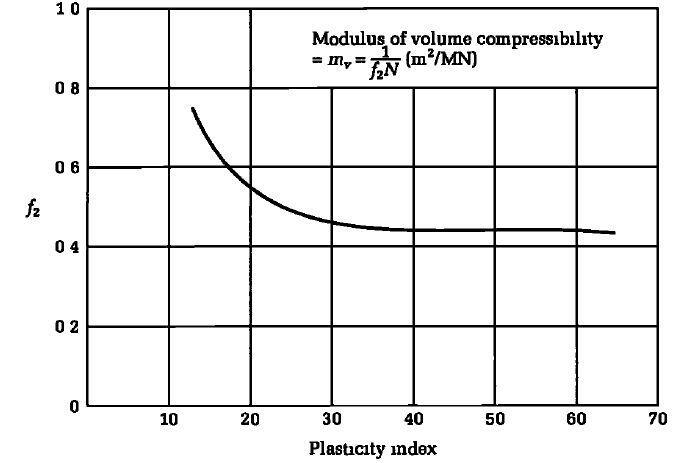
It is not advised to use the SPT in place of the direct approach of conducting laboratory tests on undisturbed samples to determine the shear strength and compressibility of clay soils. This is due to the fact that the correlations between the SPT and the strength and deformability of clays have only been established empirically, with no consideration of time effects, anisotropy, or the composition of the soil.
Correlation of SPT with Cohesionless Soils (Sands)
The drained angle of friction of granular soils, ϕ’, also has been correlated to the standard penetration number. Peck, Hanson, and Thornburn (1974) gave a correlation between (N1)60 and ϕ’ in a graphical form, which can be approximated as;
ϕ'(degrees) = 27.1 + 0.3(N1)60 – 0.00054(N1)602 ——– (8)
Schmertmann (1975) also provided a correlation for N60 versus σ0‘. After Kulhawy and Mayne (1990), this correlation can be approximated as;

Where Pa is the atmospheric pressure in the same unit as σ0‘.
Terzaghi and Peck also give the following correlation between SPT value, Dr, and φ as shown in Table 7.
| Condition | N | Dr (%) | ϕ’ |
| Very loose | 0 – 4 | 0 – 15 | < 28° |
| Loose | 4 – 10 | 15 – 35 | 28° – 30° |
| Medium | 10 – 30 | 35 – 65 | 30° – 36° |
| Dense | 30 – 50 | 65 – 85 | 36° – 42° |
| Very dense | > 50 | > 85 | > 42° |
Conclusion
The SPT can be completed quickly and easily. The equipment can penetrate dense materials and is widely available The engineering characteristics of soils such as bearing capacity and foundation settlement have all been linked to SPT results. However, the majority of these correlations are marginal.
Errors can come from a variety of sources, such as test performance and the use of non-standard equipment. The incorrect lifting and dropping of the hammer, inadequate borehole cleaning prior to the test, and failure to maintain the groundwater level, if one exists, are examples of test performance errors. These mistakes result in N values that are not typical of the soil. For coarse gravel, boulders, soft clays, silts, and mixed soils containing boulders, cobbles, clays, and silts, SPT tests are unreliable.

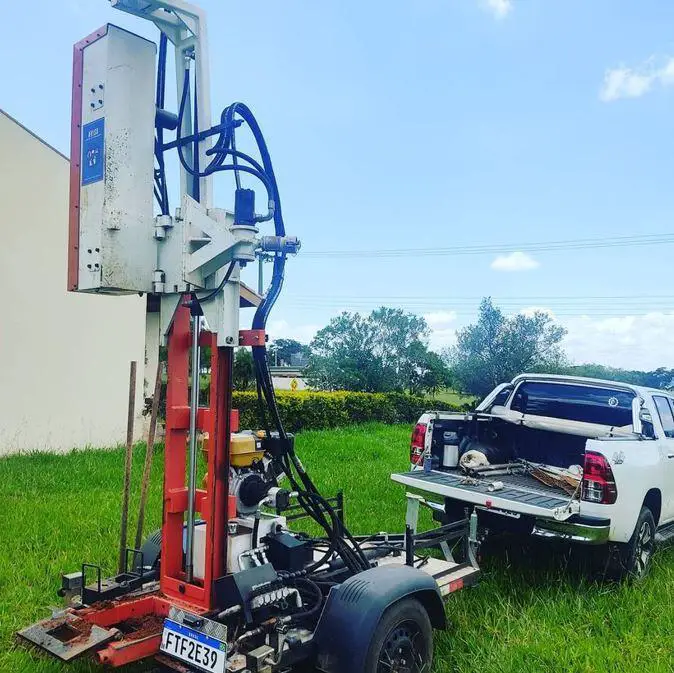





Interesting small size equipment.
Where is it manufactured? How much is the cost? Which countries are using it?