It is common practise to test bridges with lengthy or unusually flexible decks in wind tunnels. In order to fully comprehend the structure’s aerodynamic behaviour, wind tunnel testing may occasionally be necessary, as described in BD 49/01 (Department of Transport, 2001a). The aerodynamics and wind-induced reaction of vehicles can be impacted by the wind field on a bridge deck. Studies of wind fields on bridge decks can be used as a guide when designing a bridge to guarantee the safety of moving vehicles.
For long span bridges, the use of wind tunnel testing is imperative. The term “long span bridges” typically refers to structures with a span length of between 1000 and 1500 metres. The first natural frequencies for these bridges are of the order of 0.1 Hz or lower, and the structure possesses very high flexibility. Bridges with span lengths over 1.5 km are categorised as “extremely long span bridges,” and their natural frequencies decrease in inverse proportion of the span length.
Objectives of Wind Tunnel Testing
There are three main objectives for the use of wind tunnel testing during bridge design.
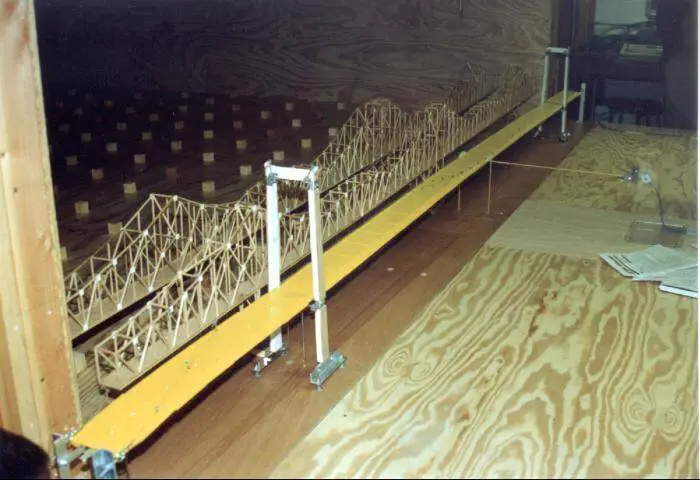
First, wind tunnel testing is utilised to estimate structure-specific drag and lift coefficients if bridge decks or piers do not conform to the conventional cross-sections specified in design regulations. The mean lateral force, mean normal force, and pitching moment near the centre of the deck are used to measure static wind loads, which are then given as static wind load coefficients. Depending on the location of the bridge site, measurements are made in both smooth and turbulent flow conditions.
The second objective is to determine whether a structure is vulnerable to vortex shedding and divergent amplitude responses. These evaluations are typically carried out under conditions of uniform flow at various test wind incidence angles.
The third objective is to examine how nearby terrain or structures affect the structure’s dynamic reaction. The main impact of such obstructions is to change the wind’s angle of action on the structure. The wind field in built-up areas is frequently extremely complicated, and it is feasible for the wind to be directed around nearby structures, increasing the mean velocity on the bridge’s under-review zones.
Modelling for Wind Tunnel Testing
For prismatic (two-dimensional) constructions like long-span bridge decks, section model investigations are carried out. To simulate the attributes of the structure, a rigid model is fixed to a dynamic test rig made of a set of springs. The dynamic response caused by phenomena like vortex shedding and the wind speeds for the development of aerodynamic instabilities like galloping and flutter are measured.
The failure of the Tacoma Narrows Bridge demonstrated the catastrophic failure that flutter can cause, which motivated engineers to carefully consider the aerodynamic analysis inside bridge design procedures.
The section model for wind tunnel testing can be made from materials such balsa wood, carbon fibre sheet, and steel sections, and it is designed to correctly replicate the prototype’s scaled mass as well as its lowest torsional and bending frequencies. Handrails, parapets, guiding vanes, maintenance gantry rails, stay pipes, and any other non-structural accessories that may have an impact on the deck’s aerodynamic behaviour should be included in sectional models.
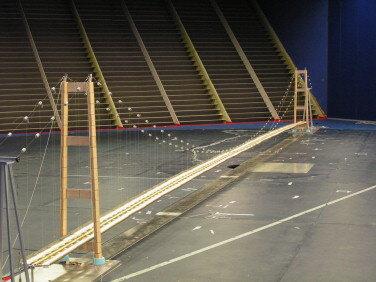
Aerodynamically comparable representations may be employed when these elements are too small to be scale-modelled. Typically, dimensions must be accurate to ±0.05 mm. The target spectral density function must be closely matched where turbulent atmospheric conditions are required.
A two-dimensional grid of vertical and horizontal strips is usually placed at the entrance of the wind tunnel test section to create turbulent conditions in low-speed aeronautical wind tunnels. It is possible to recreate the necessary turbulence conditions by adjusting the grid spacing.
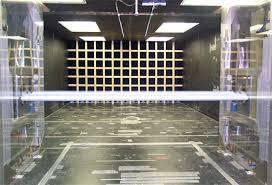
Hot-wire anemometry is used to measure the wind parameters immediately upstream of the test section’s installation, including mean wind speed, turbulence intensity, and wind spectra. These turbulence characteristics are measured at various wind speeds that reflect the anticipated experimental circumstances. The u– and w-component spectra, as well as the longitudinal and vertical turbulence intensities, are used to display the results of the turbulence simulation.
The produced by the Engineering Sciences Data Unit standards, as well as the measured and target spectra, should be compared (ESDU). Smoke visualisation can be used during tests to study the vortex-shedding reaction to see how the airflow over the structure is changing.
The model forces and moments observed in the wind tunnel are used to generate the static load coefficients in the wind axis system as follows:
Drag coefficient, CD = D/0.5ρVm2B
Lift coefficient, CL = L/0.5ρVm2B
Pitching coefficient, CM = M/0.5ρVm2B
where D, L and M are the wind axis along- and across-wind force and pitching moment. Vm is the mean wind speed, ρ is the density of air (in the UK taken as 1.225 kg/m3) and B is the reference dimension which is usually the deck width.
Force coefficients must however be adjusted to take into account blockage effects brought on by the wind tunnel’s constriction. There are several approaches for computing correction factors, hence it is advised to consult specialised literature like ESDU 80024 (ESDU, 1980) to determine which method is best for the specific blockage ratio being taken into account.
The Reynolds number (Re) is likely to be sensitive to sections with round section members or curved surfaces, therefore adjustments based on full-scale data or theoretical considerations may be required.
Analysis of Wind Tunnel Test Models
A whole bridge’s aerodynamic model is also known as an aero-elastic model. For structures with considerable wind-induced motions that have an impact on the aerodynamic forces and subsequently the dynamic response, aero-elastic tests are carried out. These structures usually behave as three dimensional structures.
By simulating the structure’s mass and stiffness distribution, models are created to replicate the essential dynamic properties. Particularly, the basic modes that control the structure’s dynamic response must be accurately modelled at the model-scale frequency. Transducers that measure displacement or acceleration are used to directly measure modal responses.
The modal responses measured are then used to calculate dynamic loads, or in the case of vertical structures, they are directly measured. The models for long-span bridges may be quite large because, typically, models for aeroelastic tests are constructed at either 1:200 or 1:100 scales.
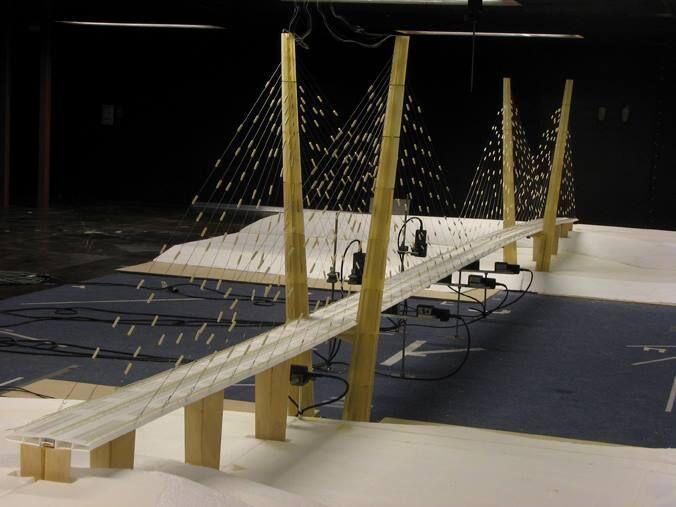
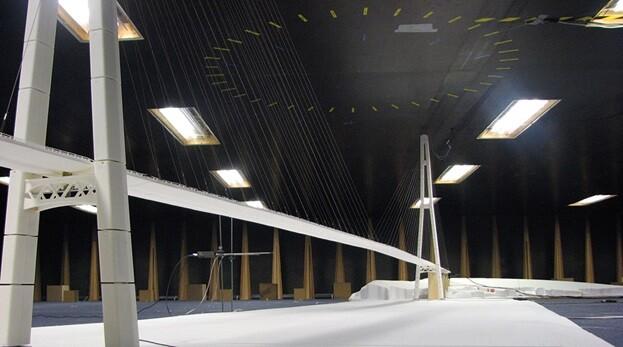
Boundary layer wind tunnels (BLWT) with wide sections are therefore necessary for the experiments. A 1:100 scale aeroelastic replica of the Japanese Akashi-Kaiko bridge was constructed, having an overall length of about 40 m. Figure 19 depicts an instance of an aeroelastic model in a BLWT.
In a BLWT, turbulent boundary conditions are produced by placing a configuration of roughness elements across the wind tunnel’s floor and placing a two-dimensional barrier with square vortex-generating posts at the test section’s entry. These elements’ size, form, and distribution are planned to produce the specific turbulence characteristic needed for the testing.
Calibration of the wind-tunnel-generated turbulence attributes should be carried out with reference to the target spectrum, just like the section model testing. At crucial locations on the structure, displacement transducers and accelerometers measure the time histories of acceleration and acceleration during the testing.
Mean, root mean square (RMS) background, and RMS resonant components are calculated from the displacement time histories. The RMS resonant components of the movement are determined using acceleration time histories. In order to provide enough coverage of the design wind speed range representative of the bridge site, time records are recorded at small wind speed increments.
The Fourier transformation is used to analyse each time history in order to identify the spectrum, allowing for the isolation of narrowband responses that are indicative of structural resonance. By removing the peaks that correspond to the resonant components of displacement, background components can be extracted from displacement spectra.
The elements of a typical measured wind spectrum are shown below. The mean displacements plus or minus a sum of the standard deviations of the background and resonant components of displacement due to each mode are then used to determine the peak displacements.
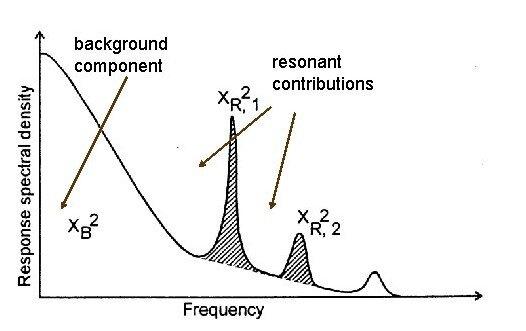
The following expression is commonly used for calculating the measured peak displacements:
Dpeak = Dmean ± √(g0Dsdev)2 + ∑(gkDmodek)2
where;
Dpeak = peak displacement
Dmean = mean displacement
Dsdev = standard deviation of background displacement
Dmode = RMS inertial displacement due to response in mode k
g0 = peak factor to apply to background standard deviation (typically 3.4 to 3.5)
gk = peak factor to apply to narrow band displacement due to motion in mode k.
The required peak factors across the modal responses are determined for the modal or narrow band displacements using the Davenport gust factor, which is given as:
gk = √[2In(fkT0) + 0.577/2In(fkT0)]
where;
fk = natural frequency of kth mode (in hertz)
T0 = storm duration (typically 3600 seconds).
Correction factors may also be required within the calculation of the peak displacements in order to account for scaling inaccuracies necessitated by virtue of the model scale, e.g. cable diameters.
Wind Tunnel Testing of Cable Stays
Similar to the static testing of deck sections, testing of stay cables in wind tunnels is done to determine the drag coefficient and check for any potential divergent instabilities. Stay cables are often tested at full scale to guarantee Reynolds number similarity between model and prototype.
The surface characteristics of the prototype, such as any helical fillets or dimple patterns, should be precisely reflected in the cable models. Using calibrated spring balances and turntables in the test section’s ceiling and floor, cable models are dynamically mounted. This makes it possible to test the cable model in a variety of wind directions and wind-inclination angles. Spray heads positioned in the tunnel ceiling in some specialised wind tunnels can imitate a variety of rain conditions, making it possible to analyse rain-induced cable vibrations.

