In the analysis of retaining walls subjected to earth pressure, it is very common to observe trapezoidal load distribution on the walls. Normally, earth pressure on a retaining wall is assumed to adopt a triangular load distribution, but due to surcharge which is usually assumed to act on the ground surface, the top of the wall experiences some degree of lateral pressure.
When the top of a retaining wall is free and the base assumed to be fixed, the retaining wall can be analysed easily using the three equations of equilibrium by modelling the wall as a cantilever. The load cases of surcharge, earth pressure, and ground water can be analysed separately, and the results added algebraically. When the wall top of a wall is propped, a statically indeterminate behaviour is assumed, and the wall can be analysed using the theory of plates and shells.
Numerous approaches such as finite difference method, finite element analysis, classical theory, etc can be adopted to solve problems of such nature. Anchor (1992) adopted a convenient approach of replacing the surcharge pressure with equivalent soil pressure. This was done by adding the maximum soil pressure and surcharge pressure algebraically, and assuming an equivalent triangular distribution. Another approach recommended by Reynolds et al (2008) is to separate the load cases, analyse them separately, and sum the results together. For walls spanning in two directions, this method is accurate for edge bending moments, but approximate for span moments.
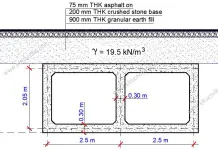
In this post, we are going to explore the behaviour of the walls of a tank subjected to earth pressure and surcharge pressure (find the section of the tank above). We are going to investigate the methods described above, and compare them with finite element analysis using Staad Pro software.
Let us consider a propped cantilever wall loaded as shown below. The pressure at the top of the wall represents the surcharge pressure at ULS, while the pressure at the bottom of the wall represents the combined pressure of surcharge and retained earth at ULS.
(1) By plate theory
We are going to analyse the walls using coefficients that can be readily obtained from charts and tables. We will separate the trapezoidal load into its triangular and rectangular components as shown below, and analyse them separately;
Using Moment Coefficient from Table
Note that these coefficients contain allowance for torsion at the edge, and are picked from Reynolds et al (2008).
Vertical Span
Maximum negative moment at base (triangular) = 0.048 × 70.599 × 4.32 = 62.658 kNm/m
Maximum negative moment at base (rectangular) = 0.073 × 5.625 × 4.32 = 7.592 kNm/m
Total Moment negative base moment = 62.658 + 7.592 = 70.250 kNm
Maximum positive moment (triangular) = 0.0185 × 70.599 × 4.32 = 24.149 kNm/m
Maximum positive moment (rectangular) = 0.055 × 5.625 × 4.32 = 5.720 kNm/m
Total approximate mid-span moment = 24.149 + 5.720 = 29.869 kNm/m
Horizontal Span
Maximum negative moment at the edge (triangular) = 0.033 × 70.599 × 4.32 = 43.077 kNm/m
Maximum negative moment at the edge (rectangular) = 0.032 × 5.625 × 6.42 = 7.3728 kNm/m
Total Moment negative edge moment = 43.077 + 7.3728 = 50.449 kNm
Maximum positive moment (triangular) = 0.011 × 70.599 × 4.32 = 14.359 kNm/m
Maximum positive moment (rectangular) = 0.024 × 5.625 × 6.42 = 5.5296 kNm/m
Total positive moment = 19.886 kNm/m
(2) By Equivalent Pressure Method
We are going to analyse the pressure load on the wall by summing up the pressure due to retained earth and surcharge and analysing them as triangular distribution.
Vertical Span
Maximum negative moment at the base base = 0.048 × 76.224 × 4.32 = 67.65 kNm/m
Maximum positive moment at the span = 0.0185 × 76.224 × 4.32 = 26.073 kNm/m
Horizontal Span
Maximum negative moment at the edge = 0.033 × 76.224 × 4.32 = 46.509 kNm/m
Maximum positive moment (triangular) = 0.011 × 76.224 × 4.32 = 15.503 kNm/m
(3) By Finite Element Analysis Using Staad Pro
When modelled and analysed on Staad Pro;
We will have to allow for torsion at the edge moments.
By using Staad Pro;
Vertical Span
Maximum negative moment at base = 58.9 kNm/m (allowing for torsion = 71.7 kNm/m)
Maximum positive moment (mid span) = 31.2 kNm/m
Horizontal Span
Maximum negative moment at edge = 40 kNm/m (allowing for torsion = 52.8 kNm/m)
Maximum positive moment = 18 kNm/m
Twisting moment = 12.8 kNm/m
Let us compare the results from the three methods investigated;
From the above table, it can be seen that the result from the use of coefficient and FEA are very close and comparable, while the result using equivalent approach is giving lower bound results. Therefore, in the absence of computer programs, I recommend the use of coefficients from Table for analysis of retaining walls subjected to trapezoidal loads.
This post is an excerpt from the book;
‘Structural Design of Swimming Pools and Underground Water Tanks‘ by Ubani Obinna. Published by Structville Integrated Services Limited (2018). ISBN 978-978-969-541-6
To obtain this publication in PDF for NGN 2,000, click HERE
For more information, send a Whatsapp message to;
+2347053638996
References
Anchor R.D. (1992): Design of Liquid Containing Structures. Published by Edward Arnolds, UK. ISBN 0-340-54527-5
Reynolds C.E., Steedman J.C., Threlfall A.J. (2008): Reynolds Reinforced Concrete Design Handbook. Spon Press, Taylor and Francis Group (11th Edition)
Ubani O.U. (2018): Structural Design of Swimming Pools and Underground Water Tanks. Structville Integrated Services Limited (2018). ISBN 978-978-969-541-6







I found you are blog via Yahoo and I’ve to say. A Gigantic Thanks very much, I considered your article was very interesting I’ll get back to see what more great information I can get here