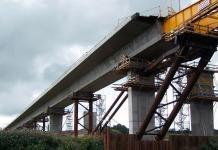
The temperature of a bridge structure and its surroundings varies daily and seasonally, affecting the overall movement of the bridge deck as well as the stresses within it. The temperature actions on bridge decks have an impact on the design of bridge bearings and expansion joints, while the overall movement of the bridge deck and the stresses within it have an impact on the quantity and placement of structural materials such as steel.
The daily effects cause temperature variations within the depth of the superstructure which vary depending on whether it is heating or cooling. Guidance is typically provided in the form of idealized linear temperature gradients to be expected when the bridge is heating or cooling for various types of construction (concrete slab, composite deck, etc.) and blacktop surface thickness.
Internal stresses in a bridge cross-section self-equilibrate as a result of temperature gradients. There are two forms of internal stresses induced as a result of this: primary and secondary. The former is caused by temperature changes across the superstructure (whether simply supported or continuous), while the latter is caused by continuity. Both must be considered and accommodated in the design.
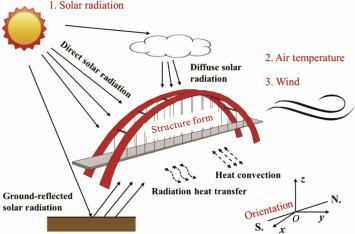
The temperature of a bridge deck varies throughout its mass. The variation is caused by:
- the position of the sun
- the intensity of the sun’s rays
- thermal conductivity of the concrete and surfacing
- wind
- the cross-sectional make-up of the structure.
The effects of these variations on a bridge deck can be quite complex. On a daily (short-term) and annual (long-term) basis, changes occur. Daytime heat gain and nighttime heat loss occur on a daily basis. The ambient (surrounding) temperature varies from year to year.
On a daily basis, incident sun radiation controls temperatures towards the top, whereas shade air temperature controls temperatures near the bottom. In Figure 1, the whole distribution is shown. Positive indicates a rapid rise in deck slab temperature due to direct sunshine (solar radiation). Negative indicates that the ambient temperature is dropping due to heat loss (re-radiation) from the structure.
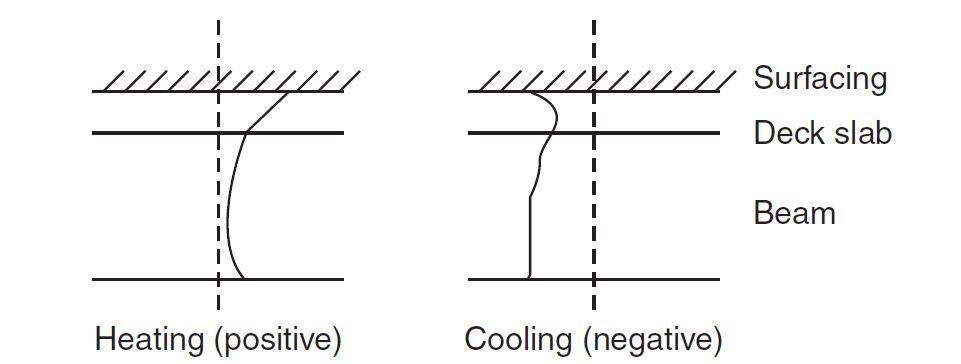
According to research, the distributions (or thermal gradients) for different ‘groups’ of structure as stated in Figure 9 of BD 37/01 Clause 5.4 can be idealized for analysis purposes. The four groups depend on the type of construction and are listed below;
(1) Steel deck on steel box girders
(2) Steel deck on steel truss or plate girders
(3) Concrete deck on steel truss, steel box, or plate girders
(4) Concrete deck on concrete beams or box girders
The thickness of the surface, the thickness of the deck slab, and the type of the beam are all important criteria. The curvature of the deck is caused by temperature changes, which result in internal primary and secondary stresses within the structure.
Temperature Changes on Bridge Decks
Temperature changes on bridges are expressed in terms of a uniform temperature component, a vertical difference component that contains non-linear components, and, when applicable, a horizontal difference component that can be considered to vary linearly. The temperature of the bridge is affected not only by the shade air temperature and solar radiation, but also by the scheme, cross-section, mass, and material used.
As a result, bridges can be categorised into the following categories and subcategories:
- Steel bridge: steel box girder, steel truss, or plate girder;
- Composite bridge
- Concrete bridge: concrete slab, concrete beam, concrete box girder.
Temperature actions on bridge decks are discussed in EN 1991-1-5:2003.
Uniform Temperature Component
The maximum and minimum temperatures, Te,max and Te,min, that the bridge can reach over its working life determine the uniform temperature component. The uniform temperature components Te,max and Te,min can be calculated using the diagrams in Figure 2, where Te,max and Te,min, in °C, are stated in terms of Tmax and Tmin, in °C, for each bridge type previously mentioned.
Over the years, weather stations have recorded the maximum and minimum shade air temperatures. The maximum and minimum design temperatures that the bridge deck may encounter during its design life are predicted using these records. These temperatures are represented as isotherm maps in the codes.
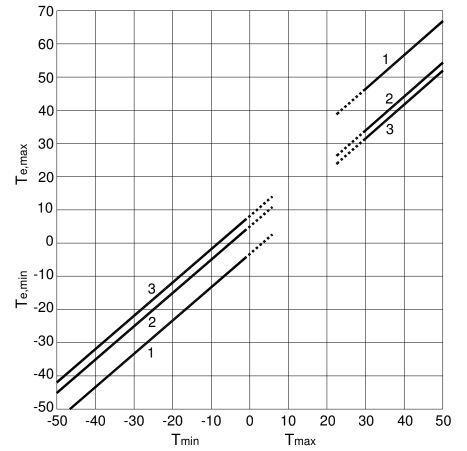
components of the bridge temperature (Te,min, Te,max)
To calculate how much the bridge deck will expand and contract, the maximum and minimum shade air temperatures are transformed into ‘effective’ bridge temperatures Te,max and Te,min and multiplied by the coefficient of thermal expansion and the deck length. The deck can be accommodated by providing joints and sliding bearings, or by restricting the movement and engineering the structure to resist the forces created. For truss or plated steel bridges (category 1), Te,max values can be decreased by 3 °C.
A base reference temperature T0 is used to represent the effective bridge temperature at specific stages of construction. The deck will expand from T0 to Te,max, and contract from T0 to Te,min.
In the case of a free moving deck, T0 is used to calibrate the gap for the expansion joint and to set the sliding bearing positions when these units are installed. However, in the case of a restrained deck, it is used to determine the magnitude of movement that the supporting structure has to accommodate after it has been made integral with the deck.
If T0 is the initial bridge temperature, i.e. the temperature of the bridge at the time when it is restrained, the variation of the uniform bridge temperature ∆Tu is given by;
∆Tu = Te,max – Te,min = ∆TN,esp + ∆TN,con
where
∆TN,exp =Te,max – T0 and ∆TN,con = T0 – Te,min
are the temperature variations to be considered when the bridge expands or contracts, respectively.
Assessing bearing displacements it can be assumed ∆TN,exp = Te,max – T0 + 20°C and ∆TN,con = T0 – Te,min + 20°C.
Vertical temperature varying component
Vertical temperature variations can arise as a result of the top and bottom surfaces of the bridge being heated and cooled differently. These differences correlate to maximum heating and cooling, respectively, when the top surface is warmer than the bottom surface and when the bottom surface is warmer than the top surface. The vertical temperature profiles can be defined under two different hypotheses, depending on whether the non-linear temperature profile ∆TE is ignored or not: in the first case, a simplified equivalent linear profile can be considered, whereas in the second case, a non-linear profile, including ∆TE, is considered.
Equivalent linear vertical temperature profile
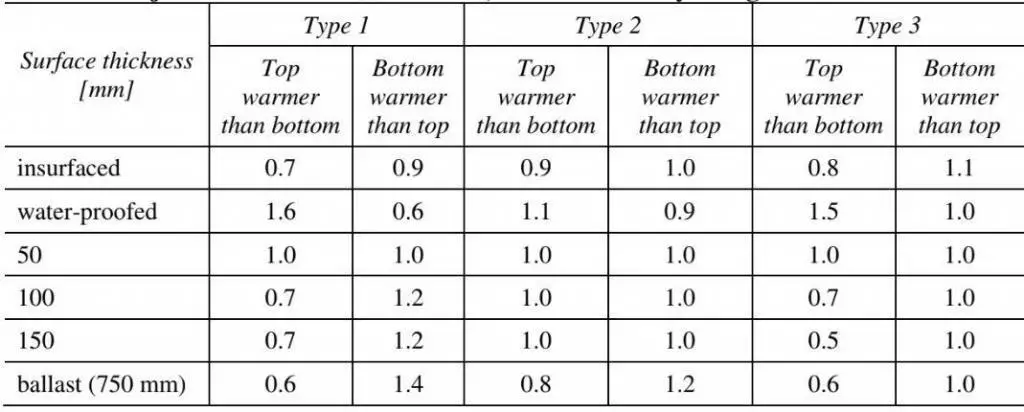
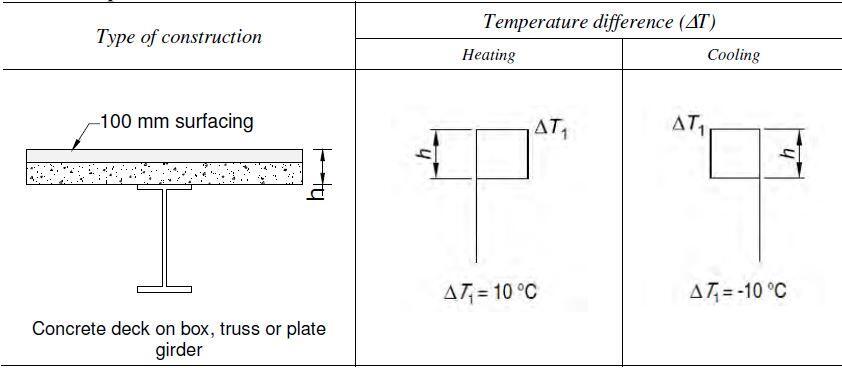
Table 1 shows the maximum temperature differences corresponding to maximum heating or maximum cooling, designated as ∆TM,heat and ∆TM,cool, for the various bridge categories when an equivalent linear vertical temperature profile is used. The temperature differences for road and railway bridges with a 50 mm surface are represented by the upper bound values in Table 1. Table 1 values should be multiplied by the correction factors ksur in Table 2 for varying surface thicknesses.
Table 1: Equivalent linear vertical temperature variations for bridges
| Type of deck | Top warmer than bottom ∆TM,heat [°C] | Bottom warmer than top ∆TM,cool [°C] |
| Type 1: Steel deck | 18 | 13 |
| Type 2: Composite deck | 15 | 18 |
| Type 3: Concrete deck concrete box girder concrete beam concrete slab | 10 15 15 | 5 8 8 |
Table 2: Adjustment factors ksur for road, foot and railway bridges
Non-linear vertical temperature profiles
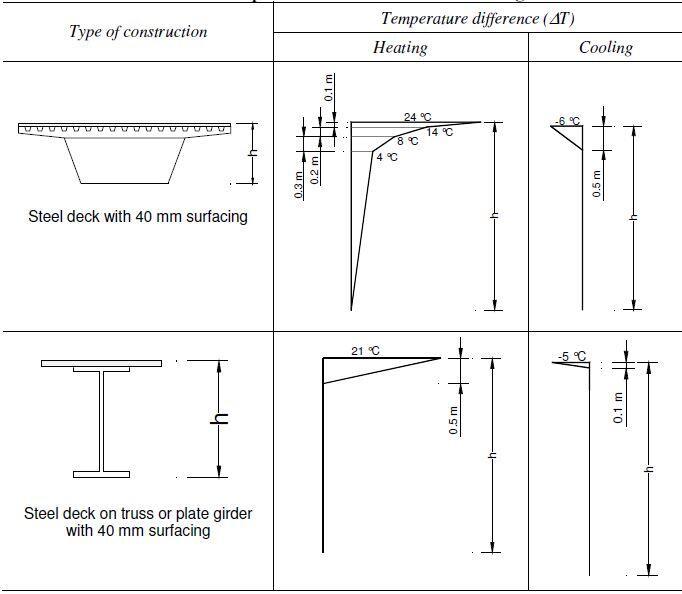
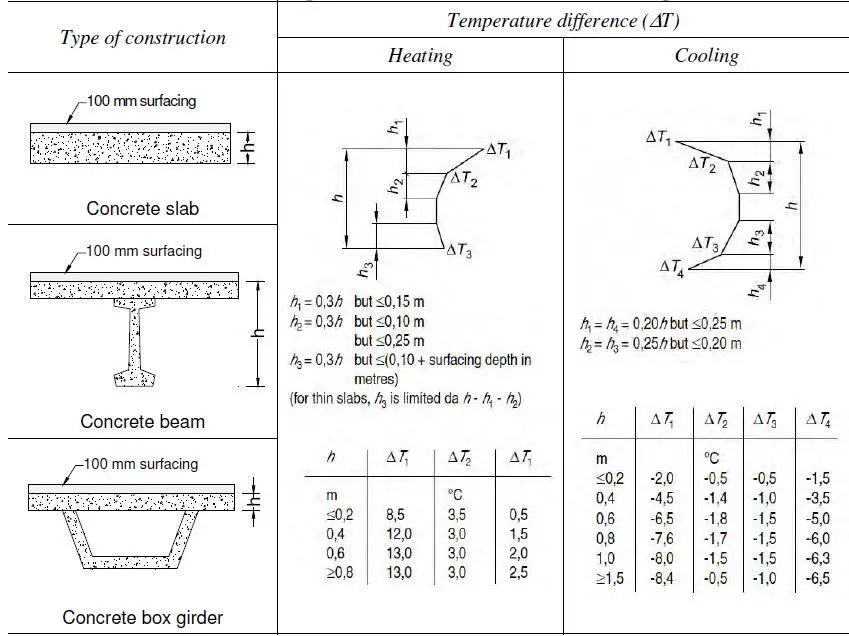
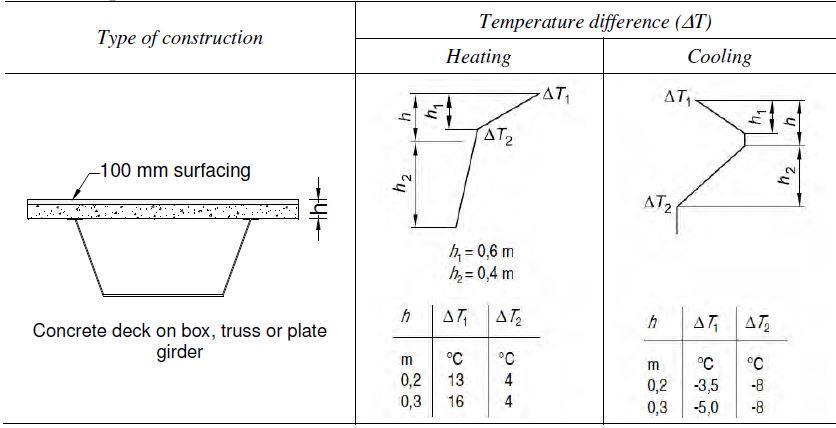
When more detailed calculations are required, the vertical temperature profile can be considered to be non-linear by using the temperature profiles shown in Figures 3, 4, and 5 for steel, concrete, and composite bridges, respectively, in the heating and cooling conditions. Tables 5.a and 5.b show two alternative profiles for composite bridges: normal and simplified.
In general, the simpler profile is safe. The temperature differences ∆T listed in tables 3 to 5 comprise both the vertical temperature component ∆TM and the non-linear temperature component ∆TE, as well as a small portion of the uniform component ∆TN. The temperatures for other surfacing depths of bridge decks of type 1 to 3 are given in Tables B.1 to B.3 of EN 1991-1-5, Annex B.
Horizontal temperature varying component
Horizontal temperature differences in bridges can be generally disregarded, except in special cases, for example when one side of the bridge is much more exposed to the sunlight of the other one. When the horizontal component must be taken into account, a linear variation of 5°C can be assumed.
Worked Example on Calculation of Temperature Stresses on Bridge Decks
Determine the stresses induced by both the positive and reverse temperature differences for the concrete box girder bridge shown in Figure 6 (A = 940000 mm2, I =102534 × 106 mm4, depth to NA = 409 mm, T = 12 × 10-6, E = 34 kN/mm2). This example is adapted from Ryall (2008).
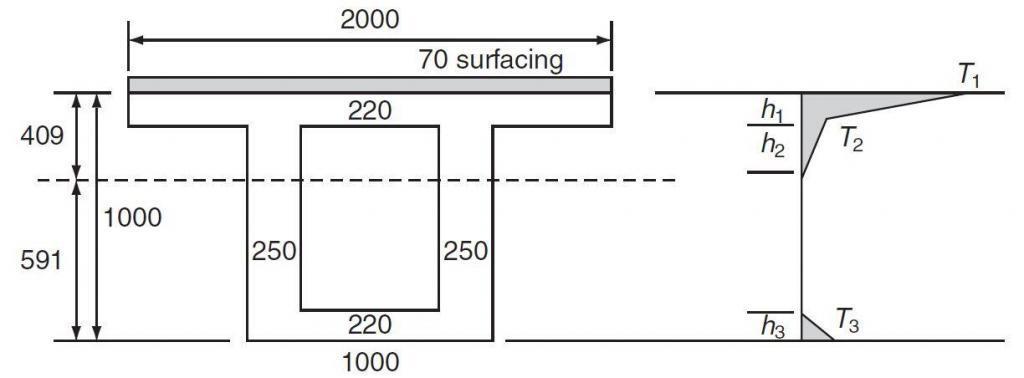
- Calculate critical depths of temperature distribution
From BD 37/88 Figure 9 this is a Group 4 section, therefore:
h1 = 0.3h = 0.3 × 1000 = 300 > 150; thus h1 = 150mm
h2 = 0.3h = 0.3 × 1000 = 300 > 250; thus h2 = 250mm
h3 = 0.3h = 0.3 × 1000 = 300 > 170; thus h3 = 170mm
- Calculate temperature distribution
Basic values are given in Figure 9 of BD 37/01 which are modified for depth of section and surface thickness by interpolating from Table 24 of BD 37/01.
T1 = 17.8 + (17.8 – 13.5)20/50 = 16.1°C
T1 = 4.0 + (4.0 – 3.0)20/50 = 3.6 °C
T1 = 2.1 +(2.5 – 2.1)20/50 = 2.26 °C
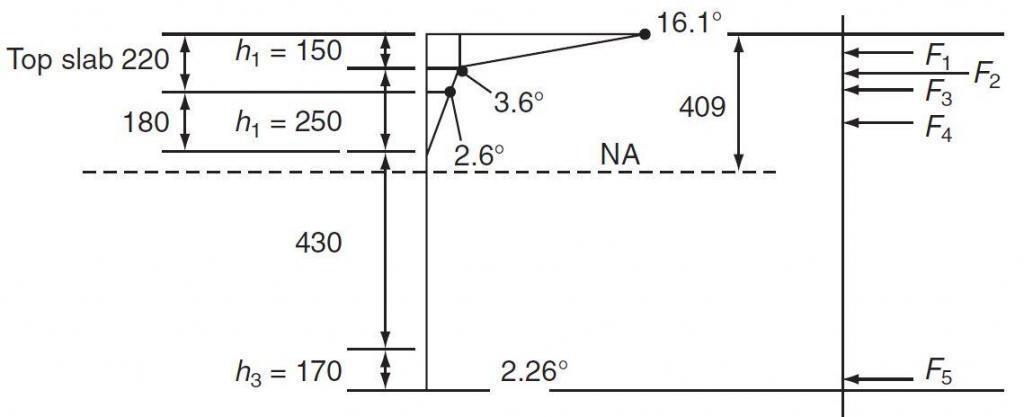
- Calculate restraint forces at critical points
This is accomplished by dividing the depth into convenient elements corresponding to changes in the distribution diagram and/or changes in the section (see Figure 3.2 of BD 37/01):
F = EcβTTiAi
F1 = 34000 × 12 × 10-6 × (16.1 – 3.6) × 2000 × 150/1000 = 765 kN
F2 = 34000 × 12 × 10-6 × (3.6) × 2000 × 150/1000 = 441 kN
F3 = 34000 × 12 × 10-6 × [(3.6 + 2.6)/2] × 2000 × (220 – 150)/1000 = 177 kN
F4 = 34000 × 12 × 10-6 × (2.6/2) × 2 × (250 – 70) × 250/1000 = 48 kN
F5 = 34000 × 12 × 10-6 × (2.26/2) × 1000 × 170/1000 = 78 kN
Total F = 1509 kN (tensile)
- Calculate restraint moment about the neutral axis
M = [765(409 – 50) + 441(409 – 75) + 177(409 – 185) + 28(409 – 270) – 78(591 – 170 × 2/3)]/1000 = 431 kNm (hogging)
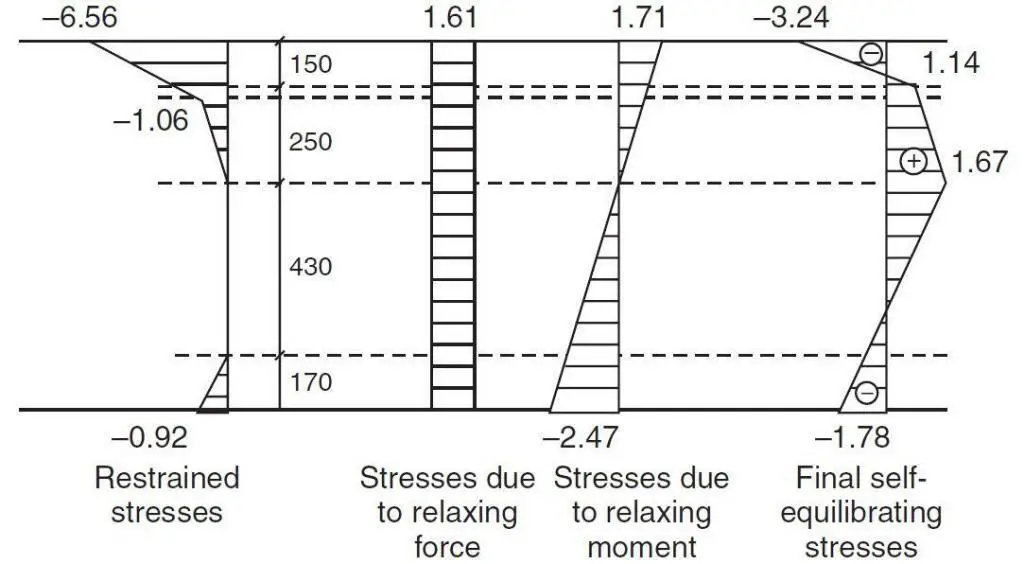
Calculate restraint stresses
f = EcβTTi
f01 = -34000 × 12 × 10-6 × 16.1 = 6.56N/mm2
f02 = -34000 × 12 × 10-6 × 3.6 = 1.47 N/mm2
f03 = -34000 × 12 × 10-6 × 2.6 = 1.06 N/mm2
f04 = -34000 × 12 × 10-6 × 0 = 0.00 N/mm2
f05 = -34000 × 12 × 10-6 × 0 = 0.00 N/mm2
f06 = -34000 × 12 × 10-6 × 2.26 = 0.92 N/mm2
- Calculate balancing stresses
Direct stress f10 = (1509 × 103)/940000 = 1.61 N/mm2
Bending stresses f2i = My/I:
f21 = [(431 × 106)/(102534 × 106)] × 409 = 1.71 N/mm2
f22 = [(431 × 106)/(102534 × 106)] × 259 = 1.08 N/mm2
f23 = [(431 × 106)/(102534 × 106)] × 180 = 0.75 N/mm2
f24 = [(431 × 106)/(102534 × 106)] × 9 = 0.06 N/mm2
f25 = [(431 × 106)/(102534 × 106)] × 421 = -1.76 N/mm2
f26 = [(431 × 106)/(102534 × 106)] × 591 = -2.47 N/mm2
- Calculate final stresses
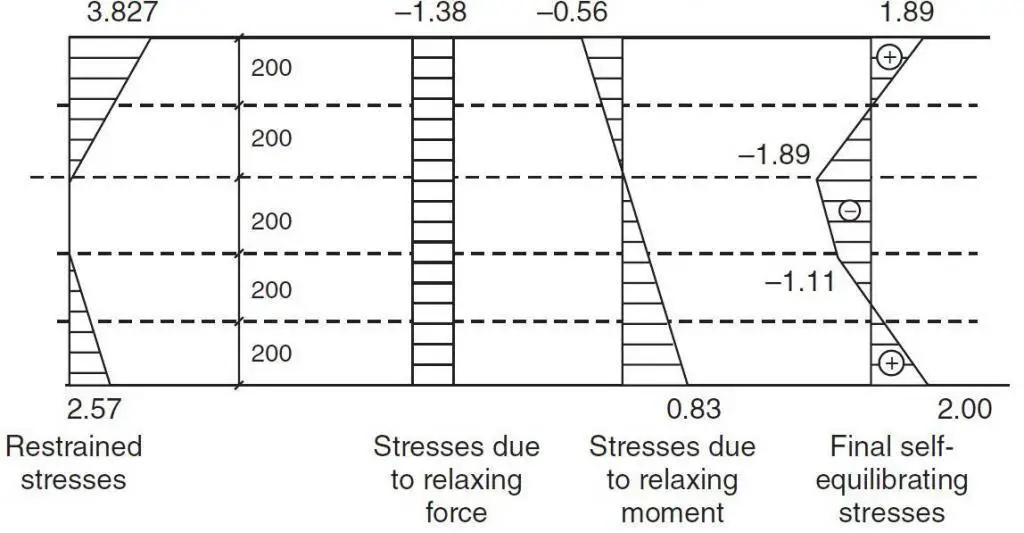
The final stress distribution is shown in Figure 8. Similar calculations for the cooling (reverse) situation are shown in Figure 9.
References
[1] Rryall M. J. (2008): Loads and load distribution, in ICE Manual of Bridge Engineering (2nd Edition). Edited by Parke G. and Hewson N. doi: 10.1680/mobe.34525.0023


