8.7 C
New York
Friday, September 20, 2024
Home Blog Page 33

Design of Pile Foundation
Deep foundations are employed when the soil stratum beneath the structure is not capable of supporting the load with a tolerable settlement or adequate safety against shear failure. The two common types of deep foundations are well foundations (or caissons) and pile foundations. Piles are relatively long, slender members that are driven into the ground or cast-in-situ. The design of pile foundation involves providing adequate pile type, size, depth, and number to support the superstructure load without excessive settlement and bearing capacity failure. Deep foundations are more expensive and technical than shallow foundations.

Pile Foundations can be used in the following cases;

  1. When the upper soil layer(s) is (are) highly compressible and too weak to support the load transmitted by the superstructure, piles are used to transmit the load to underlying bedrock or a stronger soil layer. When bedrock is not encountered at a reasonable depth below the ground surface, piles are used to transmit the structural load to the soil gradually. The resistance to the applied structural load is derived mainly from the frictional resistance developed at the soil–pile interface.
  2. When subjected to horizontal forces, pile foundations resist by bending while still supporting the vertical load transmitted by the superstructure. This situation is generally encountered in the design and construction of earth-retaining structures and foundations of tall structures that are subjected to strong wind and/or earthquake forces.
  3. In many cases, the soils at the site of a proposed structure may be expansive and collapsible. These soils may extend to a great depth below the ground surface. Expansive soils swell and shrink as the moisture content increases and decreases, and the swelling pressure of such soils can be considerable. If shallow foundations are used, the structure may suffer considerable damage.
  4. The foundations of some structures, such as transmission towers, offshore platforms, and basement mats below the water table, are subjected to uplifting forces. Piles are sometimes used for these foundations to resist the uplifting force.
  5. Bridge abutments and piers are usually constructed over pile foundations to avoid the possible loss of bearing capacity that a shallow foundation might suffer because of soil erosion at the ground surface
pile foundation
Figure 1: Schematic representation of pile foundation

Classification of Piles

Piles may be classified in a number of ways based on different criteria:

(a) Function or action
(b) Composition and material
(c) Method of installation

Classification Based on Function or Action

Piles may be classified as follows based on the function or action:

End-bearing piles
Used to transfer load through the pile tip to a suitable bearing stratum, passing soft soil or water.

Friction piles
Used to transfer loads to a depth in a frictional material by means of skin friction along the surface area of the pile.

Tension or uplift piles
Uplift piles are used to anchor structures subjected to uplift due to hydrostatic pressure or to overturning moment due to horizontal forces.

Compaction piles
Compaction piles are used to compact loose granular soils in order to increase the bearing capacity. Since they are not required to carry any load, the material may not be required to be strong; in fact, sand may be used to form the pile. The pile tube, driven to compact the soil, is gradually taken out and sand is filled in its place thus forming a ‘sand pile’.

Anchor piles
These piles are used to provide anchorage against horizontal pull from sheetpiling or water.

Fender piles
They are used to protect water-front structures against impact from ships or other floating objects.

Sheet piles
Sheet piles are commonly used as bulkheads, or cut-offs to reduce seepage and uplift in hydraulic structures.

Batter piles
Used to resist horizontal and inclined forces, especially in water front structures.

Laterally-loaded piles
Used to support retaining walls, bridges, dams, and wharves and as fenders for harbour construction.

Classification Based on Material and Composition

Piles may be classified as follows based on material and composition:

Timber piles
These are made of timber of sound quality. Length may be up to about 8 m; splicing is adopted for greater lengths. Diameter may be from 30 to 40 cm. Timber piles perform well either in fully dry condition or submerged condition. Alternate wet and dry conditions can reduce the life of a timber pile; to overcome this, creosoting is adopted. Maximum design load is about 250 kN.

Steel piles
These are usually H-piles (rolled H-shape), pipe piles, or sheet piles (rolled sections of regular shapes). They may carry loads up to 1000 kN or more.

RAKER H PILES
Figure 2: Steel H-section piles

Concrete piles
These may be ‘precast’ or ‘cast-in-situ’. Precast piles are reinforced to withstand handling stresses. They require space for casting and storage, more time to cure and heavy equipment for handling and driving. Cast-in-situ piles are installed by pre-excavation, thus eliminating vibration due to driving and handling.

precast concrete piles
Figure 3: Precast concrete piles

Composite piles
These may be made of either concrete and timber or concrete and steel. These are considered suitable when the upper part of the pile is to project above the water table. The lower portion may be of untreated timber and the upper portion of concrete. Otherwise, the lower portion may be of steel and the upper one of concrete.

Classification Based on Method of Installation

Piles may also be classified as follows based on the method of installation:

Driven piles
Timber, steel, or precast concrete piles may be driven into position either vertically or at an inclination. If inclined they are termed ‘batter’ or ‘raking’ piles. Pile hammers and pile-driving equipment are used for driving piles.

Cast-in-situ piles
Only concrete piles can be cast-in-situ. Holes are drilled and these are filled with concrete. These may be straight-bored piles or may be ‘under-reamed’ with one or more bulbs at intervals. Reinforcements may be used according to the requirements.

Driven and cast-in-situ piles
This is a combination of both types. Casing or shell may be used. The Franki pile falls in this category.

However, the commonest type of pile foundation in Nigeria is bored piles using continuous flight auger (CFA).

Design of Pile Foundation

Section 7 of EN 1997-1:2004 is dedicated to the geotechnical design of pile foundations. There are some design standards that are dedicated to the design and construction of pile foundations. A design standard that is referred to is the part of Eurocode 3 for the structural design of steel piles:

  • EN 1993-5: Eurocode 3, Part 5: Design of Steel Structures – Piling

Other standards that can be referred to for the execution of piling work are;

  • EN 1536:1999 – Bored Piles
  • EN 12063:1999 – Sheet pile walls
  • EN 12699:2000 – Displacement piles
  • EN 14199:2005 – Micropiles

Approaches to the design of pile foundations

According to clause 7.4(1)P of EN 1997-1, the design of piles shall be based on one of the following approaches:

  1. The results of static load tests, which have been demonstrated, by means of calculations or otherwise, to be consistent with other relevant experience
  2. Empirical or analytical calculation methods whose validity has been demonstrated by static load tests in comparable situations
  3. The results of dynamic load tests whose validity has been demonstrated by static load tests in comparable situations
  4. The observed performance of a comparable pile foundation provided that this approach is supported by the results of site investigation and ground testing.

Static load test is the best way of verifying the load-carrying capacity of piles, however, it is not very attractive because it is expensive and time-consuming. Traditionally, engineers have designed pile foundations based on calculations from theoretical soil mechanics. The commonest approach is to divide the soil into layers and assign soil properties to each layer. The most important soil parameters given to each layer is cohesion (C) and angle internal friction (ϕ). These two properties will enable the quick determination of the bearing capacity factors for evaluation of the load-carrying capacity of the pile.

From the soil profile, the shaft friction on the pile from different layers is summed up to obtain the total shaft friction resistance of the pile. The base resistance of the pile is also obtained based on the soil properties of the layer receiving the tip of the pile.

Design of pile foundation in layered soil
Figure 4: Pile in a layered soil

Hence ultimate pile resistance Qu;

Qu = ∑Qs + Qb —— (1)

Qs = Shaft resistance = qsAs
Qb = Base resistance = qbAb

Where qs is the unit shaft resistance of the pile and As is the surface area of the pile for which qs is applicable. Ab is the cross-sectional area of the base of the pile while qb is the base resistance.

For pile in cohesionless soil (C = 0)
Qs = q0KstanδAs —— (2)

For pile in cohesive soil (ϕ = 0)
Qs = αCuAs —— (3)

Where;
q0 is the average effective overburden pressure over the embedded depth of the pile for which Kstanδ is applicable.
Ks is the lateral earth pressure coefficient
δ is the angle of wall friction
Cu is the average undrained shear strength of clay along the shaft
α is the adhesion factor.

Typical values of δ and Ks are given in the table below;

pile wall friction values

On the other hand, the typical equations for obtaining the base resistance of a single pile are given below;

Qb = Base resistance = qbAb
Where qb is the unit base resistance of the pile and Ab is the area of the pile base.

For pile in cohesionless soil (C = 0)
Qb = q0NqAb —— (4)

For pile in cohesive soil (ϕ = 0)
Qb = cbNcAb —— (5)

For pile in c-ϕ soil;
Qb = (cbNc + q0Nq)Ab —— (6)

Where Nq and Nc are bearing capacity factors.

Therefore for a design to be considered acceptable, the applied load ≤ Ultimate Capacity/Factor of Safety. The factor of safety usually varies between 2.0 and 3.0 and depends on the quality of ground investigation carried out.

Pile Foundation Design to Eurocode 7

EN 1997-1:2004 allows the resistance of individual piles to be determined from;

  • static pile formulae based on ground parameters
  • direct formulae based on the results of field test
  • the results of static pile load test
  • the results of dynamic impact tests
  • pile driving formulae, and
  • wave equation analysis

According to clause 7.6.2.1 (1)P, to demonstrate that the pile foundation will support the design load with adequate safety against compressive failure, the following inequality shall be satisfied for all ultimate limit state load cases and load combinations:

Fc,d ≤ Rc,d —— (7)

Where Fc,d is the design axial load on the pile, while Rc,d is the compressive resistance of the pile. Fc,d should include the weight of the pile itself, and Rc,d should include the overburden pressure of the soil at the foundation base. However, these two items may be disregarded if they cancel approximately. They need not cancel if the downdrag is significant, or when the soil is very light, or when the pile extends above the ground surface.

For piles in group, the design resistance shall be taken as the lesser of the compressive resistance of the piles acting individually, and the compressive resistance of the piles acting as a group (block capacity). According to clause 7.6.2.1(4), the compressive resistance of the pile group acting as a block may be calculated by treating the block as a single pile of large diameter.

Static pile formulae based on ground parameters

Methods for assessing the compressive resistance of a pile foundation from ground test results shall have been established from pile load tests and from comparable experience. Generally, the compressive resistance of the pile shall be derived from;

Rc,d = Rb,d + Rs,d —— (8)

Where;
Rb,d = Rb,kb
Rs,d = Rs,ks

The values of the partial factors may be set by the National annex. The recommended values for persistent and transient situations are given in Table A6, A7, and A8 of EN 1997-1:2004 for driven, bored, and CFA piles respectively;

Table 1 (Table A6): Partial resistance factors (γR) for driven piles

ResistanceSymbolR1R2R3R4
Baseγb1.01.11.01.3
Shaft (compression)γs1.01.11.01.3
Total/combined (compression)γt1.01.11.01.3
Shaft in tensionγs;t1.251.151.11.6

Table 2 (Table A7): Partial resistance factors (γR) for bored piles

ResistanceSymbolR1R2R3R4
Baseγb1.251.11.01.6
Shaft (compression)γs1.01.11.01.3
Total/combined (compression)γt1.151.11.01.5
Shaft in tensionγs;t1.251.151.11.6

Table 3 (Table A8): Partial resistance factors (γR) for continuous flight auger (CFA) piles

ResistanceSymbolR1R2R3R4
Baseγb1.11.11.01.45
Shaft (compression)γs1.01.11.01.3
Total/combined (compression)γt1.111.11.01.4
Shaft in tensionγs;t1.251.151.11.6

The characteristic values Rb,k and Rs,k shall be determined from;

Rc,k = Rb,k + Rs,k = (Rb,cal + Rs,cal)/ξ = Rc,cal/ξ = min[Rc,cal(mean)3; Rc,cal(min)4] —— (9)

where ξ3 and ξ4 are correlation factors that depend on the number of profiles of tests, n. The values of the correlation factors may be set by the National annex. The recommended values are given in Table A10 of EN 1997-1:2004. For structures with sufficient stiffness and strength to transfer loads from “weak” to “strong” piles, the factors ξ3 and ξ4 may be divided by 1.1, provided that is never less than 1.0.

A10

The characteristic values may be obtained by calculating:
Rb,k = Ab qb,k —— (11)
Rs,k = ∑As,i qs,i,k —— (12)

where qb,k and qs,i,k are the characteristic values of base resistance and shaft friction in the various strata, obtained from values of ground parameters.

To estimate pile shaft friction and end bearing from ground parameters, the following relationships may be applied;

Cohesionless soils;
qs,k = σv‘kstanδ —— (13)
qb,k = σv‘ Nq —— (14)

Cohesive soil or weak rock (mudstone)
qs,k = αCu —— (15)
qb,k = CuNc —— (16)

Adhesion factor (α) can be read from chart, or determined from the unconfined compression test result (UCS). For piles in clay, Nc is usually taken as 9.0.

Undrained shear strength versus for a bored and b driven piles adapted from
Figure 5: Relationship between adhesion factor and undrained conhesion of soil

It is usually recommended that Cu < 40 kPa, α should be taken as 1.0.

AD FACTOR
Figure 5: Relationship between adhesion factor and unconfined compressive strength of soil

Design of pile foundation using static pile load test

The procedure for determining the compressive resistance of a pile from static load tests is based on analysing the compressive resistance, Rc,m, values measured in static load tests on one or several trial piles. The trial piles must be of the same type as the piles of the foundation, and must be founded in the same stratum.

An important requirement stated in Eurocode 7 is that the interpretation of the results of the pile load tests must take into account the variability of the ground over the site and the variability due to deviation from the normal method of pile installation. In other words, there must be a careful examination of the results of the ground investigation and of the pile load test results. The results of the pile load tests might lead, for example, to different ‘homogeneous’ parts of the site being identified, each with its own particular characteristic pile compressive resistance.

To use static load test result to design pile foundation, determine the characteristic value Rc,k from the measured ground resistance Rc,m using the following equation:

Rc,k = Min{(Rc,m)mean1; (Rc,m)min2} —— (17)

where ξ1 and ξ2 are correlation factors related to the number n of piles tested, and are applied to the mean (Rc,m)mean and to the lowest (Rc,m)min of Rc,m, respectively. The recommended values for these correlation factors, given in Annex A, are intended primarily to cover the variability of the ground conditions over the site. However, they may also cover some variability due to the effects of pile installation.

correlation factors for static pile load test 1

The design pile compressive resistance, Rc,d is obtained by applying the partial factor γt to the total characteristic resistance or the partial factors γs and γb to the characteristic shaft resistance and characteristic base resistance, respectively, in accordance with the following equations:

Rc,d = Rc,kt —— (18)
or
Rc,d = Rb,kb + Rs,ks —— (19)

Rc,d for persistent and transient situations may be obtained from the results of pile load tests using DA-1 and DA-2 and the recommended values for the partial factors γt or γs and γb given in Tables A.6, A.7 and A.8 of EN 1997-1:2004.


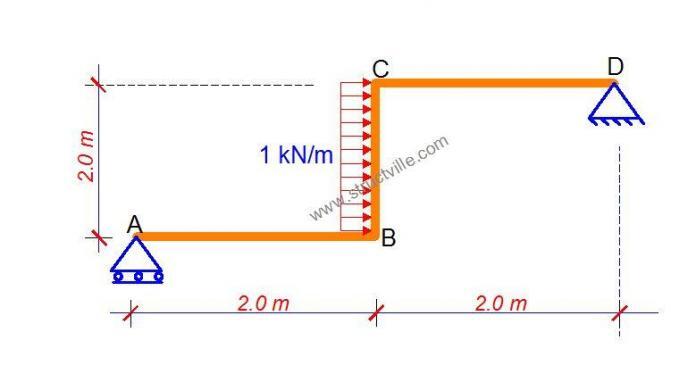
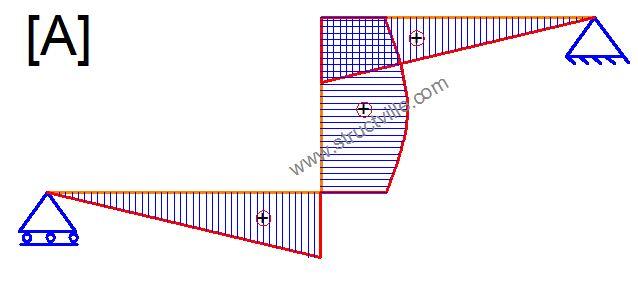
Question of the day | 18-12-2020

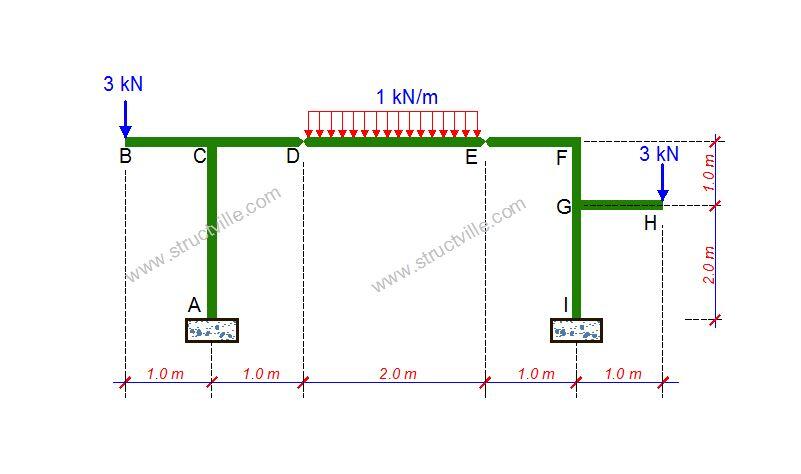
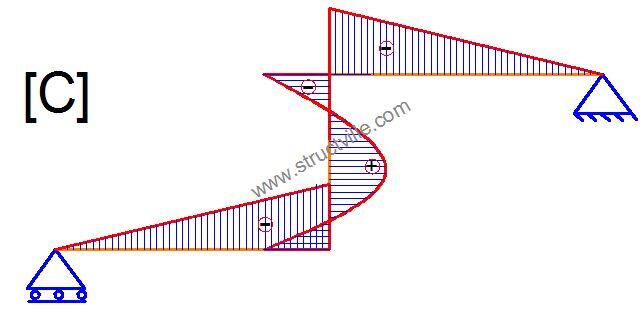
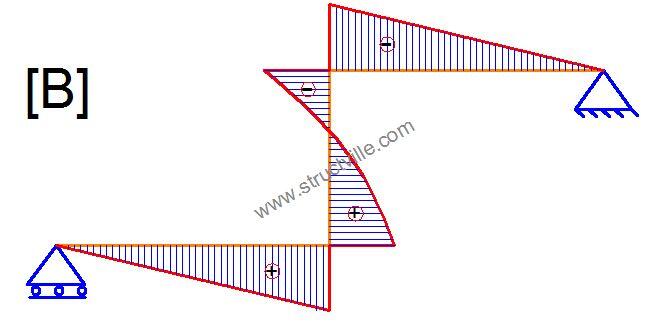
For the structure loaded as shown above;

(1) What is the bending moment at point B? (take clockwise moment as negative).

(A) -4 kNm
(B) -2.25 kNm
(C) -8 kNm
(D) -2 kNm

(2) What is the bending moment at support A? (take clockwise moment as negative)

(A) -4 kNm
(B) -2.25 kNm
(C) -8 kNm
(D) -2 kNm

Dynamics of Footbridges | Vibration and Serviceability

Footbridges are susceptible to traffic-induced vibration due to their typical slender nature. Therefore, the serviceability level of pedestrian bridges is influenced by the deformations and vibrations caused by the human traffic on the bridge. In considering the dynamics of footbridges, all types of vibration on the main structure such as vertical and horizontal vibrations, torsional vibrations (which may be alone or coupled with vertical and/or horizontal vibration), should be identified and taken into account.

In studying the dynamics of footbridges, it is important to select and consider the appropriate design situation. This can be influenced by pedestrian traffic admitted on individual footbridges during their design working life, and how access to the bridge will be authorised, regulated, and controlled.

According to [1], the design situations should include:

  1. The simultaneous presence of a group of about 8 to 15 persons walking normally as a persistent design situation;
  2. The simultaneous presence of streams of pedestrians (significantly more than 15 persons), which could be persistent, transient or accidental depending on boundary conditions, like location of the footbridge in urban or rural areas, the possibility of crowding due to the vicinity of railway and bus stations, schools, important building with public admittance, the relevance of the footbridge itself;
  3. Occasional sports, festive or choreographic events, which require specific studies.

Read Also…
Actions on footbridges
Analysis and Design of a Pedestrian Bridge Using Staad Pro

Footbridge-Traffic Interaction

Periodic forces exert by a pedestrian normally walking are;

  • vertical, with a frequency ranging between 1 and 3 Hz, and
  • horizontal, with a frequency ranging between 0.5 and 1.5 Hz, perfectly synchronised with the vertical ones.

The forces exerted by several persons walking on a footbridge are usually not synchronised and characterised by different frequencies. When the frequency of the forces normally exerted by pedestrians is close to a natural frequency of the deck, it commonly happens that the subjective perception of the bridge oscillation induces the pedestrian to synchronise their steps with the vibrations of the bridge, so that resonance occurs, increasing considerably the response of the bridge.

It is important to note that the number of persons contributing to the resonance of a footbridge is highly random; beyond about 10 persons on the bridge, it is a decreasing function of their number. The resonance is in most cases mainly, but not solely, marked with the fundamental frequency of the bridge. Correlation between forces exerted by pedestrians may increase with movements.

Dynamic models of pedestrian loads

Two separate dynamic models of pedestrian loads for the design of footbridges could be defined:

  • a concentrated force (Fn), representing the excitation by a limited group of pedestrians, which should be systematically used for the verification of the comfort criteria;
  • a uniformly distributed load (Fs), representing the excitation by a continuous stream of pedestrians, which should be used also where specified, separately from Fn.

Load model Fn, which should be placed in the most adverse position on the bridge deck, consists of one pulsating force (N) with a vertical component;

Fnv = 280kv(fv) sin(2πfvt) —— (1)

and a horizontal component;

Fnh = 70kh(fh) sin(2πfht) —— (2)

where;
fv is the natural vertical frequency of the bridge closest to 2 Hz,
fh is the natural horizontal frequency of the bridge closest to 1 Hz,
t is the time in seconds and,
kv(fv) and kh(fh) are suitable coefficients, depending on the frequency, given in the figure below;

footbridge vibration
Figure 1: Relationships between coefficients kv(fv), kh(fh) and frequencies fv, fh [1]

The two components Fn,v and Fn,h should be considered separately.

When inertia effects are evaluated as well as for the calculation of fv or fh, Fn should be associated with a static mass equal to 800 kg (if unfavourable), applied at the same location. The uniformly distributed load model Fs, to be applied on the whole deck of the bridge, consists of a uniformly distributed pulsating load (N/m2) with a vertical component;

Fsv = 15kv(fv) sin(2πfvt) —— (3)

and a horizontal component;

Fsh = 4kh(fh) sin(2πfht) —— (4)

to be considered separately.

When inertia effects are evaluated as well as for the calculation of fv or fh, Fs should be associated with a static mass equal to 400 kg/m2 (if unfavourable), applied at the same location.

For a particular project, especially for big footbridges, it may be possible to increase the reliability degree of the assessments, by specifying to apply Fs on limited unfavourable areas (e.g. span by span) or with an opposition of phases on successive spans.

Human Comfort Criteria on Footbridges

In order to ensure pedestrian comfort on footbridges, the maximum acceleration of any part of the deck should not exceed;

  • 0.7 (m/s2) for vertical vibrations; or
  • 0.15 (m/s2) for horizontal vibrations.

The assessment of comfort criteria should be performed when the natural vertical frequency is less than 5 Hz or the horizontal and torsional natural frequencies are less than 2.5 Hz. The assessment of natural frequencies fv or fh should take into account the mass of any permanent load. The mass of pedestrians should be taken into account only for very light decks.

The stiffness parameters of the deck should be based on the short term dynamic elastic properties of the structural material and, if significant, of the parapets. When comfort criteria do not seem to be satisfied with a significant margin, it is recommended to make provision in the design for the possible installation of dampers in the structure after its completion.

Evaluation of accelerations shall take into account the damping of the footbridge, through the damping factor ζ referring to the critical damping, or the logarithmic decrement δ, which is equal to 2πζ.

For rather short spans, when calculations are performed using the groups of pedestrians given before, the acceleration can be reduced by multiplying it by;

  • knv = 1 – e(-2πnζ) for vertical vibrations or by
  • knh = 1 – e(-πnζ) for horizontal vibrations, being

n, equal to 12 times the number of steps necessary to cross the span under consideration.
For a simple span, the design value of the vertical acceleration (m/s2) due to the group of pedestrians may then be taken as equal to;

ad = 165kv(fv) × (1 – e(-2πnζ))/Mζ —— (5)

M is the total mass of the span, f is the relevant, i.e. the determining, fundamental frequency, and kv(fv) is given in Figure 1.

References
[1] Pietro Croce P., Sanpaolesi L. (2005): Bridges – Actions and Load Combinations. In Handbook 4 Design of Bridges (Guide to basis of bridge design related to Eurocodes supplemented by practical examples) Leonardo da Vinci Pilot Project CZ/02/B/F/PP-134007

Unit Weight of Construction Materials

Unit weight or density is used to quantify the weight per unit volume of an object. When it is expressed in the basic SI Unit of mass (kg/m3), it is usually referred to as density, but when expressed in terms of weight (kN/m3), it is usually referred to as unit weight.

Density (kg/m3) = Mass (kg)/Volume (m3)

The unit weight of a material is very important in calculating the self-weight of the material, especially when evaluating the permanent actions in a structure. Without the knowledge of the unit weight of a material, it will be impossible to accurately estimate the bodyweight and the load it subsequently carries when used as a structural member. This article is dedicated to providing a handy list of the unit weight of various construction materials according to EN 1991-1-1:2002.

The density of a material can vary depending on the composition, process of manufacturing, and other factors. However, the density of man-made products is fairly constant (or controllable) when compared with the density of direct products of nature. Therefore, natural materials are expected to have slightly different properties even when they are occurring in the same place.

(a) Unit weight of concrete and mortar

MaterialsDensity (kN/m3)
Hardened normal weight concrete24.0
Reinforced concrete (normal percentage)25.0
Fresh concrete25.0
Cement mortar19.0 to 23.0
Gypsum mortar12.0 to 18.0
Lime-cement mortar 18.0 to 20.0
Lime mortar12.0 to 18.0

(b) Unit weight of natural stones

Natural StoneUnit weight (kN/m3)
granite, syenite, porphyry27.0 to 30.0
basalt, diorite, gabbro27.0 to 31.0
tachylyte26.0
basaltic lava24.0
gray wacke, sandstone21.0 – 27.0
Dense limestone20.0 – 29.0
other limestone20.0
volcanic tuff20.0
gneiss30.0
slate28.0

(c) Unit weight of timber and timber derived products

Timber/timber derived productUnit weight (kN/m3)
timber strength class C143.5
timber strength class C224.1
timber strength class C304.6
timber strength class D306.4
timber strength class D507.8
timber strength class D7010.8
homogeneous glulam GL24h3.7
homogeneous glulam GL32h4.2
combined glulam GL24c3.5
combined glulam GL32c4.0
combined glulam GL36c4.2
softwood plywood5.0
birch plywood7.0
laminboard and blockboard4.5
chipboard7.0 to 8.0
cement-bonded particle board12.0
flake board, oriented strand board, wafer board7.0
hardboard, standard and tempered10.0
medium density fibreboard8.0
softboard4.0

(d) Unit weight of metals

MetalUnit weight (kN/m3)
aluminium27.0
brass83.0 – 85.0
bronze83.0 – 85.0
copper87.0 – 89.0
cast iron71.0 – 72.5
wrought iron76.0
lead112.0 – 114.0
steel77.0 – 78.5
zinc71.0 – 72.0

(e) Unit weight of glass and plastics

MaterialUnit weight (kN/m3)
Broken glass22.0
Glass in sheets25
Acrylic sheet – plastic12.0
polystyrene, expanded, granules0.3
foam glass1.4
Terracota (solid)21
Cork (compressed)4

(f) Unit weight of asphalt/pavement materials

MaterialUnit weight (kN/m3)
gussasphalt and asphaltic concrete24.0 – 25.0
mastic asphalt18.0 – 22.0
hot rolled asphalt23.0
sand (dry)15.0 – 16.0
hardcore18.5 – 19.5
Quarry dust14.1

(g) Roofs and roofing materials

MaterialWeight per unit area (kN/m2)
Steel roof trusses in spans up to 25 m1.0 – 2.0
Corrugated asbestos-cement or steel sheeting, steel purlins etc.0.4 – 0.5
Roofing felt and screed2.0
Patent glazing (with lead-covered astragals), steel purlins etc.0.4
Slates or tiles, battens, steel purlins etc.0.7 – 0.9
Plain roofing tiles0.6 – 0.9
Interlocking roofing tiles0.6
0.45 mm gauge aluminium roofing sheet0.014

(h) Block works, brick works, partitions, and wall finishes

MaterialWeight per unit area (kN/m2)
225 mm block work2.87
150 mm sandcrete block work2.15
Wall finishes (both sides)0.6
12 mm plaster rendering0.3
Two-coat gypsum 12 mm thick0.215
Plasterboard 13 mm thick1.1
Gypsum panels 75 mm thick4.4
Clay hollow block0.0113 / mm thick
Common clay blocks0.0189 / mm thick
Engineering clay bricks0.0226 / mm thick
Refractory bricks0.0113 / mm thick

(i) Floor finishes

MaterialWeight per unit area (kN/m2)
Clay floor tiles0.575
25 mm thick terrazo floor0.6
37 mm thick screeding0.8
Terrazo paving0.0222 / mm thick
6 mm thick glazed tile + adhesive0.181
8 mm thick glazed tile + adhesive0.214
10 mm thick glazed tile + adhesive0.246
10 mm thick porcelain floor tiles + adhesive0.275
8 – 10 mm thick vitrified floor tiles + adhesive0.215
10 mm thick granite floor tiles + adhesive0.346
12 mm thick granite floor tiles + adhesive0.4
20 mm thick granite floor tiles + adhesive0.622

Loads on Footbridges | Actions on Pedestrian Bridges

A footbridge (also called a pedestrian bridge) is a structure that is designed to enable pedestrians to cross over natural or man-made obstacles such as busy highways, railways, water bodies, gullies, etc, with minimal risk. Pedestrians are generally humans that are travelling on foot and also includes people in a wheelchair, or people that are pushing tramps. In the design of a footbridge, it is very important to evaluate the loads (actions) that it will encounter during its service life.

The possible loads that footbridges are subjected to are;

  1. Human traffic
  2. Self-weight of the bridge and its ancillaries
  3. Wind load
  4. Earthquake load (where applicable)
  5. Snow load (where applicable)
  6. Dynamic water pressure (for bridges crossing water bodies)
  7. Thermal actions
  8. Possible accidental action from impact

In the recent wake of the need for sustainable urban transportation, some pedestrian bridges are being designed to accommodate both pedestrians and cyclists. Furthermore, to ensure that footbridges are accessible to the disabled and mobility-impaired people, there should be provision for ramps or lifts so that they can cross over safely. The use of lifts should be a better option compared to ramps due to the high demand for space, especially in urban areas.

Pedestrian bridges can also serve as monumental structures that can be used for the decoration and beautification of cities and streets. Beautiful and well designed footbridges can adorn the skylines of a city, and form unique features that can easily attract tourists.

Bridge In Vietnam Hands
Figure 1: The Golden Bridge in Vietnam – A famous pedestrian bridge that opened in 2018

Actions on Footbridges

The actions on pedestrian bridges can be found in section 5 of EN 1991-2 (Eurocode 1 Part 2). The section covers explicitly actions on footways, cycle tracks, and footbridges. It is important to note that the uniformly distributed load qfk and the concentrated load Qfwk given in section 5 of EN 1991-2, where relevant can be also used for parts of road and railway bridges accessible to pedestrians. However, all other variable actions described therein apply to footbridges only.

Furthermore, it is important to note that the load models and their representative values take into account dynamic amplification effects, and can be used for all kind of serviceability and ultimate limit state static calculations, except fatigue limit states. The load models do not cover the effects of loads on construction sites and should be separately specified, where relevant.

The imposed loads defined in EN 1991-2 result from pedestrian and cycle traffic, minor common construction and maintenance loads (e.g. service vehicles), and accidental situations. These loads give rise to vertical and horizontal, static, and dynamic forces.

Static Models for Vertical Loads on Footbridges

Three mutually exclusive vertical load models can be envisaged for footbridges. They are;

  1. a uniformly distributed load representing the static effects of a dense crowd;
  2. one concentrated load, representing the effect of a maintenance load;
  3. one or more, mutually exclusive, standard vehicles, to be taken into account when maintenance or emergency vehicles are expected to cross the footbridge itself.
crowd loads on footbridges in Lagos
Figure 2: Crowd on a pedestrian bridge, at Ojota Lagos, Nigeria

The characteristic values of these load models should be used for both persistent and transient design situations.

Uniformly Distributed Loads on Footbridges

The crowd effect on the bridge is represented by a uniformly distributed load. When the risk of dense crowd exists or when specified for a particular project, Load Model 4 for road bridges should be considered also for footbridges. On the contrary, where the application of the aforesaid Load Model 4 is not required, a uniformly distributed load, to be applied to the unfavourable parts of the influence surface longitudinally and transversally, qfk should be defined in the National Annex.
The recommended value, depending on the loaded length L [m] is:

2.5 kN/m2 ≤ qfk = 2 + 120/(L + 30) ≤ 5.0 kN/m2 —— (1)

For road bridges supporting footways or cycle tracks, only the characteristic values (5 kN/m2) or the combination value (2.5 kN/m2) should be considered.

pedestrian load on a bridge
Figure 3: Characteristic load on a footway (or cycle track) of a road bridge

The minimum and maximum crowd load to be applied on bridges irrespective of the span length is therefore 2.5 kN/m2 and 5 kN/m2 respectively. To check the effect of span length on the value of the crowd load, equation (1) can be used. For instance, the crowd load on a pedestrian bridge of length 30 m is given by;

qfk = 2 + 120/(L + 30) = 2 + 120/(30 + 30) = 4 kN/m2

Concentrated load on Footbridges

For local effect assessment, a 10 kN concentrated load Qfwk, representing a maintenance load, should be considered on the bridge, acting on a square surface of sides 10 cm. When the service vehicle (see paragraph below) is taken into account, Qfwk should be disregarded. The concentrated load Qfwk should not be combined with any other variable non-traffic load.

Service/Accidental vehicle on Footbridges

When service vehicles for maintenance, emergencies (e.g. ambulance, fire), or other services must be considered, they should be assigned for the particular project. If no information is available and if no permanent obstacle prevents a vehicle from being driven onto the bridge deck, the special vehicle defined in the figure below should be considered. If consideration of the service vehicle is not requested, the vehicle shown in the figure below should be considered as accidental.

service or accidental vehicles on footbridges
Figure 4: Service or accidental vehicles on footbridges

Horizontal forces – characteristic values

A horizontal force Qflk acting along the bridge deck axis at the pavement level should be taken into account for footbridges only, whose characteristic value is equal to the greater of these two values:

– 10 per cent of the total load corresponding to the uniformly distributed load or
– 60 per cent of the total weight of the service vehicle, when relevant.

This horizontal force, which is normally sufficient to ensure the horizontal longitudinal stability of the footbridge, is assumed to act simultaneously with the corresponding vertical load, and in no case with the concentrated load Qfwk.

Groups of traffic loads on footbridges

Vertical loads and horizontal forces due to traffic should be combined, when relevant, taking into account the groups of loads defined in the table below (Table 5.1, EN 1991-2). Each of these groups of loads, which are mutually exclusive, should be considered as defining a characteristic action for combination with non – traffic loads.

group of load

As a rule, except for roofed bridges, where appropriate rules are defined in EN 1991-1-3, traffic loads on footbridges are considered not to act simultaneously with significant wind or snow. Wind and thermal actions should not be taken into account as simultaneous. When a combination of traffic loads together with actions specified in other Parts of EN 1991 must be considered, any group of loads in Table 5.1 of EN 1991-2 should be considered as one action.

Application of the load models

The traffic models described above with the exception of the service vehicle model, may also be used for pedestrian and cycle traffic on the areas of the deck of road bridges limited by parapets and not included in the carriageway, or on the footpaths of railway bridges. These actions are free, so that the models of vertical loads should be applied anywhere within the relevant areas in such a way that the most adverse effect is obtained.

Design of a Building Against Internal Explosion

According to section 5 of EN 1991-1-7:2006 (Eurocode 1 Part 7), explosions shall be taken into account in the design of buildings or civil engineering structures where gas is burned or regulated. This requirement also extends to buildings where materials such as explosive gases, or liquids forming explosive vapour or gas are stored or transported (e.g. chemical facilities, vessels, bunkers, sewage constructions, dwellings with gas installations, energy ducts, road and rail tunnels).

Explosion pressures on structural members should be determined taking into account, as appropriate, reactions transmitted to the structural members by non-structural members. The basic principle for design is that the structure shall be designed to resist progressive collapse resulting from an internal explosion, in accordance with EN 1990, 2.1 (4)P. In the design, the failure of some parts of the building may be permitted, but not the key structural members such as columns, slabs, beams, shear walls, etc.

Internal Gas Explosion in a Building

A gas explosion can be defined as a process where the combustion of a premixed gas-air cloud causes a rapid increase of pressure. For the proper functioning of a building, gas is required to supply energy for heating, cooking, and electricity generation. This implies the potential for an accidental explosion. For a gas explosion to occur in a building, the following succession of circumstances is required;

  1. A gas leakage or release occurs as a result of technical defects in gas installations (pipes, boilers, etc.), human errors during installation, repair, or maintenance of such installations, or in consequence of intentional manipulation.
  2. The released gas forms, with the oxygen present in the air, an inflammable gas-air cloud in compliance with certain physical requirements.
  3. A delayed ignition of the gas-air mixture through an ignition source (spark, hot surface, etc) occurs. If the ignition takes place immediately after the gas release, i.e. before an inflammable gas-oxygen cloud is being formed, a fire might occur, but the mixture will not explode.
gas explosion destroys part of a building in Russia
Figure 1: Gas explosion destroys part of a building in Russia

The pressure build-up during a gas explosion in the inside of a building is a consequence of combustion in a confined environment. The combustion process results in increased temperatures due to the transformation of chemically bound energy into heat. Thereby, the expansion of the combustion products, such as CO2 and vapour, will be limited due to confinement by the building closings such as walls and floors, which will cause the pressure to increase [1].

In a completely confined compartment, such as pipes or closed vessels in industrial installations, the maximum pressure generated during a gas explosion will depend primarily on the burning velocity (velocity of the flame front relative to the unburned gas immediately ahead of the flame). This velocity depends on the composition of the inflammable gas cloud, i.e. the gas type and the proportions of gas and air [1].

The highest pressures will arise if these proportions are such that there is no excess of fuel nor oxygen after the chemical reaction has been completed, what is referred to as the stoichiometric composition. For methane gas, for instance, which is the principal constituent of natural gas, the highest explosion pressures will arise for gas concentrations of about 10%. Below a methane gas concentration of 4%, and above 17%, no explosion will occur [1].

These so-called lower and upper flammability limits depend on the type of gas involved, the initial pressure (p0), and temperature (t0). The mentioned values for methane gas correspond to ambient conditions (t0 = 20º, p0 = 1 bar).

Simulated internal explosion pressure generation in a building
Figure 2: Simulated explosion pressure generation in a cubical, vented compartment [1]

The ignition of a hydrocarbon gas-air cloud in a fully confined compartment might entail explosion pressures up to approximately 8 bars (800 kN/m2). Gas explosion in buildings, however, do not cause pressures of this magnitude. The main reasons are imperfect mixing of the gas-air cloud and the fact that these explosions are only partly confined. Windows, doors, light partition walls, or unrestrained brick walls act as venting elements, which, in case of failure provide explosion pressure relief. The table below culled from [1] gives typical failure pressures of these elements.

ElementTypical failure pressure (kN/m2)
Glass windows2 – 7
Room doors2 – 3
Light partition walls2 – 5
Breeze block walls (50 mm)4 – 5
Unrestrained brick walls7 – 15

According to [2], key structural elements in a building should be designed to withstand the effects of an internal natural gas explosion, using a nominal equivalent static pressure, given by:

pd = 3 + pstat —— (1)
or
pd = 3 + 0.5pstat + 0.04/(Av/V)2 —— (2)

Whichever is greater.

Where;
pstat = uniformly distributed static pressure in kN/m2 at which venting components will fail,
Av is the area of venting components, and
V is the volume of the room.

This equation is found in Annex D of BS EN 1991-1-7:2004.

The venting components represent here the non-structural part of the enclosure (e.g. wall, floor, ceiling) with limited resistance that is intended to relieve the developing pressure from deflagration in order to reduce pressure on structural parts of the building. The explosive pressure acts effectively simultaneously on all of the bounding surfaces of the room. The expressions are valid for rooms up to a volume of 1000 m3 and venting areas over volume ratios of 0.05 m-1 ≤ Av/V ≤ 0.15 m-1.

An important issue is further raised in Clause 5.2 of EN 1991-1-7 [2]. It states that the peak pressures in the main text may be considered as having a load duration of 0.2 s. The point is that in reality, the peak will generally be larger, but the duration is shorter. So combining the loads from the above equations with a duration of 0.2 s seems to be a reasonable approximation.

For purpose of member design in the context of accidental actions, the Eurocode offers the following specific expression of the general formulation for design load combinations:

Ed = E(∑j≥1 Gk,j + P + Ad + (ψ1,1 or ψ2,1) ∙ Qk,1 + ∑i≥1 Ψ2,i ∙ Qk,i) —— (3)

Where:
Gk: Characteristic value of a permanent action
P: Representative value of a prestressing action
Ad: Design value of an accidental action
Qk: Characteristic value of a variable action
ψ1,1: Factor for the frequent value of a variable action
ψ2,1: Factor for the quasi-permanent value of a variable action

It should be noted that in comparison to the corresponding expression for persistent- or transient design situations no partial safety factors are to be applied to load effects within the accidental load combination. The design value of the accidental action is directly defined by means of a value Ad, which in practice often corresponds to a nominal value, such as in the case of gas explosions, where Ad is represented by a nominal, static equivalent pressure.

The reason for the use of nominal values is that a reliable statistical characterization of both occurrence and magnitude of accidental actions can only seldom be carried out because the available data is generally poor.

A Design Example of a Building for an Internal Explosion

Let us consider a kitchen on the first floor of a block of flats in Port Harcourt. The floor dimensions of the kitchen are 3 x 4 m while the storey height is 3m. The kitchen is characterised by a significant window and door opening of area 5 m2 (we are going to treat this as the venting area). Let us treat other walls in the kitchen as load-bearing.

This means that the volume V and the area of venting components Av for this case are given by:

Av = 5 m2
V = 3 × 4 × 3 = 36 m3

So the parameter Av/V can be calculated as:

Av/V = 5/36 = 0.138 m-1

As V is less than 1000 m3 and Av/V is well within the limits of 0.05 m-1 and 0.15 m-1 it is allowed to use the loads given in the code. The collapse pressure of the venting panels pstat is estimated as 4 kN/m2.

The equivalent static pressure for the internal natural gas explosion is given by:

pEd = 3 + pstat = 3 + 4 = 7 kN/m2
or
pEd = 3 + pstat/2 + 0.04/(Av/V)2 = 3 + (4/2) + 0.04/(0.138)2 = 7.1 kN/m2

Therefore, the design pressure should be taken as the highest, which in this case is 7.1 kN/m2

According to Eurocode EN 1990 (Basis of design), these pressures have to be combined with the self-weight of the structure and the quasi-permanent values of the variables loads. Let us consider the design consequences for the various structural elements.

Bottom floor
Let us start with the bottom floor of the kitchen. Let the self-weight of the floor and finishes be 4.95 kN/m2 and the imposed load 2 kN/m21 = 0.5 for considered category A). This means that the design load for the explosion is given by:

pEd = gk + Ad + ψ1qk = 4.95 + 7.1 + 0.5(2) = 13.05 kN/m2

The design for normal conditions is given by:
pEd = γGgk + γQqk = 1.35(4.95) + 1.5(2) = 9.68 kN/m2

According to [2], we should keep in mind that for accidental actions there is no need to use a partial factor on the resistance side. So for comparison, we could increase the design load for normal conditions by a factor of 1.2. The result could be conceived as the resistance of the structure against accidental actions, if it designed for normal loads only. Hence,

pRd = 1.2 x 9.68 = 11.616 kN/m2

Dynamic Increase in Load Bearing Capacity
It is now time to remember the clause in Annex B of Eurocode EN 1991-1-7. If we take into account the increase in short duration of the load we may increase the load-bearing capacity by a factor φd given by:

φd = 1 + √(gk/pRd) x √(2umax/g∆t2) —— (4)

Where;
gk = 4.95 kN/m2
pRd = 11.616 kN/m2
g = acceleration due to gravity = 9.81 m/s2
umax = 0.2 m (midspan deflection at collapse)
t = 0.2 seconds

φd = 1 + √(4.95/11.616) x √[(2 x 0.2)/(9.81 x 0.22)] = 1.652

pREd = φd pRd = 1.652 x 11.616 = 19.189 kN/m2 > 13.05 kN/m2

Therefore under the design condition, the bottom slab can be said to be fulfilling the design requirements.

Upper floor
Let us next consider the upper floor. Note that the upper floor for one explosion could be the bottom floor for the next one. The design load for the explosion, in that case, is given by (upward value positive!):

pEd = gk + Ad + ψ1qk = = – 4.95 + 7.1 + 0 = 2.15 kN/m2

So the load is small, but will give larger problems anyway. The point is that the load is in the opposite direction of the normal dead and live load. This means that the normal resistance may simply be close to zero. What we need is top reinforcement in the field and bottom reinforcement above the supports. So it will be normal to reinforce the floor slab top and bottom.

An important additional point to consider is the reaction force at the support. Note that the floor could be lifted from its supports, especially in the upper two stories of the building where the normal forces in the walls are small. In this respect, edge walls are even more vulnerable. The uplifting may change the static system for one thing and lead to different load effects, but it may also lead to freestanding walls. If the floor to wall connection can resist the lift force, one should make sure that the also the wall itself is designed for it.

Design of the walls/columns
Depending on the support condition of the walls/columns, the design pressure should be applied as a lateral load to the columns/walls, and the maximum bending moment determined. This should be combined with the axial force in the column/wall to determine the appropriate reinforcement.

References
[1] Hingorani R. (2017): Acceptable life safety risks associated with the effects of gas explosions on reinforced concrete structures. PhD thesis submitted to the Department of Civil Engineering, UNIVERSIDAD POLITÉCNICA DE MADRID
[2] Vrouwenvelder T., Diamantidid D. (2009): Accidental Actions (Chapter 5) in Load Effects on Buildings (Milan Hilicky et al Eds). CTU in Prague, Klokner Institute


The 2018 Earthquake Induced Flow-Slide in Jono Oge Sulawesi, Indonesia

On September 28, 2018, a large earthquake of magnitude (Mw) 7.5 struck Sulawesi Island, Indonesia. A major cause of large fatalities from this event (more than 1,300 people missing who may be still buried under the mudflows) was large-scale mass movements of soil at Petobo, Balaroa, and Jono Oge regions [1]. Generally, the capital city of Palu of Central Sulawesi Province was devastated by cascading geological hazards – strong shaking due to the mainshock, triggered tsunamis, and large scale soil movement (flow-slide).

Sulawesi Island is located within a triple junction of the Australian, Philippine, and Sunda Plates, and is heavily affected by the complex interaction of their movements. The earthquake occurred along the Palu-Koro Fault, which is known to be active and is influenced by the complex tectonic interaction of major subducting plates. The Palu-Koro fault is said to accommodate a deformation of about 40 mm/year, and has caused several devastating earthquakes in the past [1, 2].

According to researchers from Japan and Indonesia [2], the provinces of Balaroa, Petobo, Jono-Oge and Sibalaya were the worst hit in the 2018 earthquake mainly due to large-scale flow-slides and mudflows. Never before have such large-scale flow failures been triggered by an earthquake. That these failures occurred on very gentle sloping ground, sweeping away localities along with it, came as a complete surprise to one and all. The flow-slide in Jono Oge was deemed the largest in the region.

OVERVIEW OF LONG DISTANCE FLOW SLIDE
Figure 1: Overview of long distance flow-slide [2]

According to [2], the damaged area of long-distance flow-slide in Jono Oge is about 210 ha, located on the east side of Palu Valley, about 4 km south of Petobo. It is reported that a total of 500 houses were damaged. The catchment area of the affected area is estimated at 4 km2. The flow-slide occurred at the bottom of the alluvial fan created at the valley mouth where the discharged water was not observed during the survey.

The combination of many factors such as liquefaction of the sandy layer and the formation of water film due to the existence of a less-permeable cap layer, the presence of a confined aquifer, and the geology of the area are thought to have led to the flow-slide. According to an eye witness report from a person living in the area, sand ejecta was seen during and after the earthquake. Evidence of sand ejecta which suggests liquefaction was also observed in the area after the earthquake [3].

According to the article, in Jono Oge, a survivor was shooting a video while being flowed, which is currently available on Youtube, (see link below).

Researchers from Japan and Indonesia [3] used a combination of satellite imagery, aerial imagery, field surveys including collecting soil samples from the sites and conducting in-situ testing using Portable Cone Penetrometer, to investigate the mechanism of massive flow-slides. The paper was published in Elsevier – Soils and Foundations.

From the research, it was concluded that all major flow-slides in the Palu valley occurred at locations where a new alluvial fan meets an old alluvial fan based on the geological features of the area.

Furthermore, the presence of low permeable layers (silt and clay) over loosely deposited sandy and sandy gravel layers suggests the complex mechanism of the long-distance flow-slide at Jono-Oge can be explained by the ‘interlayer water film theory’.

Previous researches have revealed that liquefaction at a site with sandwiched lithology results in the liquified soil being trapped below the low permeability cap layer. This creates a thin interlayer of water, referred to as a ‘‘water film‘. The resulting inhibition of excess pore water pressure dissipation and presence of the water-film reduces the residual shear strength of the sandy soil layer to below the initial static shear stress. Consequently, even on a very gentle slope, lateral flow takes place due to the action of gravitational force until equilibrium is achieved.

It is further assumed by the researchers that damage to the underlying artesian aquifer during the earthquake may also have contributed to the development of the water film and the liquefaction induced flow-slide in the layers with very low mobilized shear resistance. The researchers however admitted the mechanism of the long-distance flow-slide is not yet fully understood.

Disclaimer
Every piece of information provided in this article is from the open access research work of the authors/publishers cited. They are not owned by www.structville.com. Open access articles are under the CC BY-NC-ND license. See (http://creativecommons.org/licenses/by-nc-nd/4.0/) for information on open access articles.

References

[1] Goda K., Mori N., Yasuda T., Prasetyo A., Muhammad A. and Tsujio D. (2019): Cascading Geological Hazards and Risks of the 2018 Sulawesi Indonesia Earthquake and Sensitivity Analysis of Tsunami Inundation Simulations. Front. Earth Sci. 7:261. doi: https://doi.org/10.3389/feart.2019.0026

[2] Kiyota T., Furuichi H., Hidayat R. F., Tada N., Nawir H. (2020): Overview of long-distance flow-slide caused by the 2018 Sulawesi earthquake, Indonesia. Soils and Foundations, 60(3):722-735 https://doi.org/10.1016/j.sandf.2020.03.015

[3] Hazarika H., Rohit D., Pasha S. M. K., Maeda T., Masyhur I., Arsyad A., Nurdin S. (2020): Large distance flow-slide at Jono-Oge due to the 2018 Sulawesi Earthquake, Indonesia. Soils and Foundations, ISSN 0038-0806, https://doi.org/10.1016/j.sandf.2020.10.007


.

Analysis of Laterally Loaded Piles

Piles are used for resisting vertical and lateral loads that are transmitted to the substructure of buildings. Structures such as tall chimneys, highrise buildings, towers, offshore structures, tall retaining structures, wharfs and jetties, etc are normally subjected to high lateral loads, which are subsequently transferred to the foundations supporting them as lateral shears. If the lateral loads are too high, inclined or batter piles can be used to aid vertical piles for lateral load resistance (Murthy, 2012). The analysis of laterally loaded piles to determine the ground deflection, bending moment, shears, load-carrying capacity, etc is therefore very important for the purpose of design.

batter piles in a marine structure
Figure 1: Inclined concrete piles in a marine facility

Numerous researchers have worked on the experimental and theoretical solution to the problem of laterally loaded piles. Reese et al (1974) and Matlock (1970) developed the concept of p-y curves for solving laterally loaded pile problems. The method is quite popular in the United States of America. However, the p-y curve method has been reported to not predict pile response properly (Kim et al. 2004, Anderson et al. 2003).

Model of laterally loaded piles
Figure 2: Model of laterally loaded pile: (a) elevation view; (b) as elastic line; (c) p-y curves, Reese (1997)

According to Basu et al (2008), the failure of p-y curves to predict pile response properly is not surprising because the p-y curves, which describe the resistive properties of soil as a function of pile deflection, used in the p-y analysis are developed empirically by back-fitting the results of numerical analysis to match the actual field pile-load test results. Thus, p-y curves developed for a particular site are not applicable to other sites. In order to obtain an accurate prediction of lateral pile response by the p-y method, p-y curves must be developed through pile load tests for every site – an uneconomical alternative.

The problem of laterally loaded piles is closely related to the problem of beam on elastic foundation. While a beam on an elastic foundation can be loaded at any point along its length, the external loads on a pile are likely to be on or above the ground surface.

Most of the numerical solutions for laterally loaded piles involves the concept of modulus of subgrade reaction. This is based on Winkler’s assumption that a soil medium may be approximated by a series of closely spaced independent elastic springs (Murthy, 2012). It has been shown that the error inherent in Winkler’s hypothesis is not significant. Therefore in laterally loaded piles, a series of non-linear springs can be used to represent the force-deformation characteristics of the soil.

The key to the solution of laterally loaded piles problem, therefore, lies in the determination of the modulus of subgrade reaction with respect to depth along the pile. The soil reaction p at any point along the pile length x may be expressed as;

p = -Esy —— (1)

where y is the deflection at point x, and Es is the soil modulus.

The relationship between the soil resistance per unit length (p) and deflection (y) is strongly non-linear. Therefore, Es is not constant but changes with the deflection of the pile. There are many factors that influence the value of Es such as the pile width, the flexural stiffness, the magnitude of the applied load, and the soil properties.

The variation of Es with depth for any prticular load level may be expressed as;

Es = nhx —— (2)

Where nh is the coefficient of soil modulus variation. The variation of nh with relative density Dr of sand is given in the Figure below;

variation of modulus of elasticity with relative density
Figure 3: Variation of nh with relative density Dr (Reese, 1974)

Matlock and Reese (1960) provided a non-dimensional solution for the determination of deflection, slope, moment, shear, and soil reaction any point x along the pile. The equations are as follows;

Deflection (y) = [PtT3/EI]Ay + [MtT2/EI]By —— (3)
Slope (s) = [PtT2/EI]As + [MtT/EI]Bs —— (4)
Moment (M) = [PtT]Am + [Mt]Bm —— (5)
Shear (V) = [Pt]Av + [Mt/T]Bv —— (6)
Soil reaction (p) = [Pt/T]Ap + [Mt/T2]Bp —— (7)

Where T is the relative stiffness factor expressed as;

T = [EI/nh]0.2 —— (8)

A and B are sets of non-dimensional coefficients that can be picked from Table (see Table 16.2, Murthy, 2012). The coefficients are given as functions of the depth coefficient Z expressed as;

Z = x/T —— (9)

For free headed piles at the ground level, the deflection and slope are as given below;

Deflection yg = 2.43(PtT3)/EI + 1.62(MtT2/EI) —— (10)
Slope Sg = 1.62(PtT2)/EI + 1.75(MtT/EI) —— (11)

For fixed head piles;

yg = 0.93(PtT3)/EI —— (12)

The bending moment at ground level for fixed head is;

Mt = -0.93[PtT] —— (13)

RAKER H PILES
Figure 4: Driving of inclined H-steel piles

Brom’s Solution for Laterally Loaded Piles

Broms’ (1964a, 1964b) developed solutions for determining lateral deflections at ground level at working loads and ultimate lateral resistance of piles under lateral load using the concept of subgrade reaction. He developed solutions for long and short piles installed in cohesive and cohesionless soils in the form of charts.

Furthermore, laterally loaded piles are usually analysed depending on whether the head is free to rotate or fixed. The head of a pile may be considered as fixed when the stiff pile cap is tied using connecting beams.

Ultimate Lateral Resistance of Piles In Saturated Clays
The ultimate soil resistance of piles in cohesive soils increases with depth from 2cu (cu is the undrained shear strength) to 8 to 12cu at a depth of 3 times the pile diameter (3d) from the ground surface. However, Broms suggested a constant value of 9cu to be used as the ultimate soil resistance below a depth of 1.5d.

short pile in cohesive soil
Figure 5: Ultimate lateral load of short pile in cohesive soil (Broms, 1964a)
Long pile in cohesive soil
Figure 6: Ultimate lateral load of long pile in cohesive soil (Broms, 1964a)

The solution for long piles involves the moment capacity of the pile section which should be calculated accordingly. A free-headed pile is considered long when βL > 2.5 and short when βL < 2.5. For a fixed-headed pile, a pile is long when βL > 1.5 and short when βL < 1.5.

β = (kd/4EI)0.25 —— (14)

Where;
EI = stiffness of the pile
k = coefficient of horizontal subgrade reaction
d = width or diameter of pile
L = Length of pile

Ultimate Lateral Resistance of Piles in Cohesionless Soil
The ultimate lateral resistance of long and short piles embedded in cohesionless soils can be estimated from the chart below. For short piles, the dimensionless quantity Pu/γd3Kp is plotted against the L/d ratio while in long piles, Pu/γd3Kp is plotted against My/γd4Kp.

Where;
γ = the effective unit weight of the soil
Kp =Rankine’s passive earth pressure coefficient
My = Ulitimate moment capacity of the section

short pile in cohesionless soil
Figure 7: Ultimate lateral load of short pile in cohesionless soil (Broms, 1964b)
laterally long pile in cohesionless soil
Figure 8: Ultimate lateral load of long pile in cohesionless soil (Broms, 1964b)

Solved Example

A reinforced concrete square pile of dimensions 450 x 450 mm is driven to a depth of 20m in medium dense sand. The sand is in a saturated state. A lateral load of 250 kN is applied to the pile at 1 m at the ground level. Calculate the following;

(a) Lateral deflection of the pile at the ground level when the head is free (Use Matock and Reese Method)
(b) Lateral deflection of the pile at the ground level when the head is restrained (Use Matock and Reese Method)
(c) Ultimate lateral resistance of the pile (Using Brom’s method)

(nh = 15000 kN/m2/m; fcu = 40 N/mm2; Asprov = 12Y20 (3768 mm2); φ = 35o; Mu = 445 kNm; Submerged unit weight of soil = 8.75 kN/m3)

Solution
Ignoring the reinforcements, the flexural rigidity of the pile can be calculated;
fcu = 40 N/mm2
Ec = 20 + 0.2fcu = 20 + 0.2(40) = 28 kN/mm2 = 2.8 × 10⁷ kN/m2
I = bh3/12 = (0.45 × 0.453)/12 = 3.417 × 10⁻³ m4

Hence;
EcI = (2.8 × 107) × (3.417 × 10-3) = 95676 kNm2

T = (EI/nh)0.2 = (95676/15000)0.2 = 1.448 m

(a) Lateral deflection at the ground when the head is free
Using Matlock and Reese method
yg = 2.43(PtT3)/EI + 1.62(MtT3/EI)

Pt = 250 kN (given)
Mt = (250 × 1m) = 250 kNm

yg = 2.43(250 × 1.4483)/95676 + 1.62(250 × 1.4482)/95676 = 0.0192 + 0.008875 = 0.028 m = 28 mm

Extra
Using Brom’s method;
η = (nh/EI)0.2 = (15000/95676)0.2 = 0.69
ηL = 0.69 × 20 = 13.8

chart for lateral deflection
Figure 9: Chart for deflection of laterally loaded piles in coheiosnless soild (Broms, 1964b)


Reading from chart for ηL = 13.8; e/L = 1/20 = 0.05
[yg(EI)3/5(nh)2/5]/PtL = 0.2

Therefore yg = 0.2PtL/(EI)3/5(nh)2/5 = (0.2 × 250 × 20)/(956763/5 × 150002/5) = 0.0219 mm = 21.9 mm

When analysed on Staad Pro, a lateral deflection of 24.07 mm was obtained as shown in Figure 10;

staad pro model
Figure 10: Staad Pro numerical modelling results

(b) Lateral deflection when the head is restrained
Using Matlock and Reece method
yg = 0.93(PtT3)/EI = 0.93(250 × 1.4483)/95676 = 0.007377 = 7.38 mm

Extra
Using Brom’s method;
[yg(EI)3/5(nh)2/5]/PtL = 0 (when the head is restrained)
Hence the lateral deflection can be taken as zero.

(c) Lateral load resistance of the pile
Coefficient of pasive pressure Kp = (1 + sinφ)/(1 – sinφ) = (1 + sin35)/(1 – sin35) = 3.69
Ultimate moment of resistance of section = 445 kNm
γ = 8.75 kN/m3
d = 0.45 m

Hence, the non-dimensional yield moment = M/γd4Kp = 445/(8.75 × 0.454 × 3.69) = 336
For e/d = 1000/450 = 2.22

Reading from chart;
Pu/γd3Kp = 60 (for free-head condition)
Pu/γd3Kp = 80 (for fixed head condition)

Therefore,
Pu,free = 70γd3Kp = 60 × 8.75 × 0.453 × 3.69 = 176.5 kN
Pu,fixed = 70γd3Kp = 80 × 8.75 × 0.453 × 3.69 = 235 kN

Therefore, the pile section provided is inadequate for the service lateral load coming to the substructure. The pile section will have to be changed.

References
Anderson, J. B., Townsend, F. C. & Grajales, B. (2003): Case history evaluation of laterally loaded piles. J. Geotech. Geoenv. Engng., Am. Soc. Civ. Engrs. 129, No. 3, 187-196.

Basu D., Salgado R., Prezzi M. (2008): Analysis of Laterally Loaded Piles in Multilayered Soil Deposits. Publication FHWA/IN/JTRP-2007/23. Joint Transportation Research Program, Indiana Department of Transportation and Purdue University, West Lafayette, Indiana, 2008. doi: 10.5703/1288284313454

Broms B.B. (1964a): Lateral Resistance of Piles in Cohesive Soils. Journal of the Soil Mechanics and Foundations Division, 1964, Vol. 90, Issue 2, 27-6

Broms B.B. (1964b): Lateral Resistance of Piles in Cohesionless Soils. Journal of the Soil Mechanics and Foundations Division, 1964, Vol. 90, Issue 3, 123-156

Kim, T. K., Kim, N-K, Lee, W. J. & Kim, Y. S. (2004). Experimental load-transfer curves of laterally loaded piles in Nak-Dong river sand. J. Geotech. Geoenv. Engng., Am. Soc. Civ. Engrs. 130, No. 4, 416-425.

Matlock H. (1970): Correlations for Design of Laterally Loaded Piles in Soft Clay. Proceedings to the 2nd Offshore Technology Conference, Houston Texas, Vol 1

Murthy V.N.S. (2012): Soil Mechanics and Foundation Engineering. CBS Publishers and Distributors Pvt. Ltd, New Delhi, India

Reese, L.C. (1997): Analysis of laterally loaded piles in weak rock. J. Geotech. Geoenviron. Eng. 123 (11), 1010–1017

Reese, L.C., Cox, W.R., Koop, F.D.: Field testing and analysis of laterally loaded piles in stiff clay (1974): In Proceedings of the 6th Annual Offshore Technology Conference, pp. 672–690. Houston, Texas, 2(OTC 2312)


Design of Braced Cuts in Excavations

In the construction of any substructure below the ground surface, excavations must be made to the recommended depth before the construction can begin. In the circumstances where deep vertical cuts (say about 3m) are to be made in a soil, provision must be made for the support of the soil to stop it from caving in or collapsing. The design of braced cuts involves the evaluation of the stresses in the members (bracings) used for supporting the cut, and provision of adequate members sizes or sections to avoid structural failure. These are usually classified as temporary works in construction.

Most shallow foundations in cohesive-frictional soils may not need side supports to keep the cut stable. Furthermore, when there is enough space, the sides of the excavation may be sloped, thereby eliminating the need for bracings or support. However, when a vertical excavation exceeds 3m depth, the most common practice is to drive vertical timber planks called sheeting along the sides of the excavation. Horizontal beams called wales are used to hold the sheeting in place, while struts running from side to side of the excavation is used to hold the wales in place.

For deeper cuts of about 5-6m, the use of timber sheeting may become uneconomical and steel sheet pile walls may be used (see figure below). Sheet piles are convenient to use because of their high resistance to stresses. On the other hand, they are relatively lightweight and reuseable when compared with timber.

design of braced cut for excavation
Typical construction of a braced cut using sheet pile walls

The sheet piles are driven around the boundary of the excavation. As the soil is removed from the enclosure, the wales and struts are inserted. The process continues until the excavation is complete. When the width of the excavation is too wide to permit the economical use of struts across the excavation, tiebacks may be used as shown below.

retaining wall tie back
Typical schematic representation of tieback

Lateral Earth Pressure Distribution in Braced Cuts

To design braced excavations (that is to select the wales, struts, sheet piles etc), the engineer must estimate the lateral pressure that the braced cut will be subjected to. The lateral earth pressure distribution of braced cuts is different from that of conventional retaining walls. This is because the deformation of braced cut walls gradually increases with the depth of the excavation. The deformation is influenced by factors such as type of soil, type of equipment used, depth of excavation, and workmanship.

Due to very little wall yielding at the top of the excavation, the pressure will be very close to at rest at the top. At the bottom of the wall with greater yielding, the lateral earth pressure will be lower than the Rankine active earth pressure. As a result of this, the earth pressure distribution of braced cuts varies significantly with that of retaining walls.

difference between the yielding of a retaining wall and a braced cut
Deformation behaviour of braced cuts and retaining walls

Peck in 1969 presented the pressure distribution diagram of braced cuts. The diagrams were developed from observations and studies obtained from the strut load of Berlin subway cut, Munich subway cut, and New York subway cut. He described the pressure as apparent pressure envelopes which represents the fictitious pressure distributions for estimating the strut loads in a braced cut.

pressure distribution diagram in cuts
Apparent pressure distribution in braced cuts

(a) For cuts in sand
The lateral pressure for cuts in sand is given by;

σ = 0.65γHKa

Where;
γ = Soil unit weight
H = Height of the cut
Ka = Rankine’s active earth pressure

(b) For cuts in soft-medium clay (γH/c > 4)

The lateral pressure is the larger of;

σ = γH[1 – (4c/γH)] or σ = 0.3γH

(c) For cuts in stiff clay (γH/c ≤ 4)

σ = 0.2γH to 0.4γH (average of 0.3γH)

Where c is the undrained cohesion of the soil.

When using the pressure envelops in design, it is very important to keep the following in mind;

  1. The pressure envelope is sometimes referred to as the apparent pressure envelope. The actual pressure distribution depends on the construction sequence and the flexibility of the wall.
  2. The water table is below the bottom of the cut
  3. Sand is assumed to be drained with no pore water pressure
  4. Clay is assumed to be undrained, and pore water pressure is not considered
  5. The excavation depth is greater than about 6 m

Design of the various components of a braced cut

Struts
Struts in braced cuts behave like horizontal columns. Hence, the load-carrying capacity depends on the slenderness ratio and flexural buckling capacity. During construction, it is recommended that struts should have a minimum vertical spacing of 3m. In clay soils, the depth of the first strut below the ground surface should be less than the depth of the tensile crack.

To determine the load in the strut, the following procedure can be used;

  1. Draw the pressure envelope of the braced cut and show the strut levels. Assume that the sheet pile walls are hinged at the strut levels except for the top and bottom ones.
  2. Determine the support reaction of the cantilever (for the top and bottom struts), and use simply supported assumption to determine the intermediate struts
  3. Sum up the reactions to determine the load in each strut
  4. Provide and appropriate section for the strut using a suitable design code

Sheet Piles
The following steps may be taken in the design of a sheet pile wall;

  1. For each of the section (in plan), determine the maximum bending moment
  2. Pick the highest value of the maximum bending moments (in kNm/m)
  3. Obtain the required section modulus of the sheet pile wall Sx = Mmax/Allowable stress of the sheet pile material
  4. Choose a sheet pile section with a slightly higher section modulus

Wales
Wales may be treated as continuous horizontal members if they are properly spliced. Conservatively, they can be assumed to be pinned at the struts.

Design of Braced Cuts – Solved Example

A long trench is excavated in a medium dense sand for the basement of a highrise building. The excavation is supported with sheet pile walls held in place by struts and wales as shown in the figure below. The struts are spaced 4m c/c in plan.

braced cut design

Determine;

(a) The pressure envelope on the wall
(b) The loads in the struts
(c) The maximum moment for determining an appropriate section for the sheet piles
(d) The maximum moment for determining the section for the wales

Solution
(a) The pressure envelope on the wall
For a braced cut in sand, the apparent pressure envelope is given by;

σ = 0.65γHKa
Ka = (1 – sin30)/(1 + sin 30) = 0.333
σ = 0.65 × 18 × 8.5 × 0.333 = 33.11 kN/m2

PRESSURE ENVELOPE


(b) Calculation of the strut load
Since the struts are spaced at 4m c/c in plan, the UDL = 33.11 × 4 = 132.44 kN/m

Section A – B
Taking moment about A;
3VB1 – (33.11 × 32)/2 + (33.11 × 1.52)/2 = 0
VB1 = 111.746/3 = 37.248 kN/m

Taking moment about B;
3VA – (33.11 × 4.52)/2 = 0
VA = 335.238/3 = 111.746 kN/m

Section B – C
Taking moment about C;
3VB2 – (33.11 × 32)/2 + (33.11 × 1.02)/2 = 0
VB2 = 132.44/3 = 44.146 kN/m

Taking moment about B;
3VC – (33.11 × 42)/2 = 0
VC = 264.88/3 = 88.293 kN/m

The shear force diagrams of the different sections are shown below;

A B
B C

In summary the strut loads are as follows;
VA = 111.746 kN/m × 4m = 446.985 kN
VB = VB1 + VB2 = 37.248 kN/m + 44.146 kN/m = 81.394 kN/m × 4m = 325.576 kN
VC = 88.293 kN/m × 4m = 353.173 kN

When the loads are factored, the struts can be designed as axially loaded steel columns.

(c) Bending moment on the sheet pile walls
By looking at the shear force diagram, we can confirm that the maximum moment will occur at the cantilever regions and at the points of contraflexure for shear.

For section A-B, the point of contraflexure of the shear force diagram can be obtained using similar triangle;

62.081 = (3 – x)
37.248 = x

On solving, x = 1.125 m from point B

Similarly for section B-C;

55.183 = (3 – x)
44.146 = x

On solving, x = 1.333 m from point B

Hence;
MA = (33.11 × 1.52)/2 = 37.25 kNm/m
MC = (33.11 × 1.02)/2 = 16.55 kNm/m
MA-B,max = (37.248 × 1.125) – (33.11 × 1.1252)/2 = 20.951 kNm/m
MB-C,max = (44.146 × 1.333) – (33.11 × 1.3332)/2 = 29.43 kNm/m

The maximum moment for the section is 37.25 kNm/m and should be used for the design of the sheet pile wall when factored.

(d) Design moment of the wales
We can use the maximum strut load to design the wale.

Mmax = PL2/8

Where L is the spacing of the strut in plan
Mmax = (111.746 x 42)/8 = 223.492 kNm/m
The design can be carried out accordingly.

Special considerations should be given to braced cuts in layered soils (kindly refer to standard geotechnical engineering textbooks). Furthermore, heave at the bottom of braced cuts in clay soils should also be considered where applicable.


Quantity Estimation Guide for Construction Sites

Site managers are saddled with the responsibility of making material requisition and ensuring that construction progresses without too many glitches. One of the major causes of delay in construction is the unavailability of materials on site. Therefore a site engineer is expected to have very quick tips on how to estimate the quantity of materials required to execute a given item of work.

In this article, we are going to provide a basic quantity estimate guide for common construction materials that are used on site. The list is not exhaustive and will be updated from time to time.

(a) Quantity Estimation Guide for Concrete Works

The materials that are required for the production of normal weight concrete are cement, sand, coarse aggregates, and water. For normal strength concrete, the quantity of cement varies with the concrete grade, while the quantity of sand and coarse aggregate remains approximately constant. To estimate the quantity of materials required for concrete works, the first step is to calculate the volume of concrete required for the job.

For slabs; the volume of concrete required (m3) = Area of the floor slab (m2) × thickness of slab (m)
For beams; the volume of concrete required (m3) = Depth of beam (m) × width of beam (m) × length of the beam (m)
For columns; the volume of concrete required (m3) = length of column (m) × width of column (m) × height of column (m)

For instance, for a (230 x 230)mm column in a duplex, the volume of concrete required is 0.16 m3 (i.e 0.23 m × 0.23 m × 3m = 0.16 m3) assuming that the storey height is 3 m. This volume can be multiplied by the number of columns in the building to obtain the total volume of concrete required for casting all the columns in the building.

After obtaining the volume of concrete required, the quantity of materials required for the production of one cubic metre of concrete can be estimated as follows;

(i) 7 bags (350 kg) of cement is required to produce one cubic metre (1m3) of grade 25 concrete
(ii) 1200 kg (1.2 tonnes) of sand is required to produce one cubic metre (1m3) of grade 25 concrete
(iii) 1400 kg (1.4 tonnes) of granite is required to produce one cubic metre (1m3) of grade 25 concrete
(iv) 175 – 210 litres of water is required to produce one cubic metre (1m3) of grade 25 concrete

The quantities listed above require no additional allowance for waste.

Read Also…
How to price concrete works in Nigeria

(b) Quantity Estimation Guide for Reinforcement Works

reinforcement works

The quantity of reinforcements required can vary considerably depending on the structural design output of the structure. Therefore, it is important to refer to the reinforcement detailing and bar bending schedule for quantity estimation. It is also important to note that the bar bending schedule issued by structural engineers does not take into account offcuts and wastage. It is therefore, important to consider the propriety of bar bending schedule for construction purposes. More often than not, contractors prepare their own bar bending schedule (taking offcuts into account) before placing an order.

Reinforcements are usually quantified by weight (kg or tonnes), which can be converted to length (reinforcements are usually supplied per 12 m length). The unit weight of different sizes of reinforcements are as follows;

Diameter of bar (mm)81012162025
Unit weight (kg/m)0.3950.6160.8881.5792.4663.854

Reinforcement Quantity Estimation in the Floor Slab of a Duplex

In a floor slab of about 4-5 bedrooms duplex (200 – 250 m2 of floor slab area), the reinforcement requirement is about 2.5 – 4.0 tonnes of Y12 mm (main reinforcements) and 0.3 to 0.6 tonnes of Y10 mm as distribution bars. The exact quantity is determined from the design drawings.

In the absence of design drawings and an idea is needed about the probable cost of reinforcement for a floor slab, the following relationship can be used for slabs of moderate span;

  • 12.5 kg of Y12mm bottom reinforcement is needed per square metre (1 m2) of slab
  • 20% to 30% of the weight of Y12mm (in kg) provided at the bottom is needed at the top (hogging areas)
  • 10% to 15% of the weight of Y12mm (in kg) provided at the bottom is needed as Y10mm (distribution bar of hogging reinforcements)
  • About 12 kg of binding wire is required to tie 1 tonne of reinforcement

Example
Estimate the quantity of reinforcement needed to construct a 250 m2 of moderately spanned floor slab in a duplex.

Solution
Quantity of bottom reinforcement required = 12.5 kg × 250 = 3125 kg = 3.125 tonnes of Y12 mm
Quantity of top reinforcement required (using 25% of bottom reinforcement) = 0.25 × 3125 = 781 kg = 0.781 tonnes of Y12 mm
Quantity of distribution bars required (using 12% of bottom reinforcement) = 0.12 × 3125 = 375 kg = 0.375 tonnes of Y10 mm
The total quantity of reinforcement required = 4.281 tonnes
Quantity of binding wire required = 12 × 4.281 = 52 kg

Note that this quantity can considerably vary based on the design result. Therefore, the quantity presented here is just a rough idea, and the reinforcements are assumed to be spaced at 150 – 175 mm c/c. This may however be an uneconomical design, but we need a rough idea of the cost, right? When the reinforcement is spaced at 200 mm c/c, 10.7 kg per square metre can be assumed for the bottom reinforcements.

Reinforcement Quantity Estimation in the Beams of a Duplex

In the absence of design results, the quantity of reinforcement required in beams of moderate spans (say equal to or less than 4m) in a duplex can be estimated as follows;

  • 7.9 – 9.5 kg of Y16mm per linear metre of a beam
  • 2.5 kg of Y8mm per linear metre of a beam as links/stirrups
  • 3.55 kg of Y12 mm per linear metre of a lintel
  • 2.5 kg of Y8mm per linear metre of a lintel as links/stirrups

Please note that the quantity stated above is not guaranteed to satisfy structural requirements. Consult a structural engineer for this purpose.

Example
Estimate the quantity of floor beam reinforcement required in a moderate duplex if the total length of all the floor beams in the building is 130 m.

Solution
Quantity of Y16 mm bars required = 9.5 × 130 = 1235 kg = 1.235 tonnes of Y16 mm
Quantity of links reinforcement required = 2.5 × 130 = 325 kg = 0.325 tonnes of Y8 mm

Reinforcement Quantity Estimation in the Columns of a Duplex

In the absence of design results, the following can be used to estimate the quantity of reinforcement in columns of 230 x 230 mm dimensions in a duplex (one suspended floor only).

  • 25 kg of Y16mm per 3m high column
  • 5.33 kg of Y8mm per 3m column as links/stirrups

Note that this quantity can considerably vary based on the design result.

Example
Estimate the quantity of reinforcement required to construct 25 number of 230 x 230 columns in the ground floor of a duplex. All spans in the building are moderate.

Solution
Quantity of Y16mm required = 25 × 25 = 625 kg (0.625 tonnes of Y16 mm)
Quantity of Y8mm required = 25 × 5.33 = 133.25 (0.133 tonnes of Y8 mm)

(c) Quantity Estimation Guide for Blockwork

block work

The following quantity estimation guide can be used for the estimation of the block work in a building;

  • 10 blocks are required to lay one square metre (1m2) of block wall
  • 1 bag of cement is required to lay 50 blocks (9 inches block)
  • 320 kg of sharp sand is required to lay 50 blocks (9 inches block)

(d) Quantity Estimation Guide for Plastering

For a 12 mm thick 1:4 mix ratio of plastering work, the following relationship applies;

  • The volume of plastering mortar required per square metre (1 m2) of wall = 0.012 m3
  • 4.7 kg of cement is required to plaster one square metre (1 m2) of wall
  • 20.7 kg of plaster sand is required to plaster one square metre (1 m2) of wall

From the on going, we can say that 1 bag of cement can plaster approximately 10 m2 of wall.

(e) Quantity Estimation Guide for Formwork

For the soffit formwork of a slab;

  • 12 pieces of 1″ x 12″ x 12′ plank formwork is required to cover an area of ten square metres (10 m2)
  • 4 pieces of marine board (1.2 m x 2.4m) is required to cover an area of ten square metres (10 m2)
    1 piece of 2″ x 3″ x 12′ softwood is required per square meter (1 m2) of slab

(f) Miscellaneous

The weight of one bag of cement is 50 kg
The volume of one bag of cement = 0.034 m3
The volume of a standard builder’s wheelbarrow = 0.065 m3
The volume of one standard head pan is = 0.0175 m3

These quantities are true when the headpan/wheelbarrow is unheaped

We normally assume the following on site;

  • One bag of cement = 2 head pans
  • 1 wheelbarrow = 4 headpans