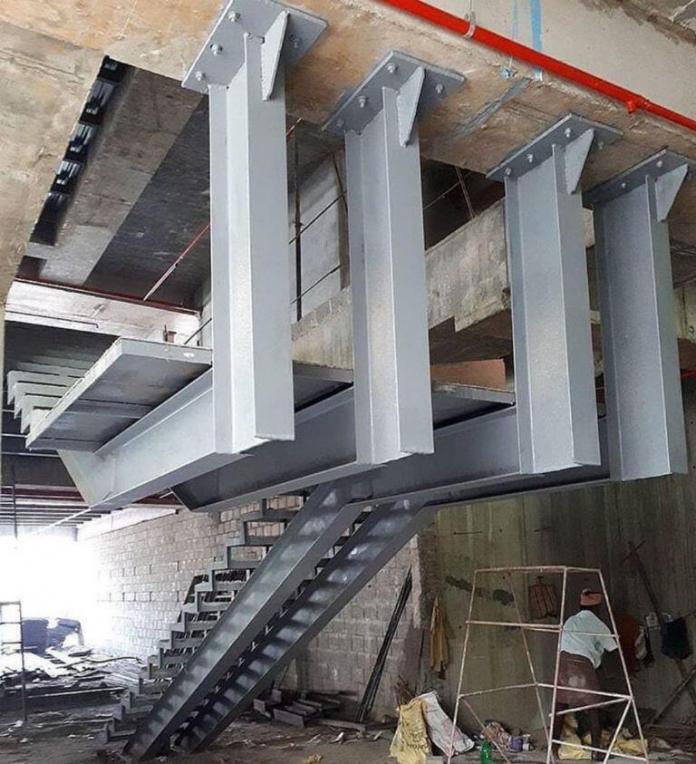
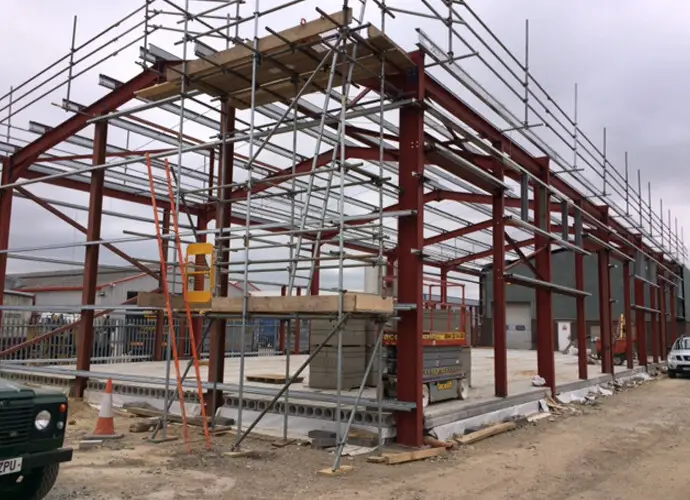
I stumbled across this steel staircase construction (most probably for an industrial building), and I was intrigued. The massive size of the sections are thought provoking, and the connections look quite interesting.
I will like us to discuss this design and construction by considering the connections, members, details, applicability, and how it could have been improved. Also can you redesign the staircase by assuming a distributed ultimate load of 20 kpa. Assume a floor height of 4m, and verify if the section was overdesigned or not. Thank you as you air your thoughts and design results.
Rugged Steel Staircase Construction – What are your thoughts on this?
Transfer Structures: Analysis and Design
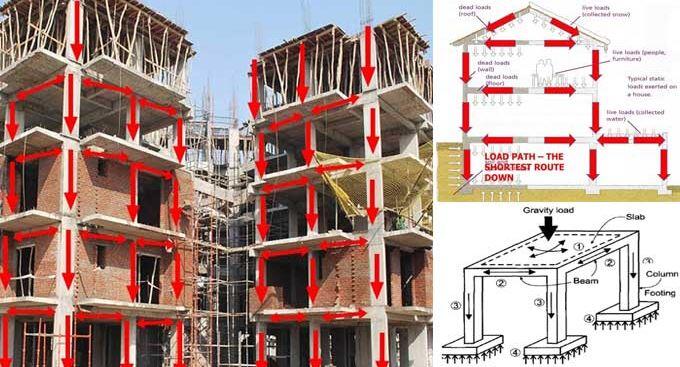
Transfer structures can be described as structural elements that redirect gravity loads (usually from columns or walls) to other structures (such as beams or plates) for distribution to another supporting structure that can resist the load. In other words, transfer structures alter the load path of gravity loads from one alignment to another.
The prominent issue in the design of transfer structures is that the member transferring the load becomes heavily loaded, thereby demanding a very cautious design. Furthermore, the unconventional load path may unintentionally affect the design and performance of other structural members within the building. This is usually found in high-rise buildings where floor arrangements differ. Structural elements such as beams and slabs are often employed as load transfer structures.

Applications of Transfer Structures
Transfer structures play a crucial role in the design and construction of buildings, especially when faced with complex architectural requirements and structural challenges. These structures are engineered to efficiently transfer loads from one area of a building to another, ensuring structural integrity and stability. From tall skyscrapers to large-scale infrastructure projects, transfer structures have become indispensable elements of modern construction.
The primary purpose of transfer structures is to redistribute the loads imposed on them to different vertical and horizontal components of a building. This redistribution of forces is necessary when there are discontinuities or changes in load paths within a structure. Transfer structures enable the efficient transfer of loads from, for example, columns or walls above to columns or walls below, bypassing obstructions such as openings, large spans, or irregular load distributions.
Design of Transfer Structures
I had my first experience in the design of transfer structures in January 2016, when I was given the project to redesign the Cafeteria Hall of Ritman University Community Centre. The original arrangement of the structure is shown in Figure 2;

It was desired to reduce the intermediate columns of the ground floor to a row of single columns as shown in Figure 3. In this case, the beam to support the two rows of internal columns on the first floor can be described as a transfer beam. The two columns so supported can be described as ‘floating columns‘. The transfer beam will be responsible for altering the load path of the internal columns. In some cases, deep beams can be used as transfer structures.

On analysis of the transfer beam, I observed a heavy shear force within the intermediate support, which lead to an increase in the depth of the beam, and the provision of heavy longitudinal and shear reinforcement within the region. This modified arrangement is an example of a transfer structure in its simplest term. The floor beam carrying those upper columns could be described as a transfer beam.
Transfer structures should be designed by experienced engineers, especially those who have practical site experience and a very good understanding of the statics of structures. This is mainly because the design of reinforced concrete transfer structures demands that the engineer will manipulate the depth, width, and reinforcements being provided by the design software.
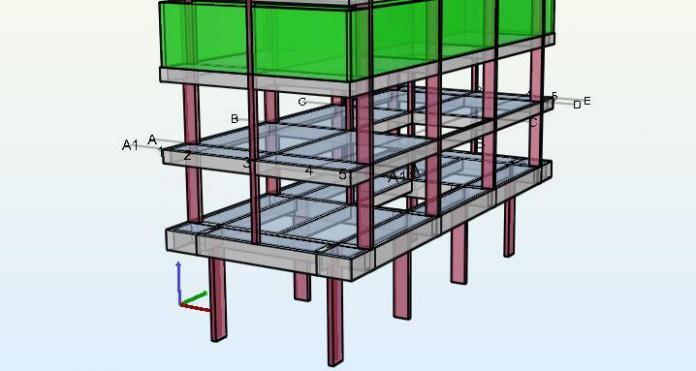
For example, the 5-storey building (G+4) shown below was analysed and designed using Orion Software. The building is a typical transfer structure wherein all the ground floor columns are terminated on the first floor. The rest of the columns started from the first floor and go all the way to the roof. The upper columns are supported on 1.5m long cantilever beams (overhangs) wrapping around the building at the first-floor level (see Figure 4).
For the design of the structure, an initial trial depth of 600 mm was considered for all the first-floor beams and a beam width of 230 mm. The preliminary section failed in flexure and shear as expected for a 5-storey building.
Subsequently, the depth was increased to 750 mm while maintaining the same width of 230 mm. Most of the spans started looking okay (especially for the internal longitudinal/transverse beams), but the cantilever regions were still failing in shear. At this point, the width of the cantilever regions was increased to 300 mm.
Note: The idea is that when it is certain that a beam is adequate in bending (flexure), the width can be increased in order to reduce the shear stress instead of increasing the depth. However, adequate care must be taken about the detailing and architectural requirements.
At the end of the design and manipulation, the depth and width of the beam that satisfied the ultimate limit state requirements were 900 mm and 400 mm respectively, especially for the cantilever regions. The perimeter beams of the first floor were okay at a depth of 600 mm and width of 230 mm, but in order to avoid any awkward appearance of the building, the depth of the perimeter beams was also taken to 900 mm.
In summary, one of the major issues of transfer structures is shear, and more often than not, you will require more than two legs of reinforcement with very close spacing. It is sometimes recommended that the strut-and-tie method is better for the analysis of transfer beams, especially when it is a deep beam.
Furthermore, architects should bear these challenges in mind when designing buildings that may demand the need for transfer structures by increasing the headroom of the building. When the headroom is high enough, there is enough flexibility for proper design by manipulating the width and depth of the beams as appropriate. The suspended ceiling can drop below beams in order to have a flat ceiling finish that will conceal the irregularities of the beam geometry.
Moreover, it is also important that the design engineer keep formwork (cost, construction, reusability) in mind while manipulating section dimensions. The more uniform the sections, the more economical and easier the building becomes for the owner and the builder.
See the images below for some of the structural details for the beams as produced by Orion (unedited).
Note that for bar mark 59 above, you can change the 7H25 to 2 layers
Note that there will be a need for sidebars since the depth of the beam is 900 mm. Thank you for visiting Structville today and God bless you.
Do you know that you can partner with Structville to champion infrastructure development in Africa? Send an e-mail to info@structville.com for more information.
Buckling Amplification Factor for Portal Frames Sensitive to 2nd Order Effects
In this post, elastic first order analysis is performed on a single bay portal frame using Staad.Pro in order to calculate the reactions under vertical loads at ULS (see figure below). The actions on the portal frames are as given below;
gk = 2.31 kN/m
qk = 3 kN/m
Design load = (1.35 gk) + (1.5 × qk)
Roof load = (1.35 × 2.31) + (1.5 × 3.0) = 3.1185 + 4.5 = 7.6185 kN/m
When analysed;
Vertical base reaction VEd = 118.263 kN
Horizontal base reaction HEd = 65.651 kN
Maximum Axial Load on rafter NR,Ed = 93.9 kN
Axial Compression in the rafter
According to clause 5.2.1(4), if the axial compression in the rafter is significant, then the αcr is not applicable.
The axial compression is significant if;
λ ̅ ≥ 0.3√((Afy)/NEd ) and this can be rearranged to show that the compression is significant if
NEd ≥ 0.09Ncr
NEd is the design axial load in the rafter
Lcr is the developed length of the rafter pair from column to column;
Lcr = 30/cos 15° = 31.058m
Ncr = (π2EI)/Lcr2 = (π2 × 210000 × 16000 × 104)/310582 = 343789.059 N = 344 kN
0.09Ncr = 0.09 × 344 = 30.94 kN
NEd = 93.9 kN > 30.94 kN, therefore axial load is significant.
When the axial force in the rafter is significant, a conservative measure of frame stability defined as αcr,est may be calculated. For frames with pitched rafters;
αcr,est = min(αcr,s,est ; αcr,r,est)
Where;
αcr,s,est is the estimate of αcr for the sway buckling mode
αcr,r,est is the estimate of αcr for the rafter snap-through buckling mode. This is only relevant when the frame has more than two bays or if the rafter is horizontal.
To calculate αcr, a notional horizontal force (NHF) is applied to the frame, and the horizontal deflection of the top of the column is determined under this load.
HNHF = VEd/200 = 118.263/200 = 0.591 kN
For the assessment of frame stability and for the assessment of deflections at SLS, the base may be modelled with a stiffness assumed to be a proportion of the column stiffness as follows;
- 10% when assessing frame stability (10% of the column stiffness may be modelled by using a spring stiffness equal to 0.4EIcolumn/Lcolumn)
- 20% when calculating deflections at SLS (20% of the column stiffness may be modelled by using a spring stiffness equal to 0.8EIcolumn/Lcolumn)
When the software cannot accommodate a rotational spring, the base fixity may be modelled by a dummy member of equivalent stiffness as shown below;
- For assessing frame stability, the second moment of area of the dummy member should be taken as Ixx = 0.1Ixx,column
- For calculating deflection at SLS, the second moment of area of the dummy member should be taken as Ixx = 0.2Ixx,column
In both cases, the length of the dummy member is 0.75Lcolumn and pinned at the far end.
On modelling the nominally pinned base using dummy members, the deflection below was obtained for the notional horizontal forces.
Therefore αcr = h / 200δNHF = 7000/(200 × 2.963) = 11.81
αcr,s,est = 0.8(1 – NEd/Ncr)
αcr = 0.8(1 – 93.9/344)11.81 = 6.869
αcr,s,est = 6.869 < 10
Therefore, second order effects are significant. Since αcr,s,est ≥ 3.0, the amplifier is given by;
[1/(1 – 1⁄αcr,est)] = [1/(1 – 1 ⁄ 6.869)] = 1.17
Note: If αcr,s,est is less than 3.0, second order analysis must be used. The simple amplification is not sufficiently accurate.
Therefore the modified partial factor of safety to account for second order effects are as follows;
γG = 1.17 × 1.35 = 1.5
γQ = 1.17 × 1.5 = 1.75
You can now use these modified partial factors to multiply the characteristic permanent and variable actions. The ultimate vertical action on the rafter (taking into account second order effects)is;
Roof load = (1.5 × 2.31) + (1.75 × 3.0) = 8.715 kN/m
Thank you for visiting Structville today and God bless you.
Uplift Verification of Underground Structures
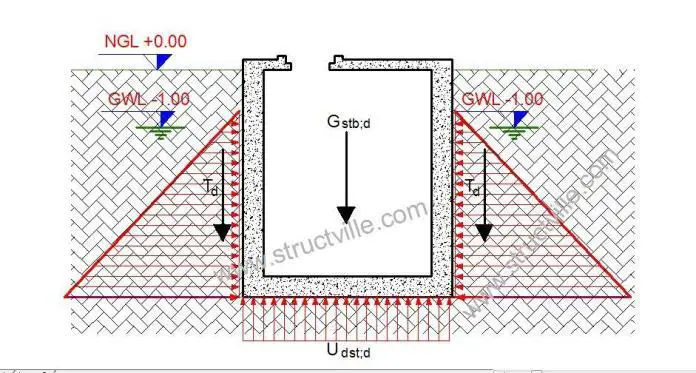
It is widely recognised that an object will float in water if the weight is less than the upthrust. Upthrust is an upward force exerted by a fluid that opposes the weight of an immersed object. This also applies to structures that are buried under the ground and subjected to groundwater action. Structures such as basements, foundations, underground tanks, and swimming pools are at risk if the dead weight is less than the upthrust, especially when the structure is empty.
According to clause 2.4.7.1 of EC7 (EN 1997-1-1:2004), where relevant, it shall be verified that the following limit states are not exceeded in structures buried under the ground:
- loss of equilibrium of the structure or the ground, considered as a rigid body, in which the strengths of structural materials and the ground are insignificant in providing resistance (EQU);
- internal failure or excessive deformation of the structure or structural elements, including e.g. footings, piles or basement walls, in which the strength of structural materials is significant in providing resistance (STR);
- failure or excessive deformation of the ground, in which the strength of soil or rock is significant in providing resistance (GEO);
- loss of equilibrium of the structure or the ground due to uplift by water pressure (buoyancy) or other vertical actions (UPL);
- hydraulic heave, internal erosion and piping in the ground caused by hydraulic gradients (HYO).
Clause 10.2 and 2.4.7.4 of EC7 (EN 1997-1-1:2004) recommends an approach for verifying structures against uplift. Uplift failure (UPL) is verified under the ultimate limit state (ULS) and shall be carried out by checking that the design value of the combination of destabilising permanent and variable vertical actions (Vdst:d) is less than or equal to the sum of the design value of the stabilising permanent vertical actions (Gstb;d) and of any design value of any additional resistance to uplift (Rd).
The limit state check must ensure that;
Vdst:d ≤ Gstb;d + Rd
Where;
Vdst:d = Gdst:d + Qdst:d
The relevant partial factors of safety for the verification are noted in Annex A of BS EN 1997-1 and are shown in the Table below;
Action | Stabilizing – Favorable | Destabilizing – Unfavourable |
Permanent γG | 0.9 | 1.1 |
Variable γQ | 0 | 1.5 |
From the above table, it can be seen that variable actions should not be considered when they are favourable to the uplift stability of a buried structure.
In this article, we are going to show how you can verify UPL using Staad Pro software and manual analysis. To check for uplift, we must confirm that the destabilizing actions (both permanent and variable), are less than permanent stabilizing actions. We do not consider favourable variable actions when verifying uplift. Let us look at an example below;
Example
Let us verify the uplift stability of a 3 m x 2 m x 4.0 m concrete tank that is buried under the ground (see figure below). The water table is 1.0 m below the natural ground surface. Thickness of all elements is 350 mm, unit weight of concrete is 25 kN/m3, and unit weight of water is 10 kN/m3. Verify the uplift stability of the tank during construction before the installation of the top slab.
Solution
(a) Stabilizing Forces
Weight of the base = 3.7 x 2.7 x 0.35 x 25 = 87.41 kN
Weight of the walls = 2(3.7 x 4.0 x 0.35 x 25) + 2(2.0 x 4 x 0.35 x 25) = 259 + 140 = 399 kN
Total weight (Gstb) = 486.41 kN
We are neglecting side friction and other possible stabilizing forces
At ultimate limit state, Gstb,d = 0.9 x 486.41 = 437.769 kN
(b) Destabilizing Forces
Head of ground water above the base = 4.35m – 1.0 m = 3.35 m
Vdst,d = (3.7 x 2.7 x 3.35) x 10 = 334.665 kN
At ultimate limit state Vdst,d = 1.1 x 334.665 = 368.131 KN
Vdst,d/Gstb,d = 368.131/437.769 = 0.84 < 1.0 Ok
Therefore the tank is safe against uplift at that stage of construction.
If the structure had failed uplift verification, the remedial actions that could be adopted are;
(1) Increase the thickness of the structural elements and/or projecting the base beyond the walls
(2) Employing drainage and ground water lowering techniques
(3) Introducing anchor piles
To download our publication on design of swimming pools and underground water tanks, click HERE;
Propriety of Bending Schedules for Construction Purposes
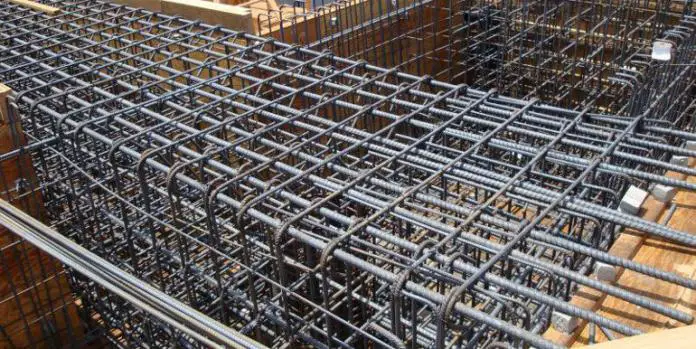
Structural engineers usually issue bar bending schedule (BBS) to clients/contractors after completing the design and detailing of a reinforced concrete structure. Bar bending schedules usually show the length, shape, and quantity of reinforcements needed for a particular phase/element of a project.
The bar bending schedule issued by structural engineers after a design is usually very exact. In other words, engineers provide the exact quantity of steel needed to produce what they have shown in their drawing, without additional considerations. However, the primary challenge faced by contractors on site is the issue of offcuts, since rebars are usually supplied in 12 m length, and the cut length of reinforcements can vary depending on the element. Offcuts are not usually accounted for in the schedule issued by a structural engineer, and practically, not all offcuts are reusable.
In this case, there are usually two major challenges for the contractor;
(1) He can buy more reinforcement than given in the bending schedule to take care of the losses from offcuts. This usually requires additional calculations.
(2) If the contractor purchases reinforcements based on the bar bending schedule only, he risks requesting for supply twice, which will probably double his transportation cost.
Case Study
To make this point clearer, let us consider this practical scenario below. The ground floor of a 3-storey commercial development is 4.0 m high, and the details of the column reinforcement are as shown below;
CT1 – Column Type 1 (230 x 230)mm – 2 Nos
Main bars: 4Y16
Links: Y10-200 c/c
CT2 – Column Type 2 (450 x 230)mm – 4 Nos
Main bars: 6Y16
Links: Y10-200 c/c
CT3 – Column Type 3 (600 x 230)mm – 2 Nos
Main bars: 8Y20
Links: Y10-250 c/c
CT4 – Column Type 4 (450 x 450)mm – 1 No
Main bars: 12Y20
Links: Y10-300 c/c
At a lap length of 45ϕ (45 x diameter of bar), the typical bending schedule prepared by the structural engineer for the main bars of the ground floor to first floor columns is as follows:
From the above bending schedule, the quantity of steel to be purchased (per 12 m length) for the main bars are as follows;
Y16: [242.28/(1.579 x 12)] = 12.78 (say 13 lengths of Y16mm)
Y20: [343.51/(2.466 x 12)] = 11.61 (say 12 lengths of Y20mm)
As you can see, these quantities are easily verifiable from the bending schedule and could have possibly been used in the preparation of the bill. It is the exact quantity required as given in the drawing.
However, let us go to site and see how this will possibly play out:
The total quantity of bar mark 01 that will need to be cut by the iron bender/fitter is 32 pieces (kindly verify), and the cut length of each bar is 4795 mm. What this means is that he can only obtain 2 pieces of bar mark 01 from each 12m length of reinforcement, and an offcut of 2410 mm. This offcut cannot be used anywhere in the column, except perhaps it gets useful in the beams or other places. Since 32 pieces of bar mark 01 are required, he will need 16 lengths of Y16 mm against the 13 lengths calculated in the bending schedule. Of course, there will be 16 pieces of 2410 mm as offcut!
In the same way, the total quantity of bar mark 02 that will need to be prepared by the iron bender is 28 pieces, and the cut length of each bar is 4975 mm. This also means that he can only obtain 2 pieces of bar mark 02 from each 12m length of reinforcement, with an offcut of 2050 mm. In effect, he will need 14 lengths of Y20 mm against the 12 lengths calculated in the bending schedule.
If the contractor did not make this consideration before requesting for supply, he will likely make his request twice, to the detriment of extra cost. Therefore, the effects of offcuts should be verified by the contractor before he can place his order for reinforcement. This is usually very common, especially for someone who has not experienced it before.
Thank you for visiting Structville today, and God bless you.
Do you need help in knowing the exact quantity of reinforcement that you will need to complete your project without needing to go to the market twice? We are here to help you with that. When you send your drawings to us, we will assess all reinforcements and bar marks independently, and tell you where all offcuts can be reused. We achieve this by issuing a special bending schedule and cutting scheme that takes into account re-usage of offcuts for foundations, beams, slabs, and columns. We will also issue a cutting sequence to the iron bender such that wastage can be minimised as practically as possible. This can save you a reasonable amount of money for your projects, and we do this for a very low fee that is based on the quantity of offcuts that we saved for you. Try us today by sending an e-mail to info@structville.com
Plastic Analysis of Frames
The fully plastic moment of a section (Mp) is the maximum moment of resistance of a fully yielded cross-section. The yielded zone due to bending where infinite rotation can take place at a constant plastic moment (Mp) is called a plastic hinge.
In order to find the fully plastic moment of a yielded section, we normally employ the force equilibrium equation by saying that the total force in tension and compression at that section are equal. In frames, the plastic moment can be easily obtained using the kinematic method (upper bound theorem).
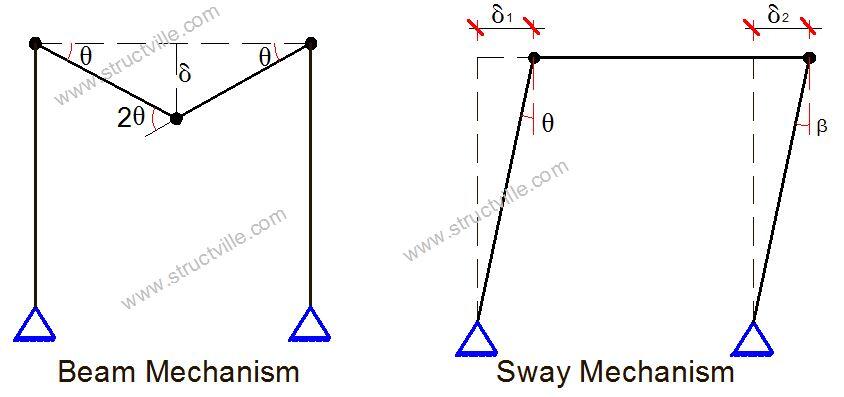
When a system of loads is applied to an elastic body, it will deform and show some resistance to deformation, and such a body is called a structure. On the other hand, if no resistance is set up against deformation, such as a body is said to have formed a mechanism. This can occur in structures such as beams and frames.
One of the fundamental conditions for plastic analysis of a framed structure is that the collapse load is reached when a mechanism is formed, in which the number of plastic hinges developed in the structure is sufficient to form a mechanism. The load factor (λ) at rigid plastic collapse is the lowest multiple of the design load which will cause the whole structure or part of it to form a mechanism.
It is important to realise that the number of independent mechanisms in a structure is related to the number of plastic hinge locations and the degree of redundancy of the system.
In beams, identification of critical spans in terms of Mp or load factor can be obtained using the static or kinematic method by considering simple beam mechanisms. But in framed structures, other types of mechanisms such as joint, sway, and gable mechanisms are also considered. Each of these mechanisms can occur independently, but it also possible for a critical collapse mechanism to develop by combination of the independent mechanisms.

The purpose of combining mechanisms is to eliminate hinges that exist in the independent mechanism leaving only the minimum number required in the resulting combination to induce collapse.
The steps in the plastic analysis of frame structures are as follows;
- Calculate the degree of static indeterminacy of the structure (RD)
- Calculate the number of possible plastic hinges (RD + 1)
- Identify the independent collapse mechanisms and evaluate them
- Combine the independent mechanism and eliminate hinges where applicable
- Obtain the critical plastic moment Mp which is the highest bending moment in the structure
- Check for equilibrium and evaluate the reactive forces
- Plot the final plastic moment diagram. No bending moment at any point in the structure should exceed the critical plastic moment.
Solved Example
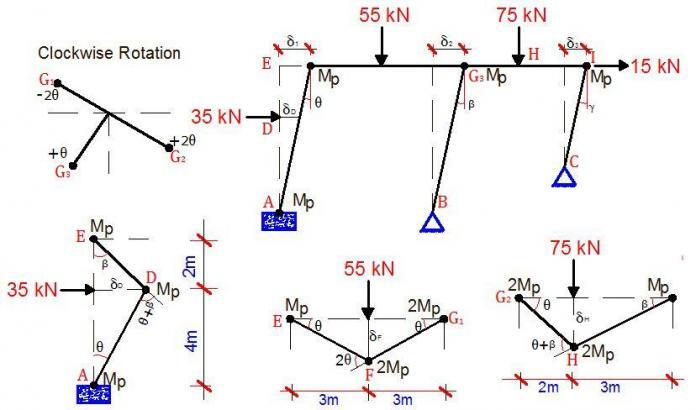
For the frame loaded as shown below, find the critical Mp value, and draw the collapse moment diagram. The loads are factored.
Degree of static indeterminacy
RD = (3m + r) – 3n
m (number of members) = 4
r (number of support reactions) = 5
n (number of nodes) = 5
RD = (3 × 4 + 5) – 3(5) = 2
Therefore the frame is indeterminate to the second order.
A little consideration will show that the possible places where we could have plastic hinges in the structure are at node B, section C, section D (just to the left), section D (just to the right), section D (below) and section F. Nodes A, E, and F are all natural hinges. Therefore, total number of possible hinges = 6
Hence, number of independent collapse mechanisms = 6 – 2 = 4
These independent mechanisms are listed below;
– 2 Beam mechanisms (span B – D and span D – G)
– 1 sway mechanism of the entire frame due to the horizontal load
– 1 joint mechanism
Analysis of the independent mechanisms
Mechanism 1
δC = 3 × θ = 3θ
Internal work done due to rotations at internal hinges at B, D, and C
Total internal work done (Wi) = Mpθ + Mpθ + 2Mpθ = 4Mpθ
External work done (We) = 115 × 3θ = 345θ
Let external work done = Internal work done
4Mpθ = 345θ
On solving, Mp = 345/4 = 86.25 kNm
Mechanism 2
δF = 3 × θ = 3θ
Internal work done due to rotations at internal hinges at B, and F. No work is done at G because it is a natural hinge.
Total internal work done (Wi) = Mpθ + 2Mpθ = 3Mpθ
External work done (We) = 74 × 3θ = 222θ
Let external work done = Internal work done
3Mpθ = 222θ
On solving, Mp = 222/3 = 74 kNm
Mechanism 3 (Sway)
δ1 = 4 × θ = 4θ
Internal work done due to rotations at internal hinges at B, and D. No work is done at A, E, and G because they are all natural hinges.
Total internal work done (Wi) = Mpθ + Mpθ = 2Mpθ
External work done (We) = 25 × 4θ = 100θ
Let external work done = Internal work done
2Mpθ = 100θ
On solving, Mp = 100/2 = 50 kNm
Mechanism 4 (Joint Rotation)
Internal work done = Mpθ + Mpθ + Mpθ = 3Mpθ
External work done = 0 (no external work done)
Internal work done = Mpθ + Mpθ + Mpθ = 3Mpθ
External work done = 0 (no external work done)
Let us now consider the possible mechanism combination by preparing the table below
The critical Mp is therefore = 111.167 kNm (This was achieved after other combinations were considered but this was found to be the highest).
Note that by virtue of the combination, internal hinges at B, D2, and D3 were eliminated. So the critical collapse mechanism is as given below;
Note that the implication of our analysis above is that points C, F and D1 are plastic hinges, with a full plastic moment of 111.167 kNm. While C and F are sagging, D1 is hogging. No other bending moment in the structure should exceed this value. Once a higher moment is discovered, it means that the critical collapse moment was not appropriately obtained.
∑MFR = 0 (anti clockwise positive)
3VG = 111.167
VG = 37.056 kN
∑MCL = 0 (clockwise positive)
3VA – 4HA = 111.167 ———– (1)
∑MDL = 0 (clockwise positive)
6VA – 4HA – (115 × 3) = -111.67
6VA – 4HA = 233.833 ———– (2)
Solving (1) and (2) simultaneously;
VA = 40.721 kN
HA = 2.623 kN
∑MA = 0 (clockwise positive)
12VG + 6VE – (74 × 9) – (115 × 3) – (25 × 4) = 0
6VE = 666.328
VE = 111.055 kN
∑Fx = 0
HE = 25 + 2.623 = 27.623 kN
Bending Moment
You can verify that having obtained the support reactions, the bending moment diagram can easily be plotted without strenuous calculations.
Thank you for visiting Structville today, and God bless you.
How to Analyse Retaining Walls for Trapezoidal Load
In the analysis of retaining walls subjected to earth pressure, it is very common to observe trapezoidal load distribution on the walls. Normally, earth pressure on a retaining wall is assumed to adopt a triangular load distribution, but due to surcharge which is usually assumed to act on the ground surface, the top of the wall experiences some degree of lateral pressure.
When the top of a retaining wall is free and the base assumed to be fixed, the retaining wall can be analysed easily using the three equations of equilibrium by modelling the wall as a cantilever. The load cases of surcharge, earth pressure, and ground water can be analysed separately, and the results added algebraically. When the wall top of a wall is propped, a statically indeterminate behaviour is assumed, and the wall can be analysed using the theory of plates and shells.
Numerous approaches such as finite difference method, finite element analysis, classical theory, etc can be adopted to solve problems of such nature. Anchor (1992) adopted a convenient approach of replacing the surcharge pressure with equivalent soil pressure. This was done by adding the maximum soil pressure and surcharge pressure algebraically, and assuming an equivalent triangular distribution. Another approach recommended by Reynolds et al (2008) is to separate the load cases, analyse them separately, and sum the results together. For walls spanning in two directions, this method is accurate for edge bending moments, but approximate for span moments.
In this post, we are going to explore the behaviour of the walls of a tank subjected to earth pressure and surcharge pressure (find the section of the tank above). We are going to investigate the methods described above, and compare them with finite element analysis using Staad Pro software.
Let us consider a propped cantilever wall loaded as shown below. The pressure at the top of the wall represents the surcharge pressure at ULS, while the pressure at the bottom of the wall represents the combined pressure of surcharge and retained earth at ULS.
(1) By plate theory
We are going to analyse the walls using coefficients that can be readily obtained from charts and tables. We will separate the trapezoidal load into its triangular and rectangular components as shown below, and analyse them separately;
Using Moment Coefficient from Table
Note that these coefficients contain allowance for torsion at the edge, and are picked from Reynolds et al (2008).
Vertical Span
Maximum negative moment at base (triangular) = 0.048 × 70.599 × 4.32 = 62.658 kNm/m
Maximum negative moment at base (rectangular) = 0.073 × 5.625 × 4.32 = 7.592 kNm/m
Total Moment negative base moment = 62.658 + 7.592 = 70.250 kNm
Maximum positive moment (triangular) = 0.0185 × 70.599 × 4.32 = 24.149 kNm/m
Maximum positive moment (rectangular) = 0.055 × 5.625 × 4.32 = 5.720 kNm/m
Total approximate mid-span moment = 24.149 + 5.720 = 29.869 kNm/m
Horizontal Span
Maximum negative moment at the edge (triangular) = 0.033 × 70.599 × 4.32 = 43.077 kNm/m
Maximum negative moment at the edge (rectangular) = 0.032 × 5.625 × 6.42 = 7.3728 kNm/m
Total Moment negative edge moment = 43.077 + 7.3728 = 50.449 kNm
Maximum positive moment (triangular) = 0.011 × 70.599 × 4.32 = 14.359 kNm/m
Maximum positive moment (rectangular) = 0.024 × 5.625 × 6.42 = 5.5296 kNm/m
Total positive moment = 19.886 kNm/m
(2) By Equivalent Pressure Method
We are going to analyse the pressure load on the wall by summing up the pressure due to retained earth and surcharge and analysing them as triangular distribution.
Vertical Span
Maximum negative moment at the base base = 0.048 × 76.224 × 4.32 = 67.65 kNm/m
Maximum positive moment at the span = 0.0185 × 76.224 × 4.32 = 26.073 kNm/m
Horizontal Span
Maximum negative moment at the edge = 0.033 × 76.224 × 4.32 = 46.509 kNm/m
Maximum positive moment (triangular) = 0.011 × 76.224 × 4.32 = 15.503 kNm/m
(3) By Finite Element Analysis Using Staad Pro
When modelled and analysed on Staad Pro;
We will have to allow for torsion at the edge moments.
By using Staad Pro;
Vertical Span
Maximum negative moment at base = 58.9 kNm/m (allowing for torsion = 71.7 kNm/m)
Maximum positive moment (mid span) = 31.2 kNm/m
Horizontal Span
Maximum negative moment at edge = 40 kNm/m (allowing for torsion = 52.8 kNm/m)
Maximum positive moment = 18 kNm/m
Twisting moment = 12.8 kNm/m
Let us compare the results from the three methods investigated;
From the above table, it can be seen that the result from the use of coefficient and FEA are very close and comparable, while the result using equivalent approach is giving lower bound results. Therefore, in the absence of computer programs, I recommend the use of coefficients from Table for analysis of retaining walls subjected to trapezoidal loads.
This post is an excerpt from the book;
‘Structural Design of Swimming Pools and Underground Water Tanks‘ by Ubani Obinna. Published by Structville Integrated Services Limited (2018). ISBN 978-978-969-541-6
To obtain this publication in PDF for NGN 2,000, click HERE
For more information, send a Whatsapp message to;
+2347053638996
References
Anchor R.D. (1992): Design of Liquid Containing Structures. Published by Edward Arnolds, UK. ISBN 0-340-54527-5
Reynolds C.E., Steedman J.C., Threlfall A.J. (2008): Reynolds Reinforced Concrete Design Handbook. Spon Press, Taylor and Francis Group (11th Edition)
Ubani O.U. (2018): Structural Design of Swimming Pools and Underground Water Tanks. Structville Integrated Services Limited (2018). ISBN 978-978-969-541-6
Structural Design of Swimming Pools and Underground Water Tanks
I spent a large part of the last few months developing the contents of this booklet on ‘Structural Design of Swimming Pools and Underground Water Tanks (According to the Eurocodes)’. Water is necessary for survival of mankind, but in one way or another, water is relatively scarce. We all know that rain does not fall continuously, and for water to be available for usage in homes, it will have to be fetched/pumped from the stream, or harvested during rainfall, or dug up from the ground. As a result, survival instincts made man to create different means of storing water in order to face the periods of scarcity.
One of the alternatives of storing water is the use of reinforced concrete structures which may be buried under the ground, supported on the ground surface, or elevated above the ground surface. Civil engineers have been at the forefront of designing these infrastructures in order to meet accepted performance criteria. One of the profound requirements of water tanks is water tightness, which can be related to the serviceability limit state requirement of cracking, amongst other factors.
The publication highlighted above focuses on the use of reinforced concrete for construction of underground water tanks and swimming pools. All the factors usually considered in the design of underground water retaining structures such as geotechnical analysis, modelling, loading, structural analysis, and structural design were all presented in an objective manner to the reader. Also, the use of Staad Pro Software was explored in detail on how it can be used to model and analyse tanks and swimming pools.
I am going to use the screenshots below to show you some of the contents, with hope that you will find it interesting. The images are arranged in no specific order.
The publication also paid serious attention to how water tightness can achieved on site through careful and standard construction practices. In addition to this 167 pages booklet, I also developed excel spreadsheets that can help make calculation of crackwidths faster, and Staad Pro video tutorials, peradventure you want to master the use of the software. Kindly see screenshot below;
For this reason, there are three different packages that can be purchased to match different levels of interest in the content.
To purchase any of the packages, click HERE
How will you describe this system of forces?
What is the best description that you will give to this system of forces?
(a) Coplanar parallel system of concurrent forces
(b) Non-coplanar parallel system of non-concurrent forces
(c) Coplanar non-parallel system of concurrent forces
(d) Non-coplanar non-parallel system of non-concurrent forces
E-mail: info@structville.com
WhatsApp: +2347053638996
Are you looking for where you can make free downloads of publications? Visit Structville Research for all your free downloads.
STRUCTVILLE REINFORCED CONCRETE DESIGN MANUAL
We have this very affordable design manual available…
Do you want to preview the book, click PREVIEW
To download full textbook, click HERE
Is This Ultimate or Serviceability Limit State Failure?
Kindly look at the image carefully, and lend your professional opinion if the failure of the building will be categorized under ultimate or serviceability limit state. By posting and discussing your opinion on the comment section, I am very certain that knowledge and deeper understanding of this topic will be enhanced.
Thank you very much.
E-mail: info@structville.com
WhatsApp: +2347053638996
Are you looking for where you can make free downloads of publications? Visit Structville Research for all your free downloads.
STRUCTVILLE REINFORCED CONCRETE DESIGN MANUAL
We have this very affordable design manual available…
Do you want to preview the book, click PREVIEW
To download full textbook, click HERE