Structural elements subjected to axial compressive forces are described as either columns or struts. Columns are a fundamental load-carrying element typically oriented in a vertical direction within structures. Struts, on the other hand, represent a more general term encompassing any member experiencing compression. These elements can be found in various configurations, including vertical elements in building frames, the top chords of trusses, or indeed, any location within a three-dimensional space frame.
In structural members subjected to compressive forces (e.g. steel columns and struts), secondary bending caused by imperfections within materials during fabrication processes, inaccurate positioning of loads or asymmetry of the cross-section etc, can induce premature failure either in a part of the cross-section, such as the outstand flange of an I-section, or on the element as a whole. In such cases, the failure mode is predominantly buckling and not squashing.
The design of most steel column members is governed by their overall buckling capacity, i.e. the maximum compressive load which can be carried before failure occurs by excessive deflection in the plane of greatest slenderness.
Compression members (i.e. struts and columns) should be checked for;
(1) resistance to compression
(2) resistance to buckling
The design of steel columns for buckling is well covered in clause 4.7 of BS 5950-1:2000 while the buckling resistance of members is covered in clause 5.5 of EN 1993-1-1:1992 (EC3). The checks for uniform compression in EC3 are found in clause 5.4.4.
In the design of steel columns, the design compressive axial force (NEd) should not exceed the design compression resistance (Nc,Rd) such that;
NEd/Nc,Rd ≤ 1.0
Nc,Rd = (A.fy)/γmo
Where;
A is the gross area of the section
fy is the yield strength of the section
γmo is the material factor of safety.
Similarly, the design axial force should not exceed the buckling resistance of the steel column (Nb,Rd) such that;
Nb,Rd = χAfy/γmo
Where;
χ is the buckling reduction factor
A is the gross area of the section
fy is the yield strength of the section
γmo is the material factor of safety.
Design Process of Steel Columns
Designing a steel column involves a systematic approach that balances strength, stability, and economy. Here’s a breakdown of the key steps:
- Load Determination:
- Identify all characteristic loads acting on the steel column, including dead loads (self-weight of the column, beams, and slabs), live loads (occupancy, furniture), and wind or seismic loads.
- Apply appropriate load factors as per design codes (e.g., AISC 360 in the US, Eurocode 3 in Europe) to account for uncertainties and safety margins.
- Define load combinations representing different scenarios (e.g., dead + live, dead + live + wind).
- Material Properties:
- Specify the steel grade for the column, considering its yield strength (fy) and ultimate strength (fu). Common grades include A36, A572, S275, S355, and high-strength steels.
- Column Selection (Trial and Error):
- Assume an initial steel section size (e.g., wide flange section – W shape, universal column UC section – H section, hollow structural section – HSS).
- Calculate the effective length (Le) of the steel column, which considers the actual length and end conditions (pin-ended, fixed, etc.).
- Determine the slenderness ratio (λ) by dividing the effective length by the radius of gyration (r) of the chosen column section. The radius of gyration is a geometric property that reflects the distribution of area within the section. Steel design codes provide tables for r values for various sections.
- Compression Capacity:
- Calculate the design load capacity (Nc,Rd) of the steel column for pure compression: Nc,Rd = fy × A
- Buckling Capacity:
- Evaluate the buckling capacity (Nb,Rd) of the steel column using design code provisions. This typically involves a buckling reduction factor (χ) that accounts for the column’s slenderness, type of section, and potential for inelastic buckling. The buckling capacity is generally expressed as: Nb,Rd = χ × fy × A (where A is the cross-sectional area)
- Design codes provide charts or equations for determining χ based on the slenderness ratio.
- Moment Capacity Checks (Optional):
- For columns subjected to bending moments in addition to axial loads, perform additional checks to ensure adequate flexural strength. This may involve calculating the moment capacity of the section and comparing it with the design moment demands.
- Capacity Checks:
- Compare the factored design loads NEd (from step 1) with the steel column’s capacities (Nc,Rd and Nb,Rd). The design is safe if:
- For all load combinations: NEd ≤ Nc,Rd
- If the steel column is slender (high λ), buckling capacity (Nb,Rd) becomes the governing factor:
- Factored Design NEd ≤ Nb,Rd
- Compare the factored design loads NEd (from step 1) with the steel column’s capacities (Nc,Rd and Nb,Rd). The design is safe if:
- Iterative Process:
- If the initial section fails the capacity checks, select a larger section and repeat steps 3-6. This iterative process continues until a suitable section is found that satisfies all design criteria.
Design Considerations
- Connection Design: Ensure the steel column connections (welded, bolted) can transfer the forces safely to beams or other elements.
- Fire Resistance: If the column is part of a fire-resisting structure, consider the impact of fire on its strength and stability. Fireproofing materials may be required.
- Corrosion Protection: Depending on the environment, the column may require corrosion protection through painting, galvanizing, or other methods.
Tools and Resources
- Steel design codes (AISC 360, Eurocode 3) provide detailed design procedures and design tables.
- Structural analysis software can be used to model the structure and determine the loads acting on the columns.
- Steel manufacturer tables list the properties of various steel sections for selection.
Design Example of Steel Columns
In the downloadable solved example, the capacity of a 4m universal column (UC 305 × 305 × 158) pinned at both ends was investigated for its capacity to carry an axial load of 3556 kN according to the requirements of Eurocode 3 and BS 5950.
READ ALSO ON THIS BLOG…
On the Shear Deformation of One Span Beams Using Virtual Work Method
Example on Analysis of Statically Determinate Frames
SOLUTION
The first step is to outline the properties of the section we wish to investigate.
Properties of UC 305 × 305 × 158
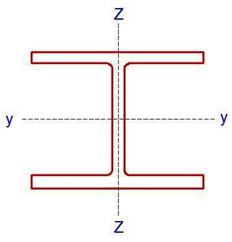
D = 327.1 mm; B = 311.2 mm; tf = 25mm; tw = 15.8mm; r = 15.2mm; d = 246.7mm, b/tf = 6.22; d/tw = 15.6; Izz = 38800 cm4; Iyy = 12600 cm4; iy-y = 13.9cm; iz-z = 7.9 cm, A = 201 cm2
Column Design according to EN 1993-1-1 (Eurocode 3)
Thickness of flange tf = 25mm. Since tf > 16mm, Design yield strength fy = 265 N/mm2 (Table 3.1 EC3)
Section classification
ε = √(235/fy) = √(235/265) = 0.942
We can calculate the outstand of the flange (flange under compression)
C = (b – tw – 2r) / (2 ) = (327.1 – 15.8 -2(15.2)) / (2 ) = 140.45 mm
We can then verify that C/tf = 140.45/25 = 5.618
5.618 < 9ε i.e. 5.618 < 8.478.
Therefore the flange is class 1 plastic
Web (Internal compression)
d/tw = 15.6 < 33ε so that 15.6 < 31.088. Therefore the web is also class 1 plastic
Resistance of the member to uniform compression
Nc,Rd = (A.Fy)/γmo = (201 × 102 × 265) / 1.0 = 5326500 N = 5326.5 kN
NEd/Nc,Rd = 3556/5326.5 = 0.6676 < 1
Therefore section is ok for uniform compression.
Buckling resistance of member (clause 5.5 EN 1993-1-1:1992)
Since the member is pinned at both ends, the critical buckling length is the same for all axis Lcr = 4000mm
Slenderness ratio ¯λ = Lcr/(ri λ1)
λ1 = 93.9ε = 93.9 × 0.942 = 88.454
In the major axis
(¯λy ) = 4000/(139 × 88.454) = 0.3253
In the minor axis
(¯λz ) = 4000/(79 × 88.454) = 0.5724
Check D/b ratio = 327.1/311.2 = 1.0510 < 1.2, and tf < 100 mm (Table 5.5.3 EN 1993-1-1:1992)
Therefore buckling curve b is appropriate for y-y axis, and buckling curve c for z-z axis. The imperfection factor for buckling curve b, α = 0.34 and curve c = 0.49 (Table 5.5.1)
Φ = 0.5 [1 + α(¯λ – 0.2) + ¯λ2]
Φz = 0.5 [1 + 0.49 (0.5724 – 0.2) + 0.57242] = 0.7551
Φy = 0.5 [1 + 0.34 (0.3253 – 0.2) + 0.32532] = 0.5742
X = 1/(Φ+ √(Φ2 -¯λ2))
Xz = 1/( 0.7551 + √(0.75512 – 0.57242)) = 0.8015 < 1 ok
Xy = 1/( 0.5742+ √(0.57242 – 0.32532)) = 0.9548 < 1 ok
In this case, the lesser holds for the calculation of the buckling load.
Therefore Nb,Rd = (Xz A.Fy)/γm1 = (0.8015 × 201 × 102 × 265) / (1.0 ) = 4269189.75 N = 4269.189 kN
NEd/Nb,Rd = 3556/4269.189 = 0.8329 < 1
Therefore section is ok for buckling.
Summarily, the section is ok to resist axial load on it.
Column Design According to BS 5950-1:2000
From Table 9 BS 5950-1:2000
Since the thickness of the flange is > 16mm but < 40mm, Py = 265 N/mm2
Obviously, the column will buckle about the z-z axis, which is the weaker axis in terms of buckling. It is however important to realise that axes are not labelled in the same way using the two codes. The z-z axis in EC3 is the y-y axis in BS 5950, while the y-y axis in EC3 is called the x-x axis in BS 5950.
ε = √(275/fy) = √(275/265) = 1.0186
b/tf = 6.22 < 15ε = 15.28; d/tw = 15.6 < 40ε = 40.74
Hence the UC section is not slender.
Therefore, let us focus on the weaker axis (z-z) in order to verify the buckling load.
Slenderness ratio = λ = Lcr/rz = 4000/79 = 50.633
From Table 23 of BS 5950, for H sections of thickness < 40mm, strut curve c is appropriate for calculating our compressive strength PC (N/mm2). We can go through the stress of calculating the compressive strength PC using the formulas outlined in ANNEX C of BS 5950 or simply read them from Table 24 of the code. We will use the two methods in this example.
Calculating using formula
Limiting slenderness λ0 = 0.2 [(π2E)/Py ]0.5 = 0.2 [(π2 × 210000) / 265]0.5 = 17.6875
Perry factor for flexural buckling under axial load η = [a(λ – λ0)]/1000 where a = 5.5 for strut curve c
η = [5.5(50.633 – 17.6875)] / 1000 = 0.1812
Euler load PE = (π2E)/λ2 = (π2 × 210000) / 50.6332 = 808.447 N/mm2
Φ = [Py + (η+1)PE] / 2 = [265 + (0.1812 + 1) × 808.447] / 2 = 609.9688 N/mm2
Therefore, the compressive strength Pc = (PE Py) / (Φ + (Φ2 – PE Py)0.5)
Pc = (808.447 × 265) / (609.9688 + [609.96882 – (808.447 × 265)]0.5) = 212.699 N/mm2
If we had decided to read from the chart, strut curve C, λ < 110, Py = 265 N/mm2
Knowing that λ = 50.633. Interpolate between λ = 50 and 52 to obtain Pc = 212 N/mm2
So let us use PC = 212.699 N/mm2
Hence Buckling load, PX = AgPc = 201 × 102 × 212.699 = 4275249.9 N = 4275.2499 kN
Therefore, N/PX = 3556/4275.2499 = 0.8317 < 1.0. Hence the section is okay for buckling.
The difference in result between EC2 buckling load (Nb,Rd = 4269.189 kN) and BS 5950 buckling load (PX = 4275.2499 kN) for axially loaded columns disregarding load factor is just about 0.144%.
You can download the paper HERE and compare the results from the two codes.
Like us on Facebook by clicking on www.facebook.com/structville


• Sorry for the huge review, but I’m really loving the new Zone, and hope this, as well as the excellent reviews some other people have written, will help you decide if it’s the right choice for you. CoBie adaptation in USA
Interference Analysis in USA
MEP F modelling in USA
Revit Modeling in USA