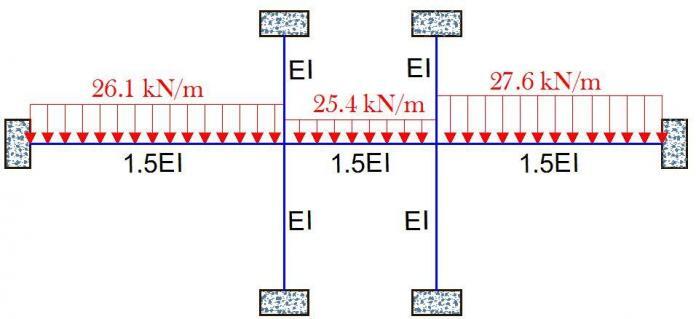
Precise moment distribution is a variation of moment distribution method which aims to shorten the time spent carrying out the normal moment distribution method. This is achieved by introducing continuity and distribution factors, which in turn means that only one distribution and carry over is required to achieve the final bending moment values. This post explores this method of structural analysis, and a solved example is used to drive the point home.
[the_ad id=”498″]
Procedure for Carrying Out Precise Moment Distribution method (Reynolds and Steedman, 2005)
(1) Calculate fixed end moments
(2) Determine continuity factor for each span from the general expression;
Where;
ϕn+1 and kn+1 are continuity and stiffness of span being considered
∑[kn/(2 – ϕn)] is the sum of values of [kn/(2- ϕn)] of all remaining members meeting at that joint
If far end of column is fully fixed, then [kn/(2- ϕn)] = 2kn/3, since ϕn = 0.5
If far end of column is pinned, then [kn/(2- ϕn)] = kn/2
You have to work from left to right, and from right to left
(3) Calculate distribution factors at joints from general expression;
Where ϕBC and ϕCB are continuity factors obtained from step 2.
Unlike in continuous beams, sum of distribution factors each side of support will not equal to unity due to action of columns. Distribution factor for each column is obtained by dividing total column distribution factor in proportion to stiffness of columns.
(4) To carry over moment at supports, multiply distributed balancing moment at left hand end of member by continuity factor obtained from working RIGHT to LEFT, and carry over this value to the right hand side. At this point balance carried over moment by dividing an equal amount of opposite sign between then remaining members meeting at that joint with respect to their values of [kLR/(2- ϕRL)]
(5) Undertake one complete carry over operation working from left to right and then from right to left from each joint at which fixed end moment occurs and sum results to obtain final moment of the system.
The remaining distribution factor at each node = 1 – DFCD = 1 – 0.0844 = 0.9156
This distribution factor is now shared among the columns according to their stiffnesses. Since the stiffnesses are equal = 0.9156/2 = 0.4578
Now the moments are distributed by multiplying the fixed end moments by the distribution factor in the opposite sign.
E.g For the left hand side of the beam; M = -80 × 0.084 = +6.72 (note the change in sign)
For the upper column (UC) ; M = -80 × 0.458 = +36.64 (note the change in sign)
Using this same approach, you can compute the remaining.
Carry over
The moment of +6.72 is carried over from DC to CD based on the continuity factor, and once again this is done with the reverse sign (check step 4 above).
For instance, +6.72 is multiplied by 0.467 which gives -3.138 (note the change in sign).
This moment of -3.138 is shared in opposite sign to the remaining members in the proportion of their [kLR/(2 – ϕRL)].
For instance for the columns, [kLR/(2 – ϕRL)] = [(2/3) /(2 – 0.467)] = 0.4348
For the beam, [kLR/(2 – ϕRL)] = [(1/8) /(2 – 0.467)] = 0.08155
Now, the moment shared to each column (in opposite sign) is given by;
MUC = MLC = -3.138 × [0.4328/(0.4348 + 0.4348 + 0.08155] = 2.282 kNm
When carrying out the manual design of reinforced concrete structures, column loads are usually assessed by considering the support reactions from beams they are supporting, or by the tributary area method. The latter is more popular due to its simplicity and speed, but usually fails to capture all the loads that are imposed on the columns (such as wall loads), while the former is more complex and time-consuming, it usually very representative of all the possible loads that are imposed on the column.
Steps on how to load a column from beam support reaction
The following steps can be adopted when using beam support reactions to obtain the axial load on columns.
(1) Load the floor slab adequately, and factor the loads at ultimate limit state, using the appropriate load combination.
(2) Load all the beams that are connected to the column.
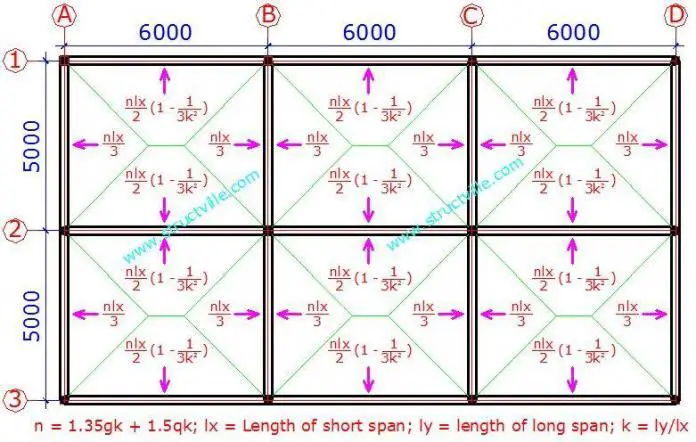
(3) Transfer the loads from slab to the beam using the appropriate relationship. Based on yield lines, the loads are usually triangular or trapezoidal, but this is cumbersome to analyse manually. An equivalent UDL (reasonably accurate) can be used to transfer slab loads to beams by employing the formulas below.
One way slabs Long span q = nlx/2 Short slab q = nlx/5
Two way slabs Long span q = nlx/2(1 – 1/3k2) Short span q = nlx/3
Where; q = Load transferred from slab to the beam n = load at ultimate limit state 1.4gk + 1.6qk (BS 8110) 1.35gk + 1.5qk (Eurocode 2) k = Ly/Lx Ly = Length of long span of slab Lx = Length of short span of the slab
(4) Analyse the floor beams completely using any suitable method of your choice, while also considering any additional load that may be on the beam such as wall load and finishes.
(5) Obtain the support reactions of the beam, which represents the load that is transferred from the floor to the column.
Design Example
In this post, the floor plan shown below is for a shopping complex, and it desired to obtain the column axial loads at ultimate limit state.
Design Data Size of all columns = 230 x 230mm Size of all beams = 450 x 230mm Thickness of slab = 200mm Unit weight of concrete = 25 kN/m3 Unit weight of sandcrete block = 3.47 kN/m2 fck = 25 N/mm2 fyk = 500 N/mm2
Wall load on beam Unit weight of sandcrete block = 3.47 kN/m2 Height of wall = 3.5m Wall load on beam = 3.47 kN/m2 × 3.5m = 12.145 kN/m
Load on Beams External Longitudinal beams (Axis 1:A-D and Axis 3:A-D) Self weight of beam (factored) = 1.35 × 0.23m × 0.25m × 25 = 1.94 kN/m Load from slab = nlx/2(1 – 1/3k2) = [(16.6 × 5)/2] × (1 – 1/(3 ×1.22)) = 31.893 kN/m Load from block work = 12.145 kN/m Total load = 45.978 kN/m
External Transverse beams (Axis A:1-3 and Axis D:1-3) Self weight of beam (factored) = 1.35 × 0.23m × 0.25m × 25 = 1.94 kN/m Load from slab = nlx/3 = (16.6 × 5)/3 = 27.667 kN/m Load from block work = 12.145 kN/m Total load = 41.752 kN/m
Internal Longitudinal Beam (Axis 2:A-D) Self weight of beam (factored) = 1.35 × 0.23m × 0.25m × 25 = 1.94 kN/m Load from slab = nlx/2(1 – 1/3k2) = [(16.6 × 5)/2] × (1 – 1/(3 ×1.22)) = 2 × 31.893 kN/m = 63.786 kN/m (we multiplied by two because this beam is receiving slab load from two directions.) Load from block work = 0 (there are no block works inside the building) Total load = 65.726 kN/m
Internal Transverse beams (Axis B:1-3 and Axis C:1-3) Self weight of beam (factored) = 1.35 × 0.23m × 0.25m × 25 = 1.94 kN/m Load from slab = nlx/3 = (16.6 × 5)/3 = 2 × 27.667 kN/m = 55.334 kN/m (slab load is coming from two directions) Load from block work = 0 Total load = 57.274 kN/m
Structural Analysis A little consideration will show that the support reactions for the floor beams (equal spans) can be obtained by considering the shear force coefficients given below;
Fig 3: Shear force coefficient (2 – span beam)
Fig 4: Shear force coefficient (3 span beam)
Load Analysis of Column A1 1st Floor Load from longitudinal roof beam (1:A-D) = 0.4 × 10.35 kN/m × 6m = 24.84 kN Load from transverse roof beam (A:1-3) = 0.375 × 10.35 kN/m × 5m = 19.41 kN Self weight of column = 6.695 kN Total = 50.945 kN
As you can see, that was very straightforward with the use of shear force coefficients, given the fact that the beams were of equal span. When the beams are not equal, you have to carry out the analysis, and transfer the shear forces accurately. Now, let us compare load analysis of column B2, by the tributary area method.
Pile load test is the most reliable method of estimating the load carrying capacity of a pile, but it is rather expensive. Load tests are performed on-site on test piles to verify the design capacity of the piles. A pile load test consists of applying increments of static load to a test pile and measuring the settlement of the pile. The load is usually jacked onto the pile using either large dead weight or a beam connected to uplifts anchor piles to supply reaction for the jack. Load tests could be by constant rate of penetration test (CRP) or maintained load Test (ML).
In arriving at the ultimate load of a pile from pile load test, several definitions of failure have been given some of which are as follows;
(1) Terzaghi (1942) says that a failure load is that which causes a settlement equal to 10% of the pile diameter.
(2) The CP 2004 defines failure load as that load at which the rate of settlement continues undiminished without further increase increment of load unless this rate is so slow as to indicate that this settlement may be due to consolidation of the soil. This definition is a bit difficult to apply in practice especially in cohesive soils.
(3) German DIN 4026 defines failure load as that load which causes irreversible settlement at the pile head equal to 2.5% of the pile diameter.
Design Example
It is desired to estimate the number of piles in a group of piles to carry the following loads;
Pile load test has been carried out on 3 piles on the site and the result is as shown below. The piles are 750mm diameter and 15m long. Assume settlement of 10% of the pile diameter as failure criterion.
Solution
(1)The ultimate resistance of the pile is the load at settlement of 10% of the pile diameter.
Settlement = 750 × (10/100) = 75mm
(2) From the load settlement graph for each pile;
Pile 1 Rm = 4156.25 KN
Pile 2 Rm= 4318.325 KN
Pile 3 Rm = 4887.8 KN
(3) The mean and minimum measured pile resistances are;
Rm,mean = 4454.125 KN
Rm,min = 4156.25 KN
(4) The characteristic pile resistance is obtained by dividing the mean and minimum measured pile resistances by the correlation factors ξ1 and ξ2 and choosing the minimum value. The equation below is given by equation 7.2 of Eurocode 7.
For 3 number of test piles (Table A9, EC7);
ξ1 = 1.20
ξ1 = 1.05
For a single pile;
DA1.C1 Rc,d = Rc,k/γt = 3711.77/1.15 = 3227.62 KN
DA1.C2 Rc,d = Rc,k/γt = 3711.77/1.5 = 2474.513 KN
Assuming no pile group effect, for n piles,
Resistance = n × Rc,d
Hence,
DA1.C1 n ≥ Fc,d/Rc,d = 7470/3227.62 = 2.31
DA1.C2 n ≥ Fc,d/Rc,d = 5862/2474.513 = 2.36
Therefore, DA1.C2 controls, and 3 number of piles will be required.
Since the R3 recommended partial resistance factor is 1.0, there is no margin for safety on the resistance provided. Therefore this cannot be used for the design.
Summary
3 Number of 750mm diameter piles is suitable for the load at ultimate limit state.
Thank you for visiting Structville today, and we will look at other aspects of pile design in our subsequent posts.
For the continuous beam loaded as shown above, it is desired to find the bending moments at the critical points using force method (method of consistent deformations) and Clapeyron’s theorem (3 Moment Equation). We should however note that both methods are force methods (flexibility method) since we generally solve for unknown forces.
Solution
(1) By force method
Degree of static indeterminacy neglecting horizontal forces and reactions.
D = 2m + r – 2n
D = 2(3) + 4 – 2(4) = 2
Therefore the structure is indeterminate to the 2nd order.
Basic System
A basic system is a system that is statically determinate and stable. This obtained by removing the redundant supports at A and B, and replacing them with unit loads. See the figure below.
Case 1
Bending moment on the basic system due to vertical unit virtual load at support A
Case 2
Bending moment on the basic system due to unit virtual load at support B
Case 3
Bending moment due to externally applied load on the basic system;
Tiles are hard-wearing thin plates that are used for covering walls, floors, roofs, countertops, etc in a building. They can be manufactured from a wide variety of materials such as ceramics, wood, natural stones, baked clays, glass, etc. The process of arranging and laying tiles on a surface is known as tiling. The aim of this article to provide guidelines that must be followed in order to achieve good and quality tiling in a building. This applies to both walls and floors.
Tiles usually provide final finishes to a surface such that the surface no longer requires any additional screeding, plastering, or painting. Therefore, tiles as a final surface finish should be elegant, neatly arranged, beautiful, and durable. As a matter of a fact, the type and quality of tiles installed in a building play a huge role in the final aesthetics of a building.
Tile is a good choice of finish for floors, walls, countertops, etc for a lot of reasons. They come in a variety of colours, shapes, sizes, and quality. This gives architects and interior designers enough flexibility to obtain a balanced and pleasing appearance.
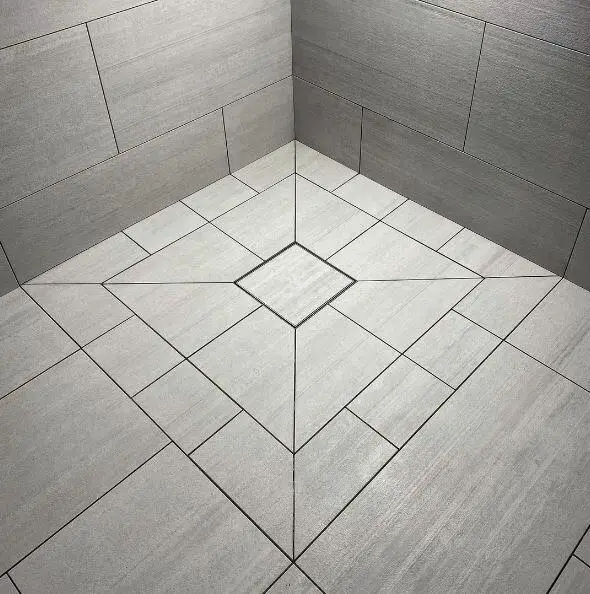
Fig 1: Neat tiling work around a floor drain
Let us look at the most common types of tiles available;
Ceramic tiles Ceramic tiles are produced by taking mixtures of clay, earthen elements, powders, and water and pressing them into the desired shape at a high temperature. There are two popular types of ceramic tiles, and they are porcelain and vitrified tiles.
Porcelain tiles Porcelain tiles are hard, dense, ceramic tiles with low water absorption. The most popular type is the glazed porcelain tiles, even though it may be unglazed. Porcelain tiles can be polished and made to shine without glazing due to their hardness and density. Furthermore, due to their higher density when compared with other tiles, they are usually heavier and more difficult to cut and drill through. Porcelain tiles can be used in dry or wet areas of a building.
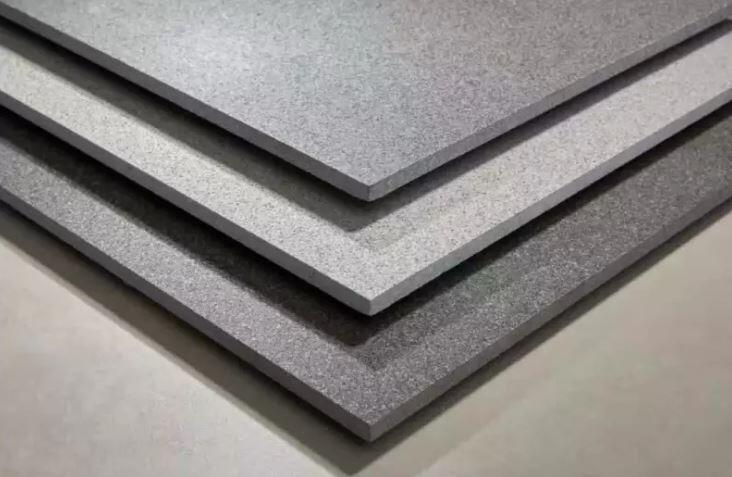
Fig 2: Polished porcelain tile
Vitrified tiles Vitrified tiles are less dense ceramic tiles with higher water absorption. They are produced by the hydraulic pressing of a mixture of clay, quartz, feldspar, and silica, which make the vitreous surface. It however very important that the type of vitrified tile be clearly specified.
Full-body vitrified tiles have the same pigment throughout the entire thickness. Therefore, when the tiles are chipped or begin to wear out, the colour remains the same. Therefore, full-body vitrified tiles are suitable for high traffic areas. Vitrified tiles can also be glazed, with a lot of designs and surface texture printed on them.
Fig 3: Full body vitrified tiles
Granite tiles Granite tiles are produced from the natural stone ‘granite’ and are very durable and aesthetically-pleasing tiles. Due to the fact that they are produced using natural materials, they have natural flecks and minor differences in shades and pattern. The structure of granite is crystalline, and it contains quartz, mica, and feldspar minerals. This particular mix of minerals creates the unique colors, textures, and pattern movement found in all the different varieties of granite. Granite tiles are very dense and resistant to wear and unnecessary damages.
Fig 4: Granite tiles
Marble tiles Marble is a natural stone that is made by limestone’s metamorphic crystallization that results in the conversion of calcium carbonate into calcite crystals. Their natural composition makes them not to appear uniform but rather have ‘veins’ that are running in irregular patterns across the surface of the tiles. Marbles have high porosity but can be polished to shine, or the surface treated with a sealant. They are luxurious tiles and are actually more expensive. They require more maintenance and cleaning than other types of tiles.
Fig 5: Marble floor tiles
Guidelines for quality tiling
A poorly done tiling work is an economical disaster. Therefore it is very necessary that adequate planning be put in place before any tiling work commences.
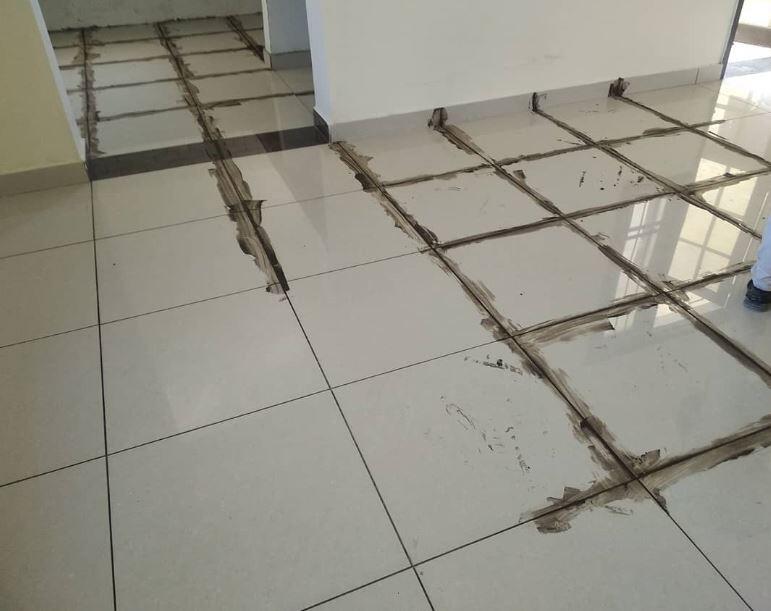
Fig 6: Terrible tiling work
Have you ever gone into a building and instead of your mind being at rest, you will be wondering why the tiler did not follow a definite/regular pattern, or why the grout lines are misaligned? You could spend your whole time there trying to use your mind to fix the tiles so that they will be properly aligned. But that will not be possible. To fix the tiles properly, the existing one will have to be broken and a new one reinstalled at an extra cost.
Fig 7: Ugly tiling work
This is not a good thing because your mind should be relaxed – life has enough puzzles already! On the other hand, once you look at a tiling work and discover a regular pattern/balance, your mind stops evaluating the work in a distressing manner.
Here are the guidelines to follow in order to do good tiling work;
(1) Right quality of materials This cannot be overemphasized. You should select and insist on the best materials. For instance, the tiles to be used should not be chipped at the edges or cracked prior to installation. Depending on the usage of the building and the anticipated human traffic, the appropriate tile thickness and type of tile should be specified.
Full-body vitrified tiles or porcelain tiles will be fantastic for private sitting rooms, while granite tiles could be better for the entrance porch and other areas exposed to the weather or high traffic. Do not use tiles that would wear out easily or get discoloured when subjected to heavy traffic.
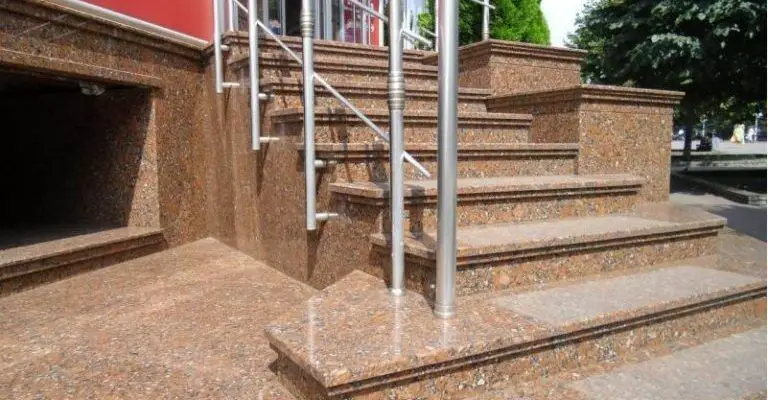
Fig 8: Granite entrance step to a building
Also, it should be ensured that there are no factory defects on the tiles. It is possible to have unequal tiles (with about 1 – 2 mm difference in dimensions) in the same pack. Such tiles are usually problematic to tilers. Also, some tiles are curved in plan or discoloured when supplied. All defective tiles should be rejected. As a matter of fact, you should insist on rectified tiles. Tiles are also classified in grades, usually from grade 1 to grade 5. The proper grade of tile should be specified.
Furthermore, the tile gum (adhesive), fasteners, and cement used for laying the tiles should be of superior quality. The mixing of the cement/adhesive should be of adequate strength, the floor screeding should be standard, and fasteners (when employed) should be well installed. (2) Workmanship Tilers are in grades. Some tilers are more skilled than others in terms of carefulness, use of tools/equipment, experience, and commitment to quality work. Some tilers are so careless when cutting tiles that they cause misalignment of tiles. It takes a lot of patience and commitment to throw down a straight line of tiles along a corridor without any misalignment or uneven grouting space. It is possible to have a straight space of 3mm groove (grouting space) for a length of 50m in the hands of a good tiler.
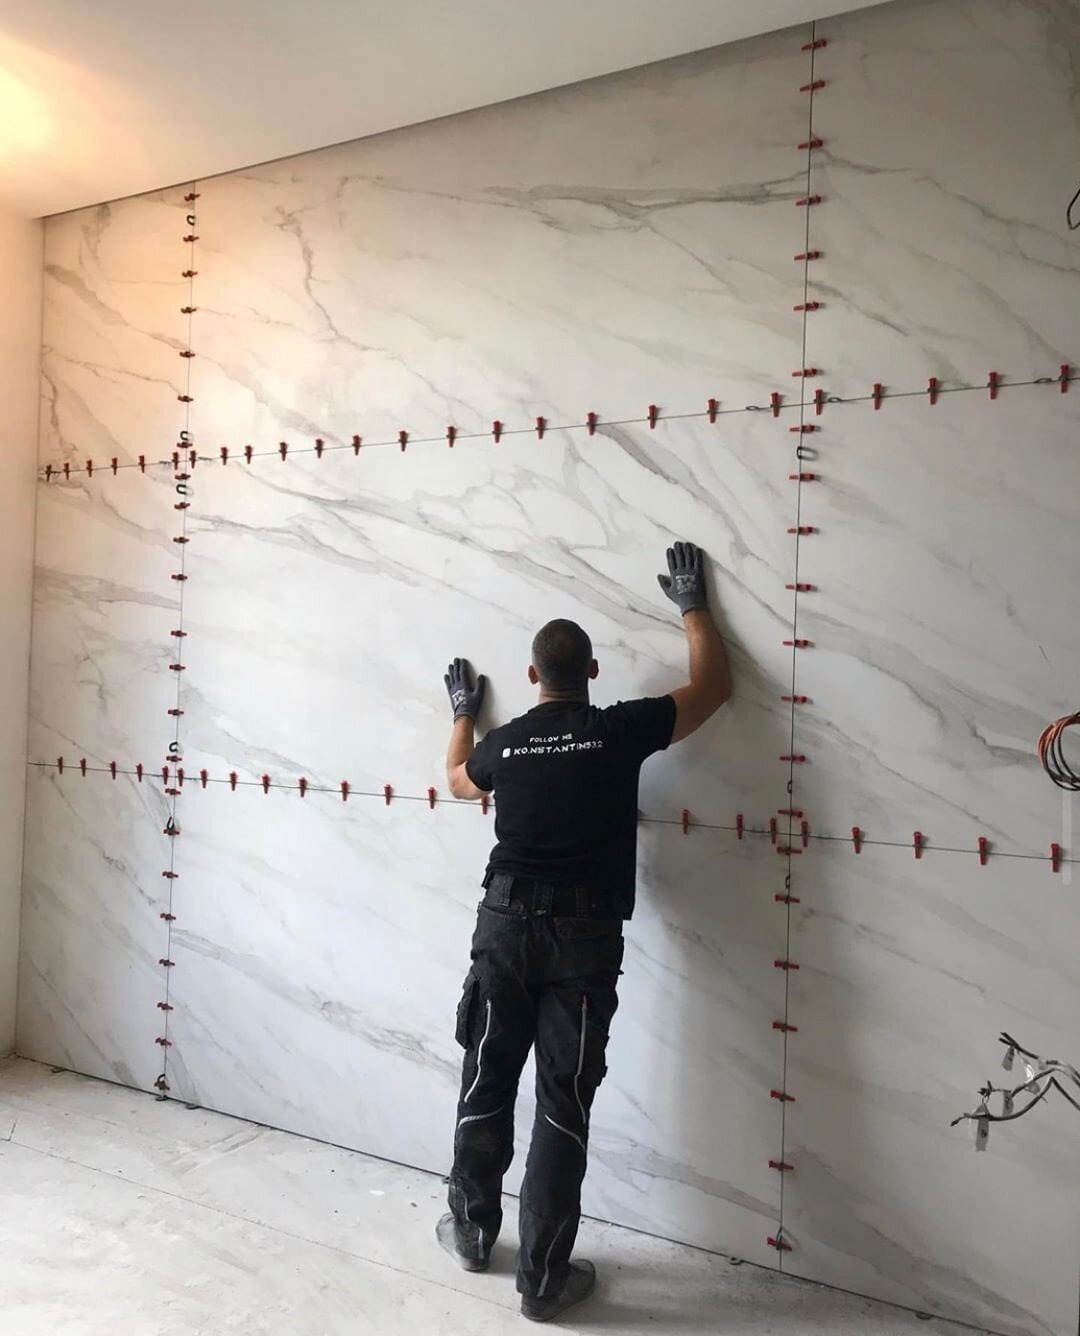
Fig 9: Using spacers to align wall tiles
The tiler should also ensure that the tiles are very level, and not kicking at the joints. Where are openings or recesses for utilities, the tiler should ensure that he cuts neatly. For instance, the use of diamond tile hole cutters can be used for making holes neatly on tiles. The tiler should be patient on the job.
(3) Use the right tools From experience, a lot of poor tiling jobs result from not having the right tools. For instance, there are some recesses that cannot be achieved properly using a manual tile cutter, but electric cutter. The tiler should ensure he has the right tools such as plumbs, spirit levels, laser levels, blue lines, spacers, cutting machines, diamond cutting discs/blades, diamond drill bits, tile trowels, rubber grout float, etc.
Fig 10: Manual tile cutter
(4) Quality of supervision No matter how good a tiler is, his work still needs to be supervised and adequately monitored. Tilers may be forced to do ‘management work’ such as going ahead to install a poorly cut tile due to fatigue or need for speed. The supervisor must watch out for situations like this, and ensure that the tiler sticks to the highest quality.
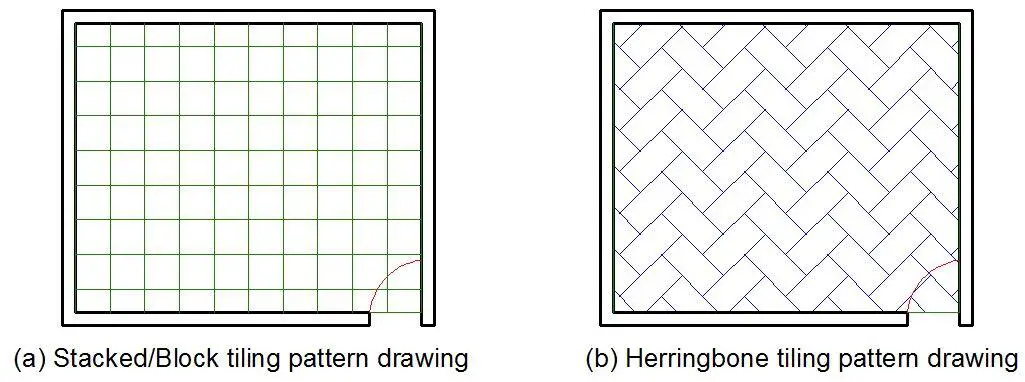
(5) Tiling Pattern/Layout Drawing There are different tiling patterns as may be recommended by the architect. The common types of tiling pattern are;
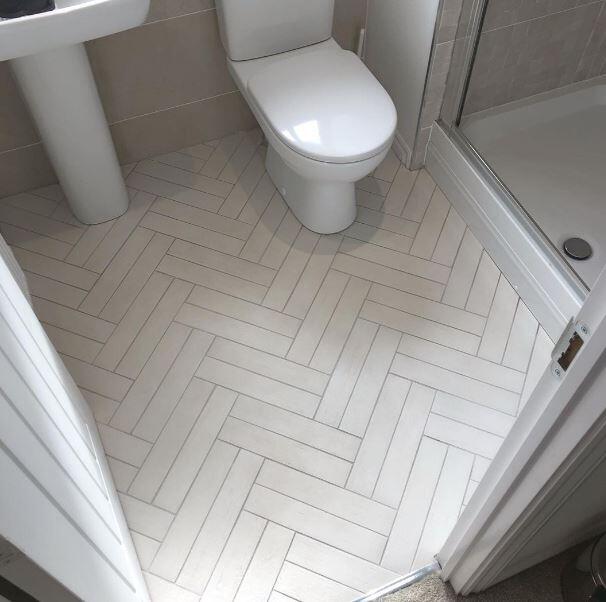
Herringbone pattern
Brickbond (draft) pattern
Block/stacked pattern
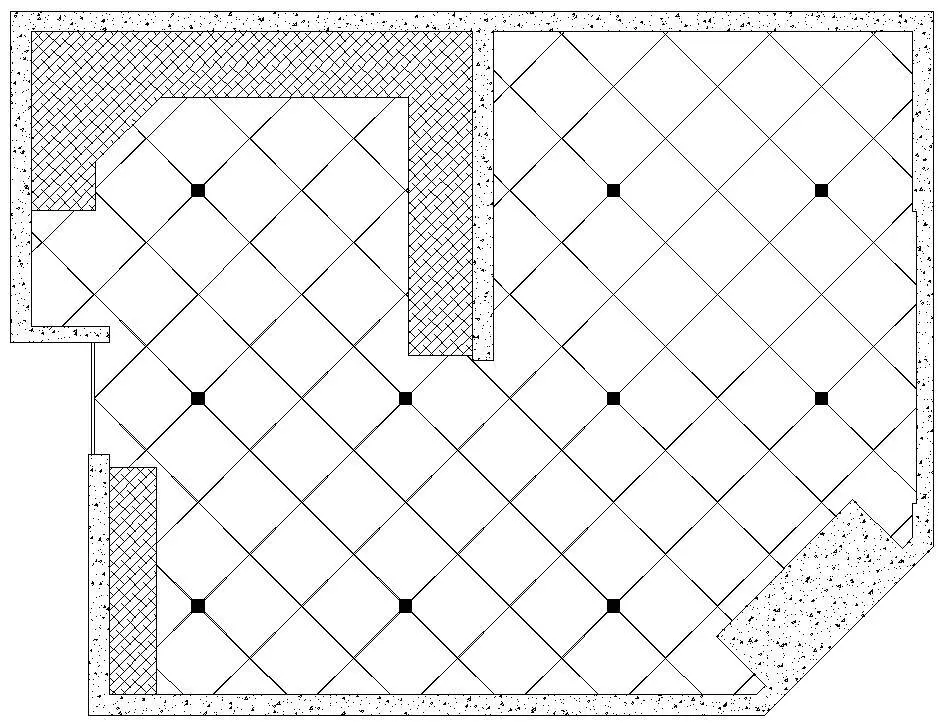
Diagonal pattern
Modular pattern, etc
Fig 11: Typical diagonal tiling layout of a kitchen
There should be a drawing that captures the tiling pattern, relative to the shape of the floor or wall being tiled. This gives the tiler and the contractors a good idea of what to do. The drawing should show the size and orientation of the tiles.
Fig 12: Typical stacked and herringbone tiling layout of a kitchen
Fig 13: Herringbone tiling of a toilet floor
(6) Check for straightness of wall before commencing tiling work This is particularly important because tiling exposes defective works such as lack of straightness of walls. Also, when the edges of the walls are not square, the tiling may not come out well. After checking for the straightness of the wall, the tiler and the supervisor should determine the margin of error, and adopt a corrective approach.
Fig 14: Check for straightness of tiling work
If the margin is small, it can be corrected by varying the thickness of the adhesive. But if it is too large, additional plastering works or demolition can be done to obtain the desired straightness. It is not good to try to manage the situation when the error is too large, because the finished tiling work will be adversely affected.
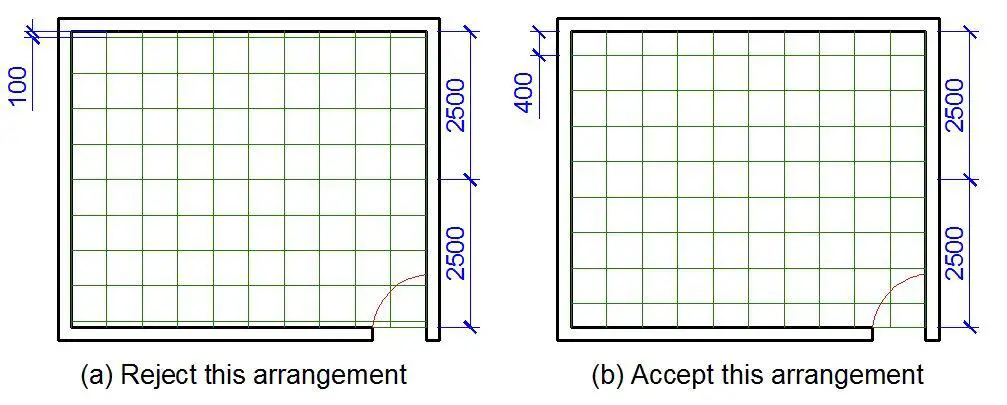
(7) Avoid small offcuts at the edges It is usually very unpleasant to have offcuts less than 100 mm at the edge of walls or floors. In the first place, small offcuts are usually problematic and may lead to excess wastage. On the other hand, they are not pleasing to the eyes.
To achieve this, the tiler has some calculations to do, which usually involves finding the centrelines of the floor/wall to be tiled. Two things are involved, it is either the centreline of the tile plate coincides with the centreline of the floor (Figure 15b), or the groove (spacer/joint) between the adjacent tiles coincides with the centreline of the floor/wall (Figure 15a). Anyone that gives the bigger tile size at the edge should be adopted.
Fig 15: Effects of small off-cuts at the edges
As you can see from Figure 15, option A gave an off-cut of 100 mm at the edges, while option B gave an offcut of 400 mm at the edges. Option B obviously looks better than option A. Tiny off-cuts at the edges do not usually look beautiful. Another advantage of this is that you will have equal offcuts at the two ends. This gives the tiling work a balanced look.
(8) Grouting Grouting is almost as important as the tiling work itself. The grouting material should be non-expansive, and the grouter must be careful and skilled. For wall tiles, it is usually more beautiful when the grouting material does not fill up the groove completely. When the edge of the tiles can be seen, it is actually more attractive. Peradventure you desire to fill the groove completely, it must be very neat. The neatness of grouting is very important if the tiling must be beautiful.
Furthermore, the colour of the grouting cement must be carefully selected.
Fig 16: Grouting of floor tiles
When tiles are to be closely joined (especially in granite or marble tiles), it is very important that the tiles close/join tightly. A little quantity of grouting cement can be used to cover other small gaps that might exist.
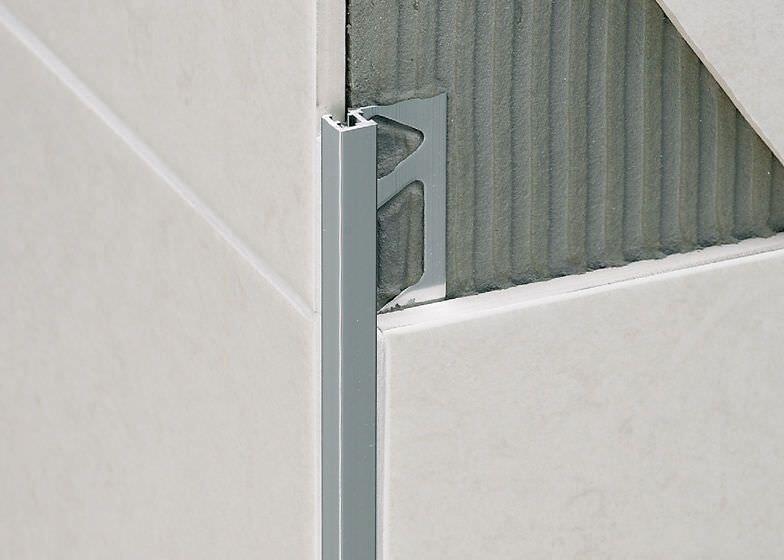
(9) Mitring and use edge trims At exterior edges of elements like columns and walls, it always a good practice to mitre the tiles meeting at the edges so that the joint will close properly. The thickness of the tiles determine whether they can be mitred or not. When the tiles will not be mitred, suitable edge trims should be used. In areas where the edge of tiles must be exposed, it is better to expose the factory edge than the cut edge.
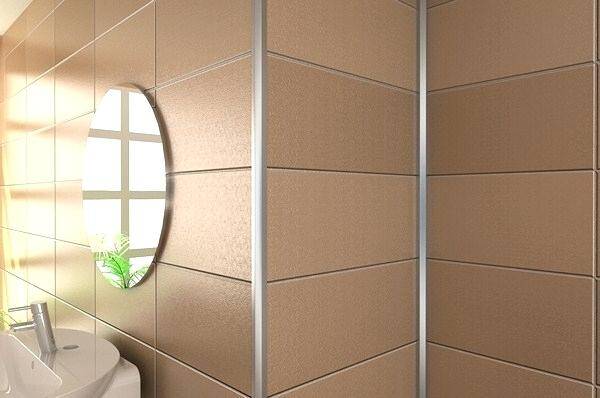
Edge trims can be made of aluminium, stainless steel, or plastics.
Fig 17: Installation of edge trim
Fig 18:Neatly installed edge trim in a convenience room
These guidelines when followed usually results in a good tiling work. Feel free to add yours at the comment section.
Influence lines are plots that are used to obtain the static effects of moving loads on structures such as bridges and cranes. In practice, they show the response of a structure as a unit load moves across it.
The unit load effects are later related to the actual load on the structure during the design. The action effects that can be evaluated at any section of a structure using influence lines are support reactions, internal stresses (bending, shear, axial), and deflections.
If the influence line for a structure is adequately plotted with respect to a particular section, you can obtain the desired effect of the load on any part of the structure once the moving load is at that section. This article will be dedicated to simple and compound statically determinate beams with overhangs.
Influence Lines for Statically Determinate Beams
Let us consider the beam loaded as shown below. It is desirous to obtain the influence line for the support reactions, and for the internal stresses with respect to section 1-1.
In all cases, we will be taking P as unity (i.e 1.0)
(1) Influence line for support reactions
Support A Support reaction at point A (FA) = (L – x)/L At x = -L1; FA = (L + L1)/L
At x = 0; FA = 1.0
At x = L + L2; FA = (L – L – L2)/L = – L2/L
Support B Support reaction at point B (FB) = x/L At x = -L1; FB = -L1/L
At x = 0; FB = 0
At x = L; FB = 1.0
At x = L + L2; FB = (L + L2)/L
(2) Influence line for bending moment with respect to section 1-1
(0 ≤ x ≤ a) M1-1 = FA.a – P(a – x) M1-1 = [P(L – x).a]/L – P(a – x) But taking P = 1.0; = [(L – x).a]/L – (a – x)
At x = -L1; M1-1 = [(L + L1).a]/L – (a + L1) = [L1(a – L)/L] = -L1.b/L
At x = 0; M1-1 = [(L – 0).a]/L – (a – 0) = [L1(a – L)/L] = 0
At x = a; M1-1 = [(L – a).a]/L – (a – a) = [L1(a – L)/L] = a.b/L
(a ≤ x ≤ L) M1-1 = [P(L – x)a]/L
At x = a; M1-1 = [(L – a)a]/L = a.b/L
At x = L; M1-1 = [(L – L)a]/L = 0
At x = L + L2; M1-1 = [(L – L – L2)a]/L = – L2a/L
(2) Influence line for shear with respect to section 1-1 (0 ≤ x ≤ a) Q1-1 = P(L – x)/L – P = – FB = –x/L
At x = -L1; Q1-1 = L1/L
At x = 0; Q1-1 = 0
At x = a; Q1-1 = -a/L
(a ≤ x ≤ L) Q1-1 = -(P.x)/L + P = (L – x)/L
At x = a; Q1-1 = b/L
At x = L; Q1-1 = 0
At x = L + L2; Q1-1 = [(L – L – L2)]/L = -L2/L
Influence Line for Compound Beams
In the influence line analysis of compound beams, it is always advantageous to decompose the beams into simple beams at the location of the internal hinges. A little consideration of the analysis below will show that it largely built off from the analysis of the simple versions as was done above.
The simple logic is to pick the section under consideration and plot the influence line disregarding other adjacent beams. After drawing the diagram accurately, you can now use your ruler and draw your straight line towards the next support or internal hinge. All other values can be determined from the similar triangles rule. Note that whenever your influence line gets a zero value at an internal hinge, the influence line terminates.
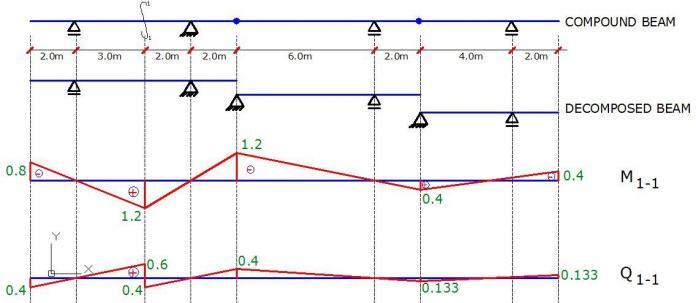
The figure below shows the influence line for internal stresses at section 1-1 when the load travels through the compound beam.
Interact with the structville community on facebook for more knowledge and information at www.facebook.com/structville
Inclined beams (often called raker beams) are often found in structures like pedestrian bridges, ramps, staircases, stadiums, etc. Due to their geometry, these beams are often subjected to bending moment, shear force, and axial force. For indeterminate raker beams, it is not uncommon to see the axial forces varying from tension to compression.
[the_ad id=”498″]
The analysis and design of such elements have been presented here using Eurocode 2. For the inclined rectangular raker beam loaded as shown below, we are to fully analyse and design the structure at ultimate limit state.
Design Information
Dimensions = 600 × 300mm
Concrete cover = 40mm
Yield strength of reinforcement = 500 N/mm2
Grade of concrete = 35 N/mm2
Geomterical Properties of the structure Length of AB = Length of BC = 7/cos 25 = 7.7236m
cos 25 = 0.9063
sin 25 = 0.4226
At ultimate limit state, load on beam
PEd = 1.35Gk + 1.5Qk = 1.35(25) + 1.5(5) = 41.25 kN/m
Analysis of the structure by slope deflection method
Kindly verify that the axial force diagram for this structure is given by;
Structural Design Span
MEd = 172.102 KN.m
Effective depth (d) = h – Cnom – ϕ/2 – ϕlinks
Assuming ϕ16 mm bars will be employed for the main bars, and ϕ10mm bars for the stirrups (links)
d = 600 – 40 – 8 – 10 = 542 mm
Since Actual L/d < Limiting L/d, deflection is satisfactory.
Support B
MEd = 238.944 KN.m
Effective depth (d) = h – Cnom – ϕ/2 – ϕlinks
Assuming ϕ16 mm bars will be employed for the main bars, and ϕ8mm bars for the stirrups (links)
d = 600 – 40 – 8 – 10 = 542 mm
k = MEd/(fckbd2) = (238.944 × 10⁶)/(35 × 300 × 5422) = 0.0775
Since k < 0.167, no compression reinforcement required
z = d[0.5+ √(0.25 – 0.882K) ]
z = d[0.5+ √(0.25 – 0.882(0.0775))] = 0.926d
As1 = MEd/(0.87fyk z) = (238.944 × 10⁶)/(0.87 × 500 × 0.926 × 542) = 1094 mm2
Provide 6H16 mm TOP (ASprov = 1206 mm2)
Shear Design (Support A)
VEd = 113.436 kN
NEd = 67.323 KN (compression)
We are going to anchor the 4No of H16mm reinforcement provided fully into the supports.
Question
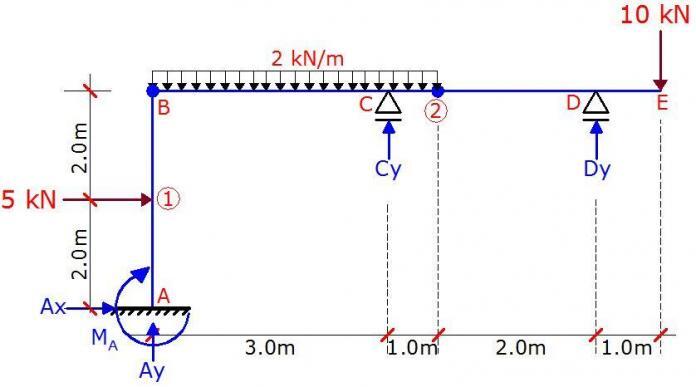
A frame is loaded as shown above. There are internal hinges at nodes B and 2. Plot the internal stresses diagram due to the externally applied load. Solution
Check for static determinacy.
A quick but non-general way of verifying degree of static indeterminacy of simple frames is;
D = R – e – S
where;
D = Degree of static indeterminacy
R = Number of support reactions = 5
e = Number of static equilibrium equations = 3
S = Number of special condition = 2 ( internal hinges)
Let ∑MBB = 0
Note that the due to the direction of the horizontal reaction A, it will exert a positive moment about column AB. Therefore;
4Ax – (5 × 2) – MA = 0
4(5) – 10 = MA
MA = 10 KN.m
Fig 1: Support Reactions Due to Externally Applied Load
Analysis of Internal forces Section A – 1 (0 ≤ y ≤ 2.0m)
(i) Bending Moment
My = 5y – 10 ———— (1) At y = 0;
MA = -10 kNm At y = 2.0m;
M1B = 5(2) – 10 = 0
(ii) Shear Force
The section is subjected to constant shear force;
Qx = ∂My/∂y = 5 KN
(iii) Axial Force
Ny + 4.333 = 0
NA-1 = -4.333 KN (compression)
Section 1 – B (2.0m ≤ y ≤ 4.0m)
(i) Bending Moment
My = 5y – 5(y – 2) – 10 ———— (2) At y = 2m;
M1UP = 5(2) – 10 = 0 At y = 4.0m;
MBB = 5(4) – 5(2) – 10 = 0
This shows that there is no bending moment at this section.
(ii) Shear Force
Differentiating equation (1) above yields zero. Therefore, there is shear force at the section also.
(iii) Axial Force
Ny + 4.333 = 0
N1-B = -4.333 KN (compression)
Section B – C (0 ≤ x ≤ 3.0m)
(i) Bending Moment
Mx = 4.333x – x2 ———— (3) At x = 0;
MBR = 0 At x = 3.0m;
MCL = 4.333(3) – (3)2 = 4 KNm
Maximum moment occurs at the point of zero shear. Therefore;
Qx = ∂Mx/∂x = 4.333 – 2x = 0
On solving; x = 4.333/2 = 2.1665m
Mmax = 4.333(2.1665) – (2.1665)2 = 4.693 KNm
(ii) Shear Force
The section is subjected to constant shear force;
Qx = ∂Mx/∂x = 4.333 – 2x
At x = 0;
QBR = 4.333 KN At x = 3.0m;
MCL = 4.333 – 2(3) = -1.667 KN
(iii) Axial Force
Nx = 0
No axial force
Section C – 2 (3.0m ≤ x ≤ 4.0m)
(i) Bending Moment
Mx = 4.333x – 1.333(x – 3) – x2 ———— (4) At x = 3m;
MCR = 4.333(3) – 32 = 4 KNm At x = 4.0m;
M2 = 4.333(4) – 1.333(1) – (4)2 = 0
(ii) Shear force
Expanding equation (4) above;
Mx = –x2 + 3x + 4
Qx = ∂Mx/∂x = -2x + 3
At x = 3m
QCR = -2(3) + 3 = -3 KN At x = 4m
Q2L = -2(4) + 3 = -5 KN
(iii) Axial Force
No axial force
Section D – E (0 ≤ x ≤ 1.0)
(i) Bending Moment
Mx = -10x ————— (5)
At x = 0;
ME = 0 At x = 1.0m;
MCL = -10(1) = -10 KNm
(ii) Shear Force
Qx = ∂Mx/∂x = -10 KN
But since we are coming from the right to the left, downward force is positive.
Therefore the section subjected to a positive constant shear force of 10 KN
(iii) Axial force
There is no axial force at the section
Internal Stresses Diagram
We can now plot the internal stresses diagram from the values obtained above.
Fig 2: Final Bending Moment Diagram
Fig 3: Final Shear Force Diagram
Fig 4: Final Axial Force Diagram
Thank you for visiting Structville today.
Join our exciting facebook interactive page at www.facebook.com/structville
Imperfection in structures can be described as deviations and inconsistencies in structures and structural members, which can affect the behaviour of the structure from the theoretically assumed perfect state. Imperfections in structures are often envisaged during analysis, and their effects are taken into consideration, especially in cases where they could be critical.
Types of Imperfections
Different types of imperfections are considered in structural analysis and they are;
(i) Geometrical imperfection (ii) Material imperfection (iii) Structural imperfection
Geometrical Imperfection
As the implies, these are imperfections due to variance in the dimensions of the members, or lack of straightness or verticality in a structural member.
For example, when a beam member that is supposed to be 400mm depth is finished as 395mm, then this is geometric imperfection. According to clause 5.2(1)P of Eurocode 2, deviation in members cross-section is normally taken into account in material partial factor of safety, and may not need to be analysed for again.
Also, when a 2-storey framed building that is supposed to be perfectly straight/vertical is leaning by say an angle of 3 degrees, this is also geometric imperfection. This form of geometric imperfection is taken into account when analysing sensitive structures.
Material imperfection
This type of imperfection always arises from deviation in the assumed material properties. For instance, if the design engineer specified a concrete grade of M30, and grade 28.5 was achieved on site, then this is material imperfection. Also, when the modulus of elasticity of steel specified was 200 kN/mm2 and 195 kN/mm2 was fabricated, this is also material imperfection. Another variance in material imperfection is residual stresses, which occurs in steel members during welding or fabrication.
Material imperfection is often taken care of by introducing material factor of safety in design.
Structural Imperfection
Structural imperfection often arises in structures due to issues like eccentricity in joints, variations in support/boundary conditions, variation in stiffness/rotation of joints.
Analysis of Imperfections in Structures
In frames, all types of imperfections are usually introduced as equivalent geometrical imperfections with increased value of amplitude e0d, while in plated structures, geometric imperfections and residual stresses are introduced to derive buckling factors.
According to clause 5.3.1(1) of Eurocode 3, the following imperfections should be taken into account;
a) global imperfections for frames and bracing systems b) local imperfections for individual members
Global imperfections for frames or bracing systems cover for lack of verticality for frames or straightness of structures restrained by bracings, while local imperfections cover for lack of straightness or flatness of a member and residual stresses of the member.
We should note that other imperfections are covered by the partial factors in limit state design.
Global Imperfection Analysis for frames
In framed structures, the assumed shape of global imperfection may be derived from the elastic buckling mode of the the structure in the plane considered. For frames sensitive buckling in sway mode (e.g. tall buildings), the effect of imperfection is allowed for by means of equivalent imperfection in the form of an initial sway imperfection.
The effects of initial sway imperfection may be replaced by systems of equivalent horizontal forces. These initial sway imperfections are applied in all relevant horizontal directions, but need only be considered in one direction at a time. For multi-storey buildings, equivalent forces are used and they should be applied at each floor and roof level.
The imperfections may be determined from;
ϕ = ϕ0αhαm where; ϕ0 is the basic value = 1/200
αh is the reduction factor for height applicable to columns αh = 2/√h but 2/3 ≤ αh ≤ 1.0
αm is the reduction factor for number of columns in a row
where m is the number of columns in the row.
A schematic diagram showing the representation of sway imperfections with equivalent horizontal loads is shown below;
According to clause 5.3.2(4)B, building frames sway imperfections may be disregarded whenever HEd ≥ 0.15 VEd
Solved Example
Let us carry out the global sway imperfection of the frame loaded as shown below.
Therefore, At the roof level, imp1 = ϕV1 = 0.00272 × (25 + 65 + 25) = 0.3128 kN At the second floor, imp2 = ϕV2 = 0.00272 × (70 + 126 + 70) = 0.7235 kN At the first floor, imp3 = ϕV3 = 0.00272 × (145 + 209 + 145) = 1.357 kN
These imperfections belong to each cross frame (bay). For the double bay frame in our example, the imperfection will need to be doubled;
Analysing the structure using StaadPro;
Analysis Results The moment diagram below is for the external load only without the effect of imperfections.
The moment diagram below is for external load with the effect of imperfection inclusive.
Analysis of results Maximum Moment on ground floor column without the effect of imperfection (column at RHS) = 99.979 kNm Maximum Moment on ground floor column with the effect of imperfection (column at RHS) = 109.048 kNm
This is about an 8.316% difference in the bending moment value.
A little consideration will show that for axial loads also; Maximum axial load without the effect of imperfection (middle column) = 398.394 kN Maximum axial load with the effect of imperfection (middle column) = 398.383 kN
This shows that these imperfections have more effect on the bending moment of the structure than on the axial load.
For shear force on the columns, a difference of about 8.123% was observed.
According to clause 4.1 of EN 1992-1-1:2004, a durable structure should meet the requirements of serviceability, strength and stability throughout its design working life, without significant loss of utility or excessive unforeseen maintenance.
Fig. 1: Typical Carbonation Problem Leading to Lack of Durability in a Reinforced Concrete Structure
The required protection of any structure is established by considering the intended use of the structure, the design working life, maintenance programme, significance of possible direct and indirect actions, environmental conditions etc. Environmental conditions that can be considered may include storage of aggressive chemicals, chlorides in the concrete, acid solutions, alkali-aggregate reactions etc which are generally categorised as chemical attacks. Issues like abrasion, water penetration, temperature change etc are categorised as physical attacks.
According to clause 4.3 of Eurocode 2, in order to achieve the required design working life of a structure, adequate measures shall be taken to protect each structural element against the relevant environmental actions. The requirements for durability shall be included when considering the following:
Structural conception,
Material selection,
Construction details,
Execution,
Quality Control,
Inspection,
Verifications,
Special measures (e.g. use of stainless steel, coatings, cathodic protection).
An important aspect of durability of reinforced concrete structure is the anticipated exposure of the element under consideration. Some exposure conditions are given in the table below (Table 4.1 of EN 1992-1-1:2004);
2.0 Concrete Cover
Concrete cover is the distance between the surface of the reinforcement closest to the nearest concrete surface (including links and stirrups and surface reinforcement where relevant) and the nearest concrete surface.
Concrete cover is defined as a minimum cover, cmin, plus an allowance in design for deviation, Δcdev;
cnom = cmin + Δcdev ———- (1)
Minimum concrete cover, cmin, shall be provided in order to ensure the safe transmission of bond forces, protection of the steel against corrosion (durability) and for an adequate fire resistance.
The greater value for cmin satisfying the above mentioned requirements shall be used. This is given by;
where;
cmin,b is the minimum cover due to bond requirement
cmin,dur is the minimum cover due to environmental conditions
Δcdur,γ is for additive safety element
Δcdur,st is the reduction of minimum cover for use of stainless steel
Δcdur,add is the reduction of minimum cover for use of additional protection
In order to transmit bond forces safely and to ensure adequate compaction of the concrete,
the minimum cover should not be less than cmin,b given in Table 4.2 of EN 1992-1-1:2004 and given in Table 2 below;
The cover due to environmental conditions (durability) is given in the table below; (Table 4.4 EN 1992-1-1:2004).
3.0 Solved Example
Design the concrete cover of an external reinforced concrete beam.. The concrete in use has resistance class C30/37.
Bottom longitudinal bars are H16; the stirrups are H8
The max aggregate size is: dg = 20 mm (< 32 mm).
The design working life of the structure is 50 years.
Normal quality control is put in place.
Solution
From table 4.1 of EN 1992-1-1:2004, the appropriate exposure class is XC3 (assuming the beam is sheltered from rain).
The recommended structural class (design life of 50 years) is S4.
First, the concrete cover for the stirrups is calculated.
Since the cover for stirrups is more critical, the actual concrete cover for the main longitudinal bars is 35 + 8 = 43mm
NOTE:
According to Clause 4.4.1.2(9), where in-situ concrete is placed against other concrete elements (precast or in-situ) the minimum concrete cover of the reinforcement to the interface may be reduced to a value corresponding to the requirement for bond provided that:
– the strength class of concrete is at least C25/30,
– the exposure time of the concrete surface to an outdoor environment is short (< 28 days),