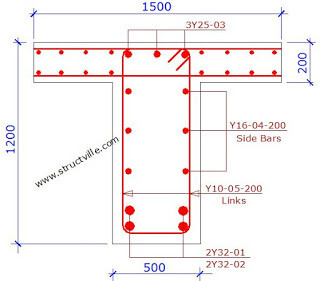
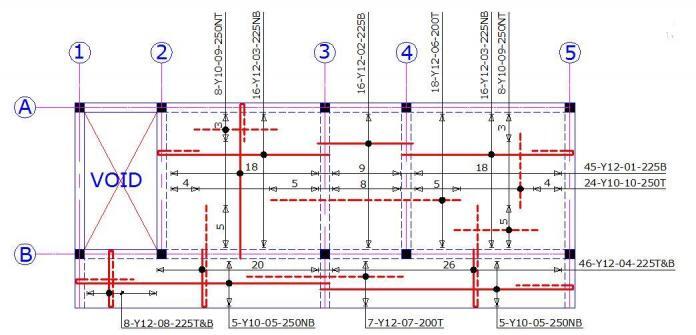
A section of a beam profile is shown above. BASED ON THE GIVEN DATA ONLY AND WITHOUT MAKING ANY ASSUMPTIONS, identify the technical error(s) in the section detailing using BS 8110-1:1997 recommendations? Read the hints below carefully!
Data
Figured dimensions are in mm
Concrete cover at the sides and the soffit = 40 mm
Concrete cover at the top = 30 mm
Strength of reinforcement = 460 N/mm2
Strength of concrete = 35 N/mm2
Section is at mid-span (sagging moment)
Area of tension reinforcement required = 2960 mm2
Hints: (1) This post is for educational purposes, hence, your reply is better dropped here on Structville as a comment so that every person accessing the post from different platforms can see the reply. (2) Please, do not guess. If you identify the error(s), kindly drop your comment, otherwise, keep checking back for other people’s replies. Do not post your guesses. (3) If you are not familiar with BS 8110-1:1997, but you identify any error based on the code that you are familiar with, kindly state the code, and the error you discovered. Try to be technical in your explanations, or quote the requirement as given in the code. (4) The diagram is not to scale, so use the figured dimensions only. Also, do not call on any data or information that is not provided. (5) Let your explanations be offered with love. We believe that knowledge is power.
Kindly tag all structural engineers you know and/or forward this post to them.
Beams that are curved in plan are often found in buildings, circular reservoirs, bridges, and other structures with curves. Curved beams always develop torsion (twisting) in addition to bending moment and shear forces because the center of gravity of loads acting normal to the plane of the structure lies outside the lines joining its supports. Therefore to maintain equilibrium in the structure, the supports of a curved beam must be fixed or continuous.
In this post, we are going to show in the most simplified manner, how to analyse continuous circular (ring) beams.
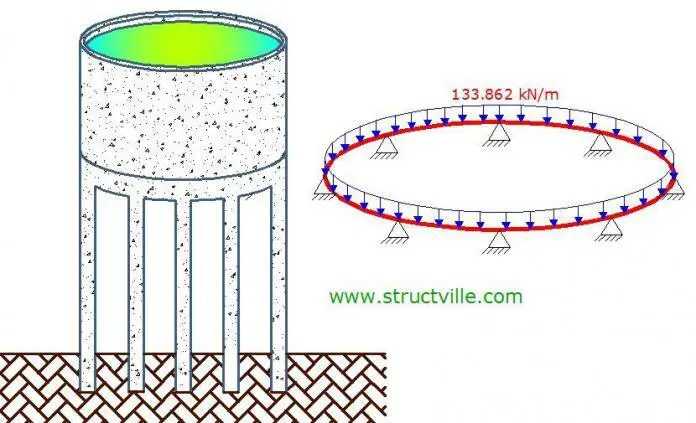
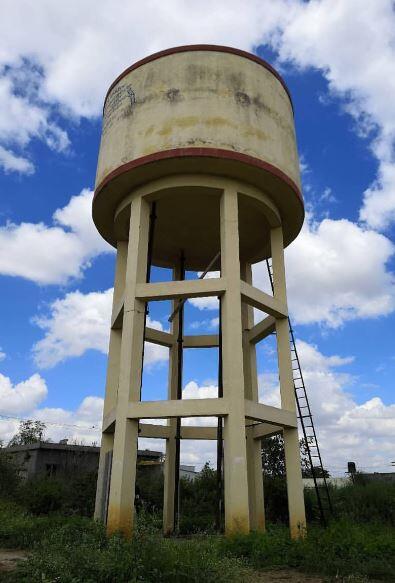
Circular beam supporting an overhead water tank
For ring beams; Maximum Negative Moment at any support = K1wr2 Maximum Positive Moment at any span = K2wr2 Maximum Torsional Moment = K3wr2 Total load on each column (support reaction) R = wr(2θ)
Shear force at any support = R/2 = wrθ
The coefficients are given in the table below;
Source: Table 21.1, Hassoun and Al-Manaseer (2008)
Solved Example A cylindrical reservoir with a diameter of 6m is supported by a ring beam, which is supported on 8 equidistant columns. It is desired to analyse and design the ring beam to support the load from the superstructure.
The plan view of the structural disposition of the reservoir is shown below;
Load Analysis (a) Geometry of sections Dimension of beams = 450mm x 300mm Dimension of column = ϕ300mm circular columns Thickness of reservoir walls = 250mm Thickness of reservoir slab = 250mm
(b) Density of materials Density of stored material = 10 kN/m3 Density of concrete = 25 kN/m3
(c) Dead Loads Weight of the walls = (25 kN/m3 × 0.25m × 4.75m × 18.849m) = 559.579 kN Weight of bottom slab = (25 kN/m3 × 0.25m × 28.274m2) = 176.7125 kN Weight of water stored = (10 kN/m3 × 4.5m × 23.758m2) = 1069.11 KN Total = 1805.4015 kN
Let us transfer this load to the the ring beam based on the perimeter.
Perimeter of ring beam = πd = π × 6 = 18.849m
w = 1805.4015 kN / Perimeter of ring beam = 1805.4015 kN / 18.849m = 95.782 kN/m
Self weight of the beam = 25 kN/m3 × 0.3m × 0.45m = 3.375 kN/m
Total dead load on beam = 95.782 kN/m + 3.375 kN/m = 99.157 kN/m
Factoring the load on the beams at ultimate limit state = 1.35 × 99.157 kN/m = 133.862 kN/m
From the table above; Number of supports (n) = 8 θ = π/n = 45° K1 = 0.052 K2 = 0.026 K3 = 0.0040 Radius (r) = 3m
Maximum Negative Moment at the supports = K1wr2 = -0.052 × 133.862 × 32 = -62.647 KN.m
Maximum Positive Moment at the spans = K2wr2 = 0.026 × 133.862 × 32 = 31.323 KN.m
Maximum Torsional Moment = K3wr2 = 0.0040 × 133.862 × 32 = 4.819 KN.m
Shear force at the supports = R/2 = wrθ = 133.862 × 3 × (π/8) = 157.7 KN
Structural Design Design strength of concrete fck = 35 N/mm2 Yield strength of reinforcement fyk = 500 N/mm2 Nominal cover to reinforcement = 30 mm
Span MEd = 31.323 kN.m
Effective depth (d) = h – Cnom – ϕ/2 – ϕlinks Assuming ϕ12 mm bars will be employed for the main bars, and ϕ8mm bars for the stirrups (links) d = 450 – 30 – 6 – 8 = 406 mm
k = MEd/(fckbd2) = (31.323 × 10⁶)/(35 × 300 × 4062) = 0.0181 Since k < 0.167, no compression reinforcement required z = d[0.5+ √(0.25 – 0.882K) ] = z = d[0.5+ √(0.25 – 0.882(0.0181))] = 0.95d
Effective depth (d) = h – Cnom – ϕ/2 – ϕlinks Assuming ϕ16 mm bars will be employed for the main bars, and ϕ8mm bars for the stirrups (links) d = 450 – 30 – 8 – 8 = 404 mm
k = MEd/(fckbd2) = (62.647 × 10⁶)/(35 × 300 × 4042) = 0.0365 Since k < 0.167, no compression reinforcement required z = d[0.5+ √(0.25 – 0.882K) ] = z = d[0.5+ √(0.25 – 0.882(0.0365))] = 0.95d
As1 = MEd/(0.87fyk z) = (62.647 × 10⁶)/(0.87 × 500 × 0.95 × 404) = 375.23 mm2 Provide 2H16 mm TOP (ASprov = 402 mm2)
Interaction of shear and torsion According to clause 6.3.2(2) of Eurocode 2, the effects of torsion and shear for both hollow and solid members may be superimposed, assuming the same value for the strut inclination θ. The limits for θ given in 6.2.3 (2) of EC2 are also fully applicable for the case of combined shear and torsion.
According to clause 6.3.2(4) of EC2, the maximum resistance of a member subjected to torsion and shear is limited by the capacity of the concrete struts. In order not to exceed this resistance the following condition should be satisfied:
TEd /TRd,max + VEd /VRd,max ≤ 1 ———- Equation (6.29 of EC2)
VEd = 157.7 KN TEd = 4.819 kN.m TRd,max = design torsional resistance moment VRd,max = maximum shear resistance of the cross-section
The equivalent thin wall section for the rectangular section is given below;
Ak = the area enclosed by the centre-lines of the connecting walls, including inner hollow areas = (450 – 90) × (300 – 90) = 75600 mm2 Uk = is the perimeter of the area Ak = 2(450 – 90) + 2(300 – 90) = 1140 mm
Maximum spacing of shear links = 0.75d = 0.75 × 404 = 303mm Provide H8mm @ 250mm c/c (Asw/S = 0.402) Ok
Note that this link must be properly closed with adequate anchorage length, because it will assist in resisting torsion.
Design Considerations for Torsion TEd /TRd,max + VEd /VRd,max ≤ 1
(4.891/56.485) + (157.7/453.863) = 0.434 < 1.0 Hence it is ok
However, note that the actual shear force at the point where torsion is maximum is actually less than the shear force at the support. The relationship above is an error but on the safe side.
The maximum torsion occurs at an angle of 9.5° from the support (see Table above). Therefore, the actual shear force at that section ( VEd) = Shear force at support – wrα
Therefore for educational purposes, this is the shear force that should be used to check the shear-torsion interaction. A little consideration will show that VRd,max is constant all through the section, but VRd,c might vary depending on the longitudinal reinforcement provided at the section.
Rechecking the interaction above;
(4.891/56.485) + (91.114/453.863) = 0.287< 1.0 Hence it is ok
Area of transverse reinforcement to resist torsion Asw/s = TEd/2Ak fyw,d cotθ Asw/s = (4.819 × 10⁶) / (2 × 135000 × 0.87 × 500 × 2.5) = 0.0164 < Asw/S (min) Therefore, links provided for shear will be adequate for resisting torsion.
According to clause 6.3.2(4), in compressive chords, the longitudinal reinforcement may be reduced in proportion to the available compressive force. In tensile chords the longitudinal reinforcement for torsion should be added to the other reinforcement. The longitudinal reinforcement should generally be distributed over the length of side, but for smaller sections it may be concentrated at the ends of this length.
However, for the avoidance of doubt since no definition was given for what could be regarded as a ‘smaller section’, Provide 1H12mm bar at the middle of the section at both faces. The tensile and longitudinal reinforcement provided at the top and bottom of the section should be able to take care of the rest.
Further information Nominal shear reinforcement is required in rectangular sections when;
TEd /TRd,c + VEd /VRd,c ≤ 1 ————– Equation (6.31 of EC2)
Where; TRd,c is the value of the torsion cracking moment: VRd,c is as defined above.
Bar bending schedule is an important structural working document that shows the disposition, bending shape, total length, and quantity of all the reinforcements that have been provided in a structural drawing. It is often provided in a separate sheet (usually A4 paper) from the structural drawing. The bar marks from structural detailing drawing are directly transferred to the bar bending schedule. We normally quantify reinforcements based on their total mass in tonnes or kilograms. For smaller projects, you can quantify based on the number of lengths needed.
Bar bending schedule is prepared for floor slabs to show the quantity, size, and shape of rebars needed during the construction. This document is very important for pre-contract and post-contract operations. The information needed for the preparation of bar bending schedule for floor slab is picked from the reinforcement detailing drawings. One important parameter in the preparation of bar bending schedule is the quantity of steel required (in kilograms or tonnes). This is based on the unit mass and size of the rebars. Unit mass of rebars The unit mass of the reinforcements are derived from the density of steel. The density of steel normally used for this purpose is 7850 kg/m3.
For example, let us consider 12mm bar; The area is given by (πd2)/4 = (π × 122)/4 = 113.097mm2 = 0.0001131m2 Considering a unit length of the bar, we can verify that the volume of a metre length of the bar is 0.0001131m3;
Density = Mass/Volume = 7850 kg/m3 = Mass/0.0001131 Therefore, the unit mass of 12mm bar = 7850 × 0.0001131 = 0.888 kg/m
Therefore for any diameter of bar; Basic weight = 0.00785 kg/mm2 per metre Weight per metre = 0.006165 ϕ2 kg Weight per mm2 at spacing s(mm) = 6.165ϕ2/s kg
Where; ϕ = diameter of bar in millimetres
The unit weight of different types of reinforcement sizes is given in the Table below;
Diameter of bar (mm)
Weight per metre (kg)
Length per tonne (m)
6
0.222
4505
8
0.395
2532
10
0.616
1623
12
0.888
1126
16
1.579
633
20
2.466
406
25
3.854
259
32
6.313
158
40
9.864
101
Basic Shapesfor Bar Bending Schedule
There are some basic shape codes in the code of practice (BS 8666:2005). But these days, it is common to sketch the bending shape on the BBS document to avoid the confusion and extra effort that comes with extracting the shape from a standard document.
To obtain the length of reinforcement bars in a structural drawing, use the following relation;
Length of bar = Effective Length + Width of Support – Concrete cover (s) – Tolerances The typical values of tolerances (deductions) are given in the table below;
Example on the Preparation of the Bar Bending Schedule of a Slab
To illustrate how this is done, consider the general arrangement of the first floor of a building as shown below;
Bar Bending Schedule Calculations
Cutting Length of reinforcement = A + B + C – r – 2d (Table 2.19, Reynolds, Steedman, and Threlfall, 2008) Where; r = radius of bend (r = 24 mm for high yield 12 mm bars; and 20 mm for Y10mm bars) d = diameter of bar
Bar Mark 01: A = 4000 + 230 – 35 = 4195 mm B = 150 – 2(25) – 10 = 90 mm (including 10 mm tolerance) C = 230 + 800 – 35 = 995 mm (from detailing considerations 0.2L) r = 24 (for 12 mm bars)
L = A + B + C – r – 2d = 4195 + 90 + 995 – 24 – 2(12) = 5235 mm
Bar Mark 02: L = 2230 mm
Bar Mark 03: A = 3600 + 230 – 35 = 3795 mm B = 150 – 2(25) – 12 – 10 = 78 mm (including 10 mm tolerance) C = 230 + 720 – 35 = 915 mm (from detailing considerations 0.2L) r = 24 (for 12 mm bars)
L = A + B + C – r – 2d = 3795 + 78 + 915 – 24 – 2(12) = 4740 mm
Bar Mark 04: A = 1080 + 1200 + 230 – 25 = 2485 mm B = 150 – 2(25) – 10 = 90 mm (including 10 mm tolerance) C = 1200 + 230 – 25 = 1405 mm (from detailing considerations 0.2L) r = 24 (for 12 mm bars)
L = A + B + C – r – 2d = 2485 + 1405 + 90 – 24 – 2(12) = 3932 mm
Bar Mark 05: A = 6000 + 230 – 35 = 6195 mm B = 150 – 2(25) – 12 – 10 = 78 mm (including 10 mm tolerance) C = 1200 + 230 – 35 = 1395 mm (from detailing considerations 0.2L) r = 20 (for 10 mm bars)
L = A + B + C – r – 2d = 6195 + 1395 + 78 – 20 – 2(10) = 7628 mm
Bar Mark 06: L = 4630 mm
Bar Mark 07: L = 3830 mm
Bar Mark 08: A = 1200 + 230 – 35 – 25 – (15) = 1355 mm (including 15 mm tolerance) B = 150 – 2(25) – 10 = 90 mm (including 10 mm tolerance) r = 24 (for 12 mm bars)
L = 2(A) + 2(B) + C + D – 3r – 6d = 2(1355) + 2(90) + 2(125) – 3(24) – 6(12) = 2996 mm
Bar Mark 09: L = 2030 mm
Bar Mark 10: L = 1830 mm
The final table for the bar bending schedule can be prepared as shown below. However, it is important to include all details in the schedule to avoid confusion.
I hope you find this post helpful… Help tell others about Structville, and keep on visiting us.
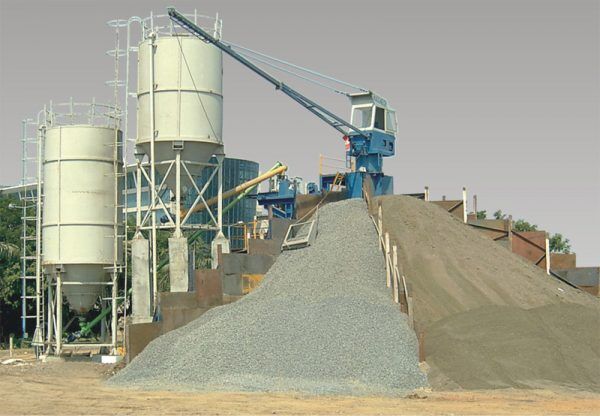
Concrete mix design is the process of specifying and proportioning the quantity of concrete ingredients (cement, sand, gravel, and water) required to produce concrete with a specified fresh and hardened properties. Nowadays, engineers should have a deeper understanding of concrete mixes, than just specifying say 1:2:4 concrete mix ratio for their construction works.
Figure 1: Basic ingredients for concrete production.
The compressive strength of concrete is a very variable quantity. Therefore, when carrying out a concrete mix design, it is important to target a higher average strength so that every part of the structure will meet the specified strength. Statistical standard deviation which is a measure of scatter or dispersion of strength about the mean is normally used to take care of this.
The target strength of concrete (fm) during mix design is given by;
fm = fmin + KSD ————– (1)
Where;
fm is the mean compressive strength
fmin is the minimum compressive strength of the concrete. In the Eurocodes, this is called the characteristic strength of the concrete (fck), while in the US, it is called the design strength (fc‘).
K is the probability factor which is usually taken as 1.64 or 2.33 to express the probability of 1 in 20 and 1 in 100 respectively, for the strength to fall below the minimum strength.
SD is the standard deviation which is best obtained by considering the previous test results obtained using the same materials, the same procedure, and under the same supervision.
The term KSD is normally referred to as the margin.
The probability of strength values in the range fck ± KSD and below fck – KSD (risk) for normal distribution is shown in Table 1.0 below;
Table 1: The probability of strength values in the range fck ± KSD and below fck – KSD (risk) for normal distribution (Neville and Brooks, 2010)
Probability factor (k)
Probability of strength values in the range fck ± KSD(%)
Probability of strength values below fck – KSD (%)
1.00
68.2
15.9 (1 in 6)
1.64
90.0
5.0 (1 in 20)
1.96
95.0
2.5 (1 in 40)
2.33
98.0
1.0 (1 in 100)
3.00
99.7
0.15 (1 in 700)
In the Eurocodes and in many other codes, the range of the risk of 1 in 20 is recommended for concrete tests. This means that in 20 concrete cubes, there is a probability of only one cube not meeting the required strength. When statistical data is not available for obtaining the standard deviation, the values in table 2 according to ACI code could be used.
Table 2: Required average compressive strength when data is not available to establish a standard deviation
Specified Compressive strength f’c (MPa)
Required Average Compressive Strength f’cr (MPa)
Less than 21
f’c + 7.0
21 to 35
f’c + 8.5
Over 35
1.10f’c + 5
The process of carrying out concrete mix design are as follows;
Test the materials to be used for the concrete mix design. For the aggregates, it is important to obtain the oven-dry relative density, fineness modulus, absorption, and bulk density.
Establish the target strength of the concrete at 28 days by considering the characteristic strength and the margin which is based on the standard deviation.
Establish the required water-cement cement ratio for the target strength using relevant tables
Calculate the water requirement for the desired slump using relevant tables
Use the calculated water content to calculate the cement content using the water-cement ratio relationship
Calculate the mass of coarse aggregates using the bulk volume of coarse aggregate per unit volume of concrete
Calculate the mass of fine aggregates
Summarise your results
Worked Example
Let us consider the trial mix design for a concrete of minimum specified strength of 25 N/mm2, to be employed in the construction of the floor beams and slab of a building.
Materials Analysis Coarse aggregate: Crushed granite of nominal maximum size of 20mm Oven dry relative density = 2.68 Fineness modulus = 2.60 Absorption = 0.4% (saturated surface dry) Bulk density = 1650 kg/m3
Specific gravity of cement = 3.15
Fine aggregate: Sharp sand from river Relative density = 2.64 Absorption = 0.60 % Bulk density = 1600 kg/m3
The target strength can be obtained from the relation below; fm = fck + KSD fm = 25 + 8.5 = 33.5 N/mm2 Water-Cement Ratio
The relationship between the water to cement ratio for non-air-entrained concrete (normal concrete) and the 28 days compressive strength is given in Table 3.
Table 3: Relationship between compressive strength and water to cement ratio
Compressive strength at 28 days (MPa)
Water to cement ratio by mass
45
0.38
40
0.42
35
0.47
30
0.54
25
0.61
20
0.69
15
0.79
Therefore, Water – Cement ratio for non-air entrained 33.4 N/mm2 concrete = 0.491 (interpolating from Table 3)
Cement and Water Content Water content is normally estimated from workability requirements, which is guided by the slump. The range of slump required for different types of construction is given in Table 4;
Table 4: Different slumps for different types of construction works
Concrete Construction
Maximum slump (mm)
Minimum slump (mm)
Reinforced foundation walls and footings
75
25
Plain footings, caissons, and substructure walls
75
25
Beams and reinforced walls
100
25
Columns in buildings
100
25
Pavements and slabs
75
25
Mass cocrete
75
25
For maximum size of aggregate of 19mm, and a slump of 75mm, the Table 5 gives a water demand of 205 kg/m3
Table 5: Approximate mixing water and target air content requirements for different slumps and nominal maximum sizes of aggregate
Slump
Water content (kg/m3) for 9.5 mm aggregate size
Water content (kg/m3) for 12.5 mm aggregate size
Water content (kg/m3) for 19 mm aggregate size
Water content (kg/m3) for 25 mm aggregate size
Water content (kg/m3) for 37.5 mm aggregate size
Water content (kg/m3) for 50 mm aggregate size
Water content (kg/m3) for 75 mm aggregate size
Water content (kg/m3) for 150 mm aggregate size
25 – 50
207
199
190
179
166
154
130
113
75 – 100
228
216
205
193
181
169
145
124
150 -175
243
228
216
202
190
178
160
–
Approximate amount of entrapped air (%)
3
2.5
2
1.5
1
0.5
0.3
0.2
Therefore cement content; 205/C= 0.491; Therefore the cement content (C) = 205 / 0.491 = 417.515 kg/m3 Mass of Coarse Aggregates For 19mm aggregate with a fineness modulus of 2.60, the bulk volume of dry rodded coarse aggregate per m3 of concrete is 0.64 (see Table 6).
Table 6: Bulk volume of coarse aggregate per unit volume of concrete
Nominal maximum size of aggregate (mm)
Bulk volume (2.40 fineness modulus)
Bulk volume (2.60 fineness modulus)
Bulk volume (2.80 fineness modulus)
Bulk volume (3.0 fineness modulus)
9.5
0.50
0.48
0.46
0.44
12.5
0.59
0.57
0.55
0.53
19
0.66
0.64
0.62
0.60
25
0.71
0.69
0.67
0.65
37.5
0.75
0.73
0.71
0.69
50
0.78
0.76
0.74
0.72
75
0.82
0.80
0.78
0.76
150
0.87
0.85
0.83
0.81
Therefore, mass of coarse aggregate (Mc) per m3 of concrete = 0.64 × 1650 = 1056 kg/m3 Approximate air content = 2% Mass of fine aggregates The mass of coarse aggregate can be estimated using the relationship below;
Mass of fine aggregate Mf = γf [1000 – (W – C/γ + Mc/γc + 10A)] ————- (2)
Where; γf = Specific gravity of fine aggregate (saturated surface dry) W = Mixing water requirement C = Cement Content γ = Specific gravity of cement (take value as 3.15 unless otherwise specified) Mc = Coarse Aggregate content γc = Specific gravity of coarse aggregate (saturated surface dry) A = Air content (%)
Therefore: Mf = 2.64 [1000 – (205 + (417.515/3.15) + (1056/2.68) + (10 × 2))] = 655.843 kg/m3 Final Volume computations Water = 205 / (1 × 1000) = 0.205 m3 Cement = 417.515 / (3.15 × 1000) = 0.1325 m3 Air = 2/100 = 0.02 Coarse aggregate = 1056 / (2.68 × 1000) = 0.394 m3 Fine aggregate = 655.843 / (2.64 × 1000) = 0.248 m3 SUMMARY OF TRIAL MIX DESIGN By weight Water = 205 kg/m3 Cement = 417.515 kg/m3 Coarse Aggregate = 1056 kg/m3 Fine Aggregate = 655.843 kg/m3 Yield of concrete = 2334.36 kg/m3 Mix ratio by weight (Cement : Fine Aggregate : Coarse Aggregate) = (1:1.57:2.53)
By volume Water = 0.205 m3 Cement = 0.1325 m3 Coarse Aggregate = 0.394 m3 Fine Aggregate = 0.248 m3
Mix ratio by volume (Cement : Fine Aggregate : Coarse Aggregate) = (1:1.87:2.97)
MIX DESIGN WITHOUT CONSIDERING TEST MARGIN However, carrying out mix design for 25 N/mm2 grade of concrete without considering the margin, we can obtain the following result using the steps described above;
Water-cement ratio Water – Cement ratio for non-air entrained 25 N/mm2 concrete = 0.61 (see Table 3 above)
Water and Cement Demand For maximum size of aggregate of 19mm, and a slump of 75mm, gives a water demand of 205 kg/m3. Therefore the cement content C = 205/0.61= 336.06 kg/m3
Mass of Coarse Aggregate For 19mm aggregate with fineness modulus of 2.60, the bulk volume of dry rodded coarse aggregate per m3 of concrete is 0.64. Therefore; Weight per m3 = 0.64 × 1650 = 1056 kg/m3
Approximate air content = 2%
Mass of Fine Aggregate Mass of fine aggregate Mf = γf [1000 – (W – C/γ + Mc/γc + 10A)] Mf = 2.64 [1000- (205 + (336.06/3.15) + (1056/2.68) + 10(2))] = 724.11 kg/m3
Volume computations Water = 205 / (1 × 1000) = 0.205 m3 Cement = 336.06 / (3.15 × 1000) = 0.1066 m3 Air = 2/100 = 0.02% Coarse aggregate = 1056 / (2.68 × 1000) = 0.394 m3 Fine aggregate = 724.11 / (2.64 × 1000) = 0.274 m3 Summary of trial mix design without considering the margin By weight Water = 205 kg/m3 Cement = 336.06 kg/m3 Coarse Aggregate = 1056 kg/m3 Fine Aggregate = 724.11 kg/m3 Yield of concrete = 2321.17 kg/m3 Mix ratio by weight (Cement:Fine Aggregate:Coarse Aggregate) = (1: 2.15: 3.142)
By volume Water = 0.205 m3 Cement = 0.1066 m3 Coarse Aggregate = 0.394 m3 Fine Aggregate = 0.274 m3 Mix ratio by volume (Cement:Fine Aggregate:Coarse Aggregate) = (1:2.57:3.696)
Thank you for visiting Structville……. We love you, and you can like our facebook fan page on; www.facebook.com/structville
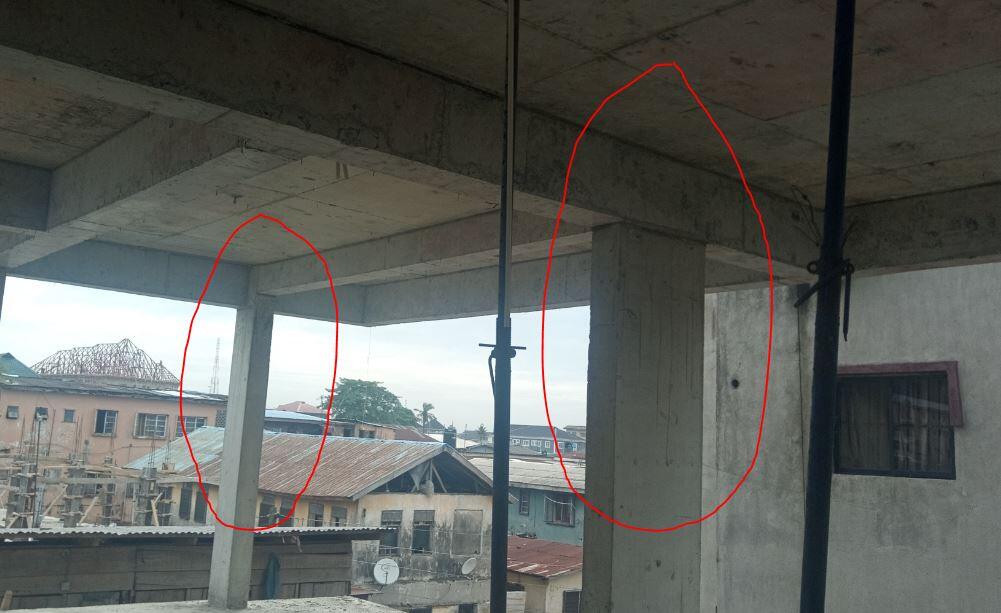
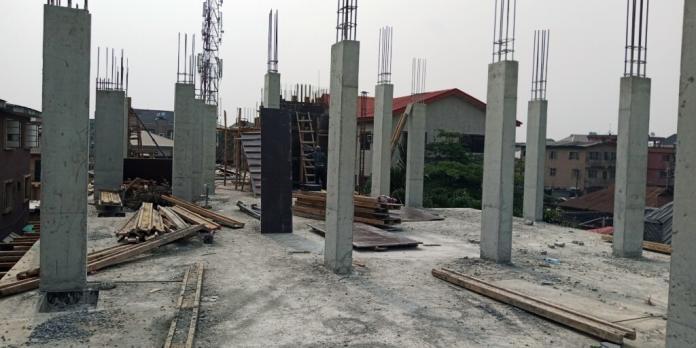
A biaxial column is a column that is subjected to compressive axial force and bending moment in the two planes. They are usually found at the corners of a building or at locations where the beam spans and/or loading are not equal. In the design of biaxial reinforced concrete columns, a non-linear analysis method is required, which should take into account second-order, imperfection, and biaxial bending effects.
The columns circled in red are biaxially loaded
EN 1992-1-:2004 (Eurocode 2) did not give an express method of designing biaxial columns other than working from the first principles. This may not be very easy to achieve without the use of charts or computer programs. To develop such a program, one can divide the compression zone into strips that are parallel with the neutral axis of the section, and calculate the stress in each strip using the parabolic-rectangular diagram. The force and moment at each strip in the x and y-axis can be summed up in the ultimate limit state to find the moment and axial force developed by the concrete in compression.
There are however simplified methods of dealing with biaxial bending in reinforced concrete structures. An example is the approach given in clause 5.8.9(4) of EN 1992-1-1 for the design of biaxially bent sections in slender columns. This is based on the observation that the form of the Mx – My interaction diagram can conveniently be represented by a super-ellipse. A super-ellipse has an equation of the form;
xa + ya = k —— (1)
If a = 2, this equation becomes a circle, while if a= 1 it describes a straight line. At loads approaching the squash load, the Mx – My interaction diagram approaches a circle, while in the region of the balance point it is close to a straight line. Clause 5.8.9(4) adopts the equation below as a means of describing the complete interaction surface;
(ME,dz/MR,dz )a + (MEd,y/MRd,y )a ≤ 1.0 —— (2)
The proximity to the squash load can be defined using the N/Nuz ratio parameter, and EN 1992-1-1 assumes the relationship between this parameter and the exponent ‘a‘ given in the Table below. Intermediate values may be interpolated.
NEd/NRd
0.1
0.7
1.0
a
1.0
1.5
2.0
In the Table above, NRd is the squash load of the column, and may be calculated from
NRd = Acfcd + Asfyd —— (3)
The difficulty with the approach from the practical point of view is that it cannot be used as a direct design method since NRd can only be established once the reinforcement area has been found. It, therefore, has to be used iteratively. An initial estimate is made of N/Nuz, the section is designed, a corrected value of N/Nuz can then be estimated, and the process repeated until a correct solution is obtained.
A much simpler, but considerably more approximate method to the design of biaxial columns has been adopted in BS 8110. The design is carried out for an increased uniaxial moment, which takes account of the biaxial effects. The required uniaxial moment is obtained from whichever is appropriate of the two relationships set out below:
if Mx/h’ > My/b’ then M’x = Mx + βh’My/b’ —— (4) if Mx/h’ < My/b’ then M’y = My + βb’Mx /h’ —— (5)
In the above relationships, Mx and My are the design moments about the x and y axes, respectively, while M’x and M’y are the effective uniaxial moments for which the section is actually designed. b’ and h’ are the effective depths of the column section (see image below). The factor β is defined in BS 8110 as a function of N/bhfcu. In terms of fck, it can be obtained from the relationship;
β = 1 – N/bhfck(0.3 < β < 1.0) —— (6)
This approach has the great advantage of being very simple. It is, however, an approximate approach.
Example on the Design of Biaxial Reinforced Concrete Columns to BS 8110 and Eurocode 2
A reinforced concrete column fixed at both ends is subjected to the loading condition shown below. We are required to obtain the appropriate longitudinal reinforcement for the column using BS 8110-1:1997 and Eurocode 2. The column is carrying longitudinal and transverse beams of depth 600mm and width 300mm. It is also supported by beams of the same dimension. The centre to centre height of the column is 3500mm. The plan view of the arrangement of the beams and column is as shown below.
DESIGN ACCORDING TO BS 8110-1:1997 N = 716.88 kN; TOP: Mx-x = 175.87 kNm; My-y = 35.52 kNm BOTTOM: Mx-x = -85.832 kNm; My-y = -25.269 kNm
Concrete grade fcu = 30 N/mm2 Yield Strength of reinforcement fy = 460 N/mm2 Concrete cover = 40mm Lo = 3.5m, Effective length Le = 0.75 × (3500 – 600) = 2175 mm; Size of column = 400 x 300mm; Slenderness = 2175/300 = 7.25 < 15. Thus column is short.
Effective depth about x-x axis h’ = (400 – 40 – 12.5 – 10) = 337.5 mm
Effective depth about y-y axis b’ = (300 – 40 – 12.5 – 10) = 237.5 mm
Minimum Eccentricity in Columns According to clause 3.8.2.4 of BS 8110-1:1997, at no section in a column should the design moment be taken as less than that produced by considering the design ultimate axial load as acting at a minimum eccentricity, emin equal to 0.05 times the overall dimension of the column in the plane of bending considered but not more than 20 mm.
Where biaxial bending is considered, it is only necessary to ensure that the eccentricity exceeds the minimum about one axis at a time.
In the x-x direction = emin = 0.05 × 400 = 20mm, therefore adopt 20mm, Mx = 716.88 × 0.02 = 14.3376 kNm < 214.64 kNm
In the y-y direction = emin = 0.05 × 300 = 15mm, therefore adopt 15mm, My = 716.88 × 0.015 = 10.7532 kNm < 214.64 kNm Section design ratios for chart entry Axial load ratio Nratio = (N × 1000)/(Fcu × b × h) = (716.88 × 1000)/(30 × 400 × 300) = 0.1991
Provide 6Y25mm (Asprov = 2946 mm2) Maximum area of reinforcement = 0.06bh = 0.06 × 400 × 300 = 7200 mm2
DESIGN ACCORDING TO EUROCODE 2 Clause 5.8.9(2) of EN 1992-1-1:2004 permits us to perform separate designs in each principal direction, disregarding biaxial bending as a first step. Imperfections need to be taken into account only in the direction where they will have the most unfavourable effect. However, in this example, we have carried out imperfection analysis in both directions.
Calculation of the effective height of the column (Lo) Let us first of all calculate the relative stiffnesses of the members in the planes of bending. In the y-direction; Second moment of area of beam 1 (I1) = bh3/12 = 0.3 × 0.63/12 = 0.0054 m4 Stiffness of beam 1 (since E is constant) = 4I1/L = (4 × 0.0054) / 6 = 0.0036
Second moment of area of beam (I2) = bh3/12 = 0.3 × 0.63/12 = 0.0054 m4 Stiffness of beam 2 (since E is constant) = 4I2/L = (4 × 0.0054) / 3.5 = 0.00617
Second moment of area of column (Ic) = bh3/12 = 0.0016 m4 Stiffness of column = 4Ic/L = (4 × 0.0016) / 3.5 = 0.001828
For compression members in regular braced frames, the slenderness criterion should be checked with an effective length l0 determined in the following way:
Where; k1, k2 are the relative flexibilities of rotational restraints at ends 1 and 2 respectively L is the clear height of the column between the end restraints
k = 0 is the theoretical limit for rigid rotational restraint, and k = ∞ represents the limit for no restraint at all. Since fully rigid restraint is rare in practise, a minimum value of 0.1 is recommended for k1 and k2.
In the above equations, k1 and k2 are the relative flexibilities of rotational restraint at nodes 1 and 2 respectively. If the stiffness of adjacent columns does not vary significantly (say, the difference not exceeding 15% of the higher value), the relative flexibility may be taken as the stiffness of the column under consideration divided by the sum of the stiffness of the beams (or, for an end column, the stiffness of the beam) attached to the column in the appropriate plane of bending.
Remember that we will have to reduce the stiffness of the beams by half to account for cracking;
k1 = k2 = 0.001828 / (0.0018 + 0.003085) = 0.3743
Lo = 0.5 × 2900√[((1 + 0.3743)/(0.45 + 0.3743)) × (1 + 0.3743)/(0.45 + 0.3743)] = 2647.77 mm
Compare with BS 8110’s 0.75L = 0.75 × 2900 = 2175 mm In the z-direction; Second moment of area of beam 3 (I3) = bh3/12 = 0.3 × 0.63/12 = 0.0054 m4 Stiffness of beam 3 (since E is constant) = 4I1/L = (4 × 0.0054) / 3.5 = 0.00617
Second moment of area of column (Ic) = bh3/12 = 0.0009 m4 Stiffness of column = 4Ic/L = (4 × 0.0009) / 3.5 = 0.00102857
ix = h/√12 = 400/√12 = 115.47 iz = b/√12 = 300/√12 = 86.602
Slenderness in the x-direction (λx) = 2647.77/115.47 = 22.930 Slenderness in the z-direction (λz) = 2675.293/86.602 = 30.892
Critical Slenderness for the y-direction λlim = (20.A.B.C)/√n A = 0.7 B = 1.1 C = 1.7 – M01/M02 = 1.7 – [(-85.832)/175.87] = 2.188 n = NEd / (Ac fcd) NEd = 716.88 × 10³ N Ac = 400 × 300 = 120000 mm2 fcd = (αcc fck)/1.5 = (0.85 × 30)/1.5 = 17 N/mm2 n = (716.88 × 10³) / (120000 × 17) = 0.3514 λlim = (20 × 0.7 × 1.1 × 2.188 )/√0.3514 = 56.842
22.930 < 56.842, second order effects need not to be considered in the y-direction Critical Slenderness for the z-direction A = 0.7 B = 1.1 C = 1.7 – M01/M02 = 1.7 – [(-25.269)/35.52] = 2.411 n = NEd / (Ac fcd) NEd = 716.88 × 10³ N Ac = 400 × 300 = 120000 mm2 fcd = (αcc fck)/1.5 = (0.85 × 30)/1.5 = 17 N/mm2 n = (716.88 × 10³) / (120000 × 17) = 0.3514
λlim = (20 × 0.7 × 1.1 × 2.411 )/√0.3514 = 62.634
30.892 < 62.634, second-order effects need not be considered in the z-direction Design Moments (y-direction) Y – direction: M01 = 175.87 kNm; M02 = -85.832 kNm
e1 is the geometric imperfection = (θi l0/2) = (1/200) × (2647.77/2) = 6.619 mm
Minimum eccentricity e0 = h/30 = 400/30 = 13.333 mm. Since this is less than 20mm, take minimum eccentricity = 20mm (clause 6.1(4) EC2).
To evaluate the value of a, let us look at the table below as given in Clause 5.8.9(4) of EC2
By linear interpolation, a = 1.0 + [(0.2537 – 0.1 )/(0.7 – 0.1)] × (1.5 – 1.0) = 1.128
(ME,dz/MR,dz )a + (MEd,y/MRd,y )a ≤ 1.0
(40.314/187.2)1.128 + (180.624/187.2)1.128 = 0.1769 + 0.9606 = 1.1375 > 1.0. This is not ok, and this shows that 4Y25 is inadequate for the biaxial action on the column.
Let us increase the area of steel to 6Y25mm (Asprov = 2946 mm2)
Let us check again; (As Fyk)/(bhfck) = (2964 × 460) / (30 × 300 × 400) = 0.3787 Therefore from the chart; MRd/(fckbh2) = 0.175 MRd = (0.175 × 30 × 300 × 4002) × 10-6 = 252 kNm
Using tiles to cover the surfaces of floors, walls, countertops, etc can be a very attractive option for finishes in a building. Tiles can provide hard, durable, and aesthetically pleasing surfaces in a building provided that the tiling job is properly done. There are some basic principles that must be followed in order to achieve quality, beautiful and durable tiling.
For a homeowner and/or contractor, cost is a major factor that influences the decision and quality of tiling to be done. The basic factor that can influence the final cost of tiling a house are;
Cost of the tiles
Cost of screeding
Cost of adhesives
Cost of grouting cement
Cost of tiling accessories such as edge trimmers
Cost of labour
Size of area to be tiled
In this article, we are going to show how to estimate the cost of tiling a house in Nigeria using a three bedrooms apartment as an example. The floor plan of the three bedrooms apartment is shown in Figure 1. It is desirous to tile all the floors of the building according to the following specifications;
(1) All bedrooms, kitchen, and rear balcony/sit-out: 40cm × 40cm made in Nigeria ceramic tiles
(2) The sitting room, dining, and front balcony/sit-out: (30cm × 60cm) imported Virony glazed tiles;
(3) All the toilets and bathrooms: (30cm × 30cm) made in Nigeria ceramic tiles.
We are required to estimate the total cost of tiling the entire floor of the building, considering materials and labour.
Figure 1: Floor plan of a three bedrooms apartment
Material Prices (informative)
It is very important for you to make an adequate market survey, in order to know the exact prices of materials in your area. This is the only chance you have of making a reasonably accurate estimate. The prices stated below are a bit representative, but merely informative. Note that tiles with designs may be more expensive than plain tiles or tiles with a single colour.
(40cm × 40cm) Ceramics Tiles = ₦3,360 per carton (12 pieces per carton – 1.92 square metre)
(30cm × 60cm) Porcelain Glazed Tiles = ₦5,760 per carton (8 pieces per carton – 1.44 square metre)
(30cm × 30cm) Ceramic Tiles = ₦2,700 per carton (17 pieces per carton – 1.53 square metre)
1 tonne of sand = ₦4,000
1 bag of cement = ₦4,000 5 kg of white cement = ₦2,500 Water seal = ₦700 per kg Tile gum (20kg) = ₦1,450
BILL NO 1: TILES AND TILING ACCESSORIES (a) Tiling of the bedrooms, kitchen, backyard sit-out, and store with (40cm × 40cm) Time Ceramics Tiles We have to calculate the floor areas where we are going to apply the (40cm × 40cm) tiles; Bedroom 1 = (3.6m × 3.45m) = 12.42 m2 Bedroom 2 = (3.6m × 3.6m) = 12.96 m2 Bedroom 3 = (3.15m × 3.17m) = 9.9855 m2 Kitchen = [(3.35m × 2.35m) + (1.37m × 1.075m)] = 9.34525 m2 Store = (2.025m × 1.775m) = 3.59 m2 Kitchen Sit-out = (1.37m × 2.075m) = 2.84275 m2 Total Area= 51.148 m2 Area of a piece of tile = (0.4m × 0.4m) = 0.16 m2
The number of pieces of tiles required to complete the floor areas = 51.148/0.16 = 319.675 pcs
Therefore, the number of cartons required = 319.675/12 = 26.639 cartons.
We will therefore provide 30 cartons of (40cm × 40cm) ceramic tiles. Extra tiles will account for damages, and for skirting of the foot of the walls.
Therefore the cost of the (40cm x 40cm) tiles = 30 × ₦3,360 = ₦100,800 (b) Tiling of the sitting room, dining, and entrance porch with (60cm x 30cm) tiles The floor areas where we are going to apply the (60cm × 30cm) tiles; Sitting room = (5.65m × 4.625m) = 26.13125 m2 Dining = (2.35m × 3.35m) = 7.8725 m2 Entrance Porch = (3.78m × 1.475m) = 5.5755 m2 Total Area= 39.579 m2 Area of a piece of tile = (0.6m × 0.3m) = 0.18 m2
The number of pieces of tiles required to complete the floor areas = 39.579/0.18 = 219.883 pcs;
Therefore, the number of cartons required = 219.883/8 = 27.485 cartons
We will therefore also provide 30 cartons of (60cm × 30cm) ceramic tiles.
Therefore the cost of the (60cm x 30cm) tiles = 30 × ₦5,760 = ₦172,800 (c) Tiling of the bathroom and toilet floors with (30cm x 30cm) tiles On calculating the floor areas where we going to apply the (30cm × 30cm) tiles; Bathroom and Toilet 1 and 2 = 2(2.0m × 1.1m) = 4.4 m2 Bathroom and toilet 3 = (2.0m × 0.985m) = 1.97 m2 Visitor’s toilet = (2.0m × 0.875m) = 1.75 m2 Total Area= 8.12 m2 Area of a piece of tile = (0.3m × 0.3m) = 0.09 m2
The number of pieces of tiles required to complete the floor areas = 8.12/0.09 = 90.222 pcs
Therefore, the number of cartons required = 90.222/17 = 5.307 cartons
We will therefore provide 7 cartons of (30cm × 30cm) ceramic tiles
Therefore the cost of the (30cm x 30cm) tiles = 7 × ₦2,700 = ₦18,900
(d) Loading, transportation, and offloading at the site (say) = ₦20,000 Therefore, sub-total 1 = ₦100,800 + ₦172,800 + ₦18,900 + ₦20,000 = ₦312,500
BILL NO 2: CEMENTAND SAND We are going to make 25mm thick screeding to receive the tiles.
From above, you can verify that the total floor area of the building = 51.148 m2 + 39.579 m2 + 8.12 m2 = 98.847 m2
Volume of mortar required = 98.847 × 0.025 = 2.471 m3 Using a mix ratio of 1:5
Alternative calculation by site experience From experience, 2 bags of cement is sufficient to complete the entire tiling process of (3.6m × 3.6m) room
Therefore; 2 bags of cement = 12.96 m2 x bags of cement = 98.847 m2 On solving; x = 15.254 bags of cement; say 16 bags of cement
From experience, about 20 – 22 head pans of sharp sand is sufficient to complete the entire screeding process of (3.6m × 3.6m) room;
22 head pans = 22 × 0.0175 m3 = 0.385 m3
Therefore; 0.385 m3 of sand = 12.96 m2 x m3of sand = 98.847 m2 On solving; x = 2.936 m3sand = 4.844 tonnes of sand Therefore, provide;
5 tonnes of sharp sand = ₦20,000 The cost of cement = 16 × ₦4,000 = ₦64,600 Water seal = 16 packs = 16 × ₦700 = ₦11,200 Tile gum = 17 bags × ₦1450 = ₦24,650 Other tiling accessories (allow) = ₦20,000 Transportation (say) = ₦5,000
Sub total 2 = ₦145,450 BILL NO 3: LABOUR Cost of tiling 1m2 of floor =₦500
Therefore; 1 m2 = ₦350 98.847 m2 = x On solving; x = ₦49,423 (rounding up to the nearest 100)
Therefore, cost of labour = ₦50,000
GRAND TOTAL = ₦ 312,500 + ₦145,450 + ₦50,000 = ₦507,950 Therefore the cost of tiling the floor of the building = ₦507,950 + VAT + Engineer’s/Architect’s Profits
Dynamics of structures is a special branch of structural analysis, which deals with the behaviour of structures subjected to dynamic loads (loads that vary with time). Such loads develop dynamic reactions, internal forces, and displacements in the structure. These values all change with time, and maximum values often exceed static load reaction values. Dynamic analysis of any structure often begins with free vibration analysis. A structure undergoes free vibration when it is brought out of static equilibrium and can then oscillate without any external dynamic excitation. Free vibration of structures occurs with some frequencies which depend only on the parameters of the structures such as boundary conditions, distribution of masses, stiffnesses within the members etc, and not on the reason for the vibration.
At each natural frequency of free vibration, the structure vibrates in simple harmonic motion where the displaced shape (mode shape) of the structure is constant but the amplitude of the displacement varies in a sinusoidal manner with time. The number of natural frequencies in a structure coincides with the number of degrees of freedom in the structure. These frequencies are inherent to the given structure and are often referred to as eigenfrequencies. Each mode shape of vibration shows the form of an elastic curve which corresponds to a specific frequency.
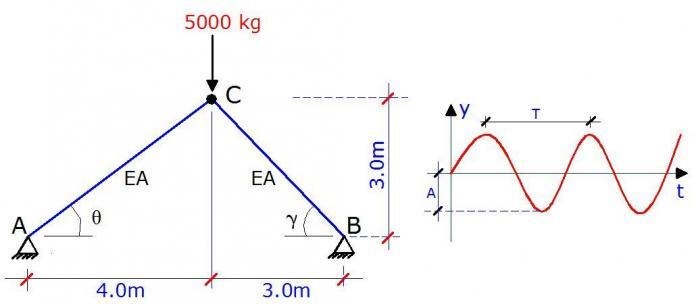
A truss is loaded as shown below with a lumped mass of 5000 kg. We are to obtain the eigenfrequencies and mode shapes by assuming linear behaviour, neglecting damping, and assuming that the stiffness and inertial effects are time-independent.
E = 205 kN/mm2 Cross-sectional area = 0.00548 m2 (UB 254 x 146 x 43)
A little consideration will show that the structure has two degrees of freedom which are given by the vertical and horizontal translation at node C. The lumped mass at the node will definitely participate in those movements. The displacements are given by Y1 and Y2 below.
γ = tan-1(4/4) = 45° cos γ = 0.7071 sin γ = 0.7071 LBC = √(32 + 32) = 4.243m
ANALYSIS OF STATE 1; Y1 = 1.0
∑Fy = 0 -0.6FAC – 0.7071FCB = 1.0 ———– (1)
∑Fx = 0 -0.8FAC + 0.7071FCB = 0 ———– (2)
Solving (1) and (2) simultaneously FAC = -0.7143 FCB = -0.8081
ANALYSIS OF STATE 2; Y2 = 1.0
∑Fy = 0 -0.6FAC – 0.7071FCB = 0 ———– (3)
∑Fx = 0 -0.8FAC + 0.7071FCB = -1.0 ———– (4)
Solving (3) and (4) simultaneously FAC = 0.7143 FCB = -0.6061
The frequency equation of a 2 degree of freedom system in terms of displacement is given by;
Where; M is the lumped mass A is the amplitudes (Note that the system does not allow us to find the amplitudes but we can find the ratio of the amplitudes) ω is the angular velocity δij is the axial displacement given by;
Understanding sign conventions is one of the most important aspects of structural analysis. As a matter of fact, it is always a pausing point for all civil engineering students being introduced to structural analysis for the first time. If you do not understand sign conventions properly, it will be difficult to make significant progress in mastering structural analysis calculations.
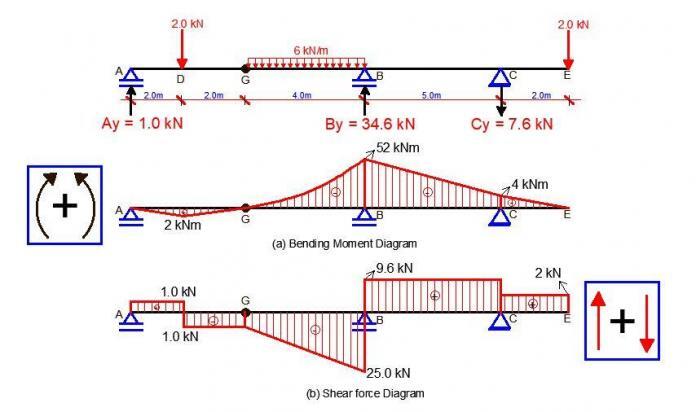
The three most prominent internal forces in structural analysis calculations are the bending moment, shear force, and axial force. It is very common for people to define and state their sign convention before proceeding with any structural analysis problem. This is mainly due to variations in the selection of positive and negative coordinates.
For instance, most Indian and American textbooks will adopt the conventional cartesian coordinates system, and plot all positive bending moment upwards, and negative moments downwards, while most British and Scandinavian textbooks will plot positive moment downwards, and negative moments upwards.
However, it is important to note that what matters most in sign conventions is consistency. You must be consistent with whatever sign convention you choose to adopt, otherwise, errors will come in. If properly done, the values will remain the same, but the signs will differ.
Is there any standard approach?
I will prefer to answer yes because it is more appropriate to plot the bending moment diagram in the tension zone/fibre/face of a structural member. This is especially important in reinforced concrete structures where there is a need to provide tension reinforcement.
For instance, if you consider a continuous beam subjected to uniformly distributed load with the bending moment diagram plotted in the tension zone, you can easily point out and provide bottom reinforcements at the spans, and top reinforcements at the supports.
See an example below;
Consistency of bending moment diagram with the arrangement of reinforcements
From the figure above, you can see the consistency of the bending moment diagram with the typical arrangement of the reinforcement. This is because the bending moment diagrams were plotted in the tension zone, and of course, it means that the positive moment was plotted downwards. However, if the cartesian coordinates system was strictly followed, we would have been reversing the placement of the reinforcements with the bending moment diagram.
The same thing also applies to frames. You should plot your bending moment diagram in the tension zone of the members of the frame.
However, there are procedures that you must follow in your calculations in order to be consistent. By consistent, what I mean is that your positive bending moment will imply a sagging moment, while negative will mean a hogging moment. With this, you can plot your diagram directly as you have calculated, without having to interchange signs.
The summary of the procedures is given below.
Sign Convention for Beams
Bending moment
When you are coming from the left-hand side of the structure, all clockwise moments are positive and vice versa. When you are coming from the right-hand side of the structure, all anti-clockwise moments are positive and vice versa.
Shear force
When you are coming from the left, upward forces are positive, while downward forces are negative. When you are coming from the right, downward forces are positive, while upward forces are negative.
Axial force
Compressive axial forces are negative, while tensile axial forces are positive.
All you have to do is to look at the direction of the force. When coming from the left-hand side of beams, axial forces pointing towards the right means that the beam/section is in compression. When coming from the right, axial forces pointing towards the right means that the beam/section is in tension and vice versa
Sign Convention for Frames
For the sign of convention of frames, we are going to use the frame below as an example.
Bending moment
When coming from the left-hand side, all clockwise moments are positive, and anti-clockwise moments negative. All you have to do is to look at the point where you are taking your moment and observe the nature of rotation the force will produce. This is valid for both vertical and horizontal forces.
When coming from the right, all anti-clockwise moments are positive.
For frames, we plot positive moments inside, and negative moments outside the frame. See the example below.
Shear force
When coming from the left, upward vertical forces are positive and downward forces are negative. For horizontal forces on columns, forces pointing towards the right produce negative shear forces.
When coming from the right, downward vertical forces are positive, while upward vertical forces are negative. Horizontal forces on columns pointing towards the left will produce positive shear forces.
We plot positive shear forces outside the frame, and negative shear forces inside the frame.
Axial Force
When coming from the bottom of columns, upward vertical support reactions means that the column is in compression whether you are coming from the left or right.
When coming from the right-hand side of beams, forces pointing towards the right means that the beam is in compression and vice versa.
To me, you are free to select any location to plot your axial forces. Some people draw axial force diagrams to coincide with the centerline of the structure. In the classroom where I was trained, we draw negative axial forces outside the frame, and positive axial forces inside the frame. So it’s your choice to make.
I hope you find this article useful. If so, I will like you to share it.
Continue to visit Structville and tell your colleagues about us.
A parabolic arch structure is hinged on two interacting trusses as shown in the image above. The arch is also hinged at the crown (point F). We are expected to obtain the internal forces acting on the structure due to the externally applied uniform load on the arch, and the horizontal concentrated load at point D. Since the arch is hinged on the truss, we can decompose the structure, and analyse the arch as a three-hinged arch, after which we transfer the support reactions from the arch to the truss. The detached arch structure is as shown below;
Support Reactions
∑ME = 0
16Dy – (10 × 162)/2 = 0
Therefore, Dy = 1280/16 = 80 KN
A little consideration from symmetry will also show that Ey = 80 KN
Universal beam sections are normally employed in buildings to carry floor and wall load. Loads on beams may include the load from slab, walls, building services, and their own self-weight. It is necessary for structural beams to satisfy ultimate and serviceability limit state requirements. This post gives a solved design example of a laterally restrained beam according to BS 5950.
The structural design of steel beams to BS 5950 involves following specific guidelines and principles outlined in the British Standard. BS 5950 is a widely used code of practice for the design of steel structures in the United Kingdom, but has been replaced by Eurocode 3 (EN 1993-1-1).
When designing steel beams, several factors are considered to ensure structural integrity and safety. These factors include determining the appropriate loadings, selecting the appropriate section shape and size, analyzing the beam’s resistance to bending, shear, and deflection, and ensuring proper connection details.
The code specifies various load combinations, such as dead loads, live loads, wind loads, and imposed loads, that need to be considered during the design process. In terms of section selection, the code provides tables and charts to determine the suitable steel section based on the applied loads and required span. These sections include universal beams (UB), universal columns (UC), and parallel flange channels (PFC), among others. The appropriate section is chosen based on its moment resistance, shear capacity, and deflection limits.
Design calculations involve checking the beam’s capacity to resist bending, shear, and deflection. These calculations consider the applied loads, section properties, and material properties of the steel. The code provides formulas and design charts to assess these aspects.
Steel Beam Design Example
A laterally restrained beam 9m long that is simply supported at both ends support a dead uniformly distributed load of 15 kN/m and an imposed load uniformly distributed load of 5 kN/m. It also carries a dead load of 20 kN at a distance of 2.5m from both ends. Provide a suitable UB to satisfy ultimate and serviceability limit state requirements (Py = 275 N/mm2).
Initial selection of section Moment Capacity of section Mc = PyS ——- (1)
Where S is the plastic modulus of the section
Which implies that S = Mc/Py = (363.625 × 10⁶)/275 = 1320963.636 mm3 = 1320.963 cm3
With this we can go to the steel sections table and select a section that has a plastic modulus that is slightly higher than 1320.963 cm3 Try section UB 457 × 191 × 67 (S = 1470 cm3)
Properties of the section;
Ixx = 29400 cm4
Zxx = 1300 cm3
Mass per metre = 67.1 kg/m
D = 453.4mm
B = 189.9mm
t = 8.5mm
T = 12.7mm
r = 10.2mm
d = 407.6mm
Strength classification
Since T = 12.7mm < 16mm, Py = 275 N/mm2
Hence ε = √(275/Py) = √(275/275) = 1.0
Section classification Flange
b/T = 7.48 < 9ε; Flange is plastic class 1 Web
d/t = 48 < 80ε; Web is also plastic class 1
Shear Capacity As d/t = 48 < 70ε, shear buckling need not be considered (clause 4.4.4)
Mc (404.25 kNm) < 1.2PyZ (429.00 kNm) Hence section is ok
Evaluating extra moment due to self-weight of the beam Self-weight of the beam Sw = 67.1 kg/m = 0.658 kN/m (UDL on the beam) Moment due to self weight (Msw) = (ql2)/8 = (0.658 × 92)/8 = 6.66 kNm
(363.625 + 6.66) < Mc (404.25 kNm) < 1.2PyZ (429.00 kNm) Hence section is ok for moment resistance.
Deflection Check We check deflection for the unfactored imposed load; E = 205 kN/mm2 = 205 × 106 KN/m2; Ixx = 29400 cm4 = 29400 × 10-8 m4
The maximum deflection for this structure occurs at the midspan and it is given by; δ = (5ql4)/384EI = (5 × 5 × 94) / (384 × 205 × 106 × 29400 × 10-8) = 7.087 × 10⁻³ m = 7.087 mm
Web bearing According to Clause 4.5.2 of BS 5950-1:2000, the bearing resistance Pbw is given by:
Pbw = (b1 + nk)tPyw —– (3)
Where; b1 is the stiff bearing length n = 5 (at the point of concentrated loads) except at the end of a member and n = 2 + 0.6be/k ≤ 5 at the end of the member be is the distance to the end of the member from the end of the stiff bearing k = (T + r) for rolled I- or H-sections T is the thickness of the flange t is the web thickness Pyw is the design strength of the web
Web bearing at the supports Let us assume that beam sits on 200 mm bearing, and be = 20mm
k = (T + r) = 12.7 + 10.2 = 22.9mm; Hence n = 2 + 0.6(20/22.9) = 2.52mm < 5mm. Pbw = (b1 + nk)tPyw Pbw = [200 + 2.52(22.9)] × 8.5 × 275 = 602392.45 N = 602.392 kN Pbw (602.392 kN) > Fv (158.5 kN) Hence it is ok
According to clause 4.5.3.1 of BS 5950, provided the distance αe from the concentrated load or reaction to the nearer end of the member is at least 0.7d, and if the flange through which the load or reaction is applied is effectively restrained against both;
(a) rotation relative to the web (b) lateral movement relative to the other flange
The buckling resistance of an unstiffened web is given by;
Px = [25εt/√(b1 + nk)d] Pbw —– (4) When αe < 0.7d, the buckling resistance of an unstiffened web is given by;