8.7 C
New York
Thursday, June 19, 2025
Home Blog Page 51

Analysis and Design of Box Culvert Using Staad Pro

In our last post, we were able to establish how we can load box culverts properly. If you missed the post, kindly follow the link below to read it;
Loading and Analysis of Box Culverts to Eurocode 2


In this post, we are going to describe how we can model, load, and analyse box culverts using Staad Pro software. Here is a quick a recap of the properties of the box culvert under consideration;
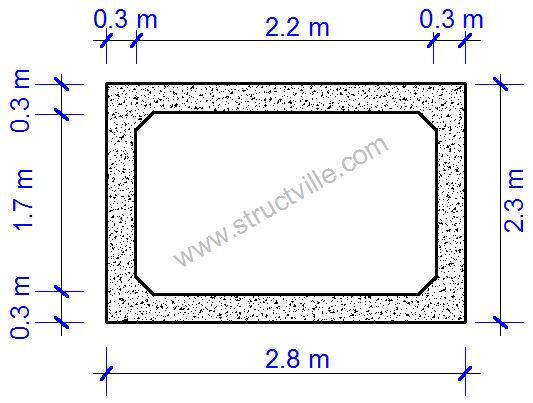
Geometry of the culvert
Total length of culvert = 8 m
Width of culvert c/c of side walls = 2.5 m
Height of culvert c/c of top and bottom slabs = 2.0 m
Length of wing walls = 2.12 m
Thickness of all elements = 300 mm
Thickness of asphalt layer = 70 mm
Materials property
Angle of internal friction of fill soil = 30°
Unit weight of water = 9.81 kN/m3
Unit weight of back fill soil = 19 kN/m3
Unit weight of concrete = 25 kN/m3
Unit weight of asphalt concrete = 22.5 kN/m3
fck = 30 Mpa
fyk = 500 Mpa
Concrete cover = 50 mm
box 2Bculvert 2Bdimensions
Fig 1: Section of the Box Culvert
The steps in modelling the structure on Staad Pro are as follows;

(1) Meshing
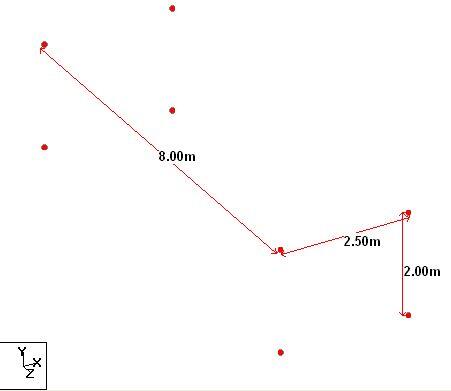
Here, the box culvert is idealised with dimensions based on centre to centre of the slabs and walls. This means that the width of the box culvert that will be input into Staad Pro is 2.5 m, while the depth will be 2.0 m. This can be started by forming the nodes in the global XY plane, and then copying and pasting for the length of 8 m in the Z global direction. The output of this operation is as given below;
initial 2Bmeshing
Fig 2: Initial Nodes for Commencement of Modelling

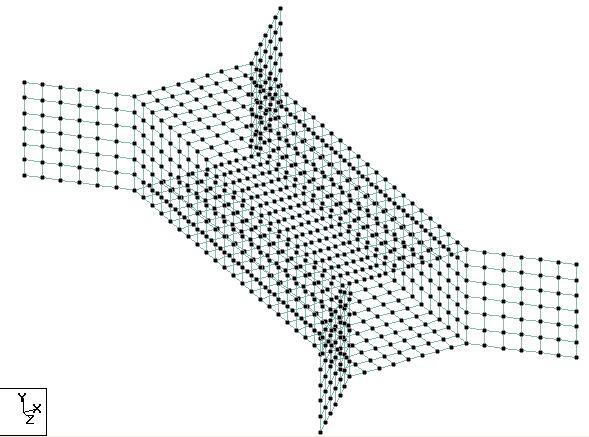
After forming this, the wing walls can also be formed, which is followed by meshing (rectangular or polygonal) to form the shell of the box culvert. The final output of the meshing operation is as shown below;
3D 2Bmeshing
Fig 3: Fully Meshed Box Culvert

The meshing process can be completed by adding plate thickness of 300 mm to all the elements.


(2) Assigning of support conditions/foundations
This is an important aspect of modelling structures. A purely rigid approach will involve using fixed supports, but note that employing 3D model for this purpose will not be very appropriate, but a simple 2D frame model will be better. There are many proposals on how culverts can be modelled as 2D frames, and the reader is advised to consult as many publications as possible. However, to incorporate the effects of soil-structure interaction (to a limited degree though) on our model, we can employ the use of ‘elastic plate‘ foundation option on our model.

If we assume that the supporting soil and the backfill are of the same material, then we can maintain the same angle of internal friction of 30°. Angle of internal friction of 30° can suggest a loose – medium dense sand in its undisturbed state, therefore we can take a modulus of subgrade reaction of 50,000 kN/m2/m for a well compacted sand. For a slightly compacted sand, you can take a value of 30,000 kN/m2/m.

So we can input this option into Staad Pro using ‘compression only’ option (see the dialog box below in Fig 4);
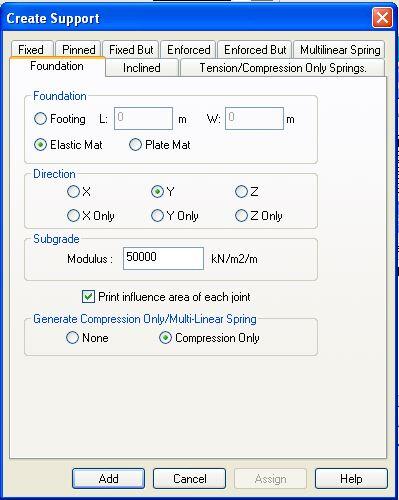
elastic 2Bmat 2Bfoundation 2Bon 2BStaad 2Bpro
Fig 4: Elastic Mat Foundation Dialog Box

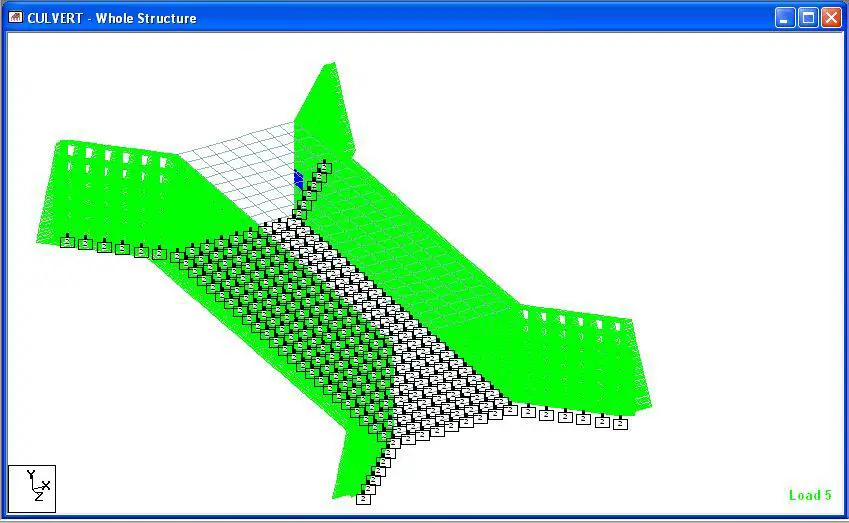
When this is applied on the structure, we have the final model as shown in Fig 5;
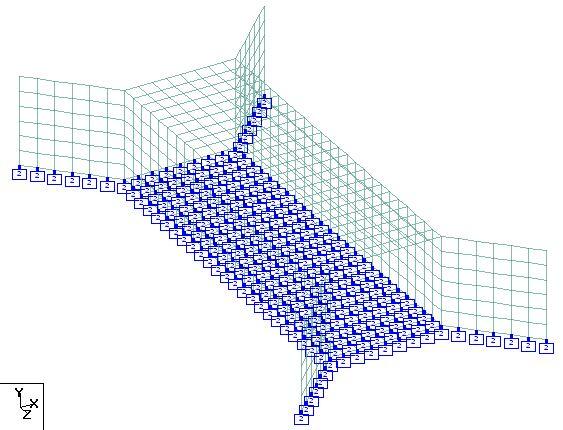
3D 2BELASTIC 2BMAT 2BFOUNDATION
Fig 5: Application of Elastic Mat Foundation on the Model

What this model (Fig. 5)  means is that every node of the base slab is in contact with the soil, and the soil is represented by a spring of stiffness 50,000 kN/m2/m which is the subgrade modulus of the soil.

front
[Get this publication on Design of Swimming Pools and Underground Water Tanks into your mailbox by clicking HERE or by clicking on the book cover]
Do you wish to get trained in theory of structures, structural design, and use of Staad Pro for analysing and designing of complex structures? Then quickly contact us;
E-mail: info@structville.com or rankiesubani@gmail.com
WhatsApp: +2347053638996 

(3) Loading
This is another important aspect of modelling structures because analysis results would go very wrong if the loads are not applied properly. If you review our previous post, we considered two construction cases;

(A) where the culvert is buried under the soil, and
(B) where is there no earth fill on top of the culvert.

When there is no earth fill on the culvert, the traffic load is directly on the top slab of the culvert as tandem loads and as UDL, but when there is earth fill, traffic load is dispersed in the ratio of 2:1 as UDL on the culvert. We are going to consider 5 load cases in our analysis in this model;

(1) Self weight and other superimposed actions
(2) Vertical earth load
(3) Traffic load
(4) Surcharge load
(5) Horizontal earth pressure load

These  load cases are considered independently at first, and then combined with appropriate partial factors of safety to determine the design actions. Please note that effects of ground water and the pressure in the shell of the culvert when it is filled with water is an important load case too but was not considered in this post. We have determined the magnitude of these loads in our previous post, and we are going to apply them on the box culvert for Case A and Case B.

In our previous post, we were able to analyse the loads on the culvert for Case A as follows;

(1) Self weight: To be calculated automatically by Staad + 1.69 kN/m2 (self weight of asphalt wearing course)
NB: In some cases, the partial factor of safety for self weight of concrete elements and other superimposed dead loads like asphalt wearing course might be different, so in that case, it is very advisable to treat each of them as a separate load case on Staad.
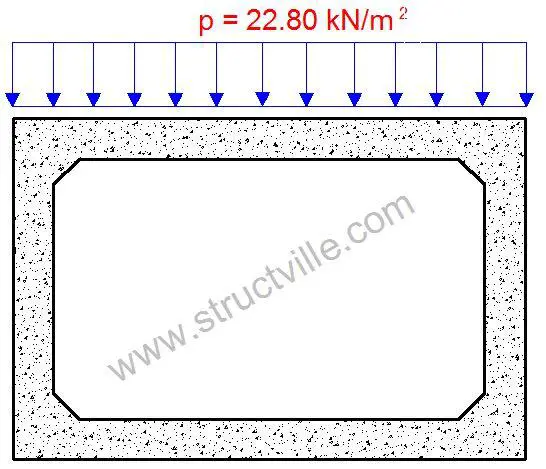
(2) Vertical earth load on the culvert = 22.80 kN/m2
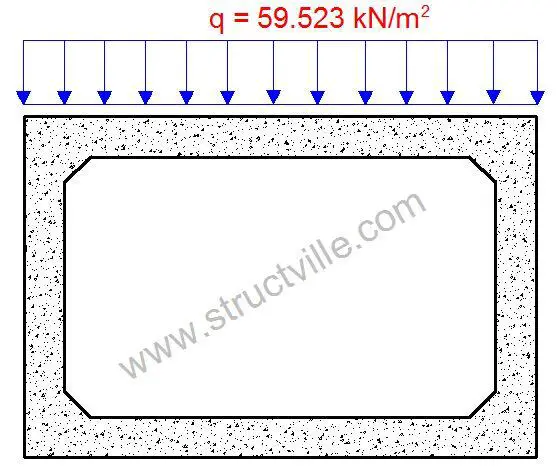
(3) Traffic load dispersed as UDL = 59.523 kN/m2
(4) Horizontal surcharge load = 5.0 kN/m2
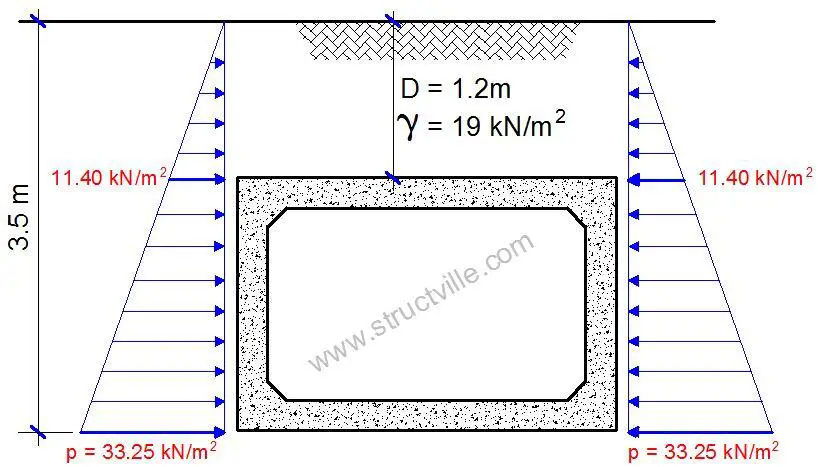
(5) Horizontal earth pressure load = trapezoidal distribution with minimum earth pressure of 11.40 kN/m2 at the top of the culvert and 33.25 kN/m2 at the bottom of the culvert
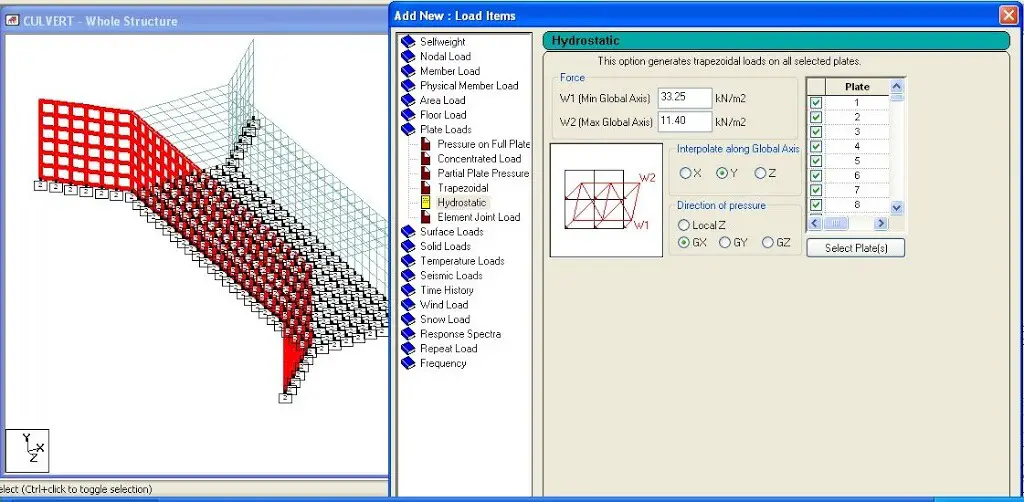
Load cases 1-4 are very easy to apply on Staad by utilising uniform pressure action on plates, however while load cases 1-3 are applied in the global Y direction (gravity loads), load cases 4-5 are applied in the global X direction (horizontally). I will only demonstrate how load case 5 can be applied, since it will involve using the hydrostatic load command on Staad. This is shown on Fig. 6.
HORIZONTAL 2BEARTH 2BPRESSURE 2BLOAD 2BON 2BSTAAD 2BPRO
Fig 6: Application of Horizontal Earth Pressure as Hydrostatic Load on Staad
The steps involved in applying hydrostatic load can be described as follows:
(i) Launch the hydrostatic plate pressure load on Staad
(ii) Select/highlight all the plates that will receive the load
(iii) Input the minimum and maximum pressure loads based on the notation given on Staad (in this case you can see that our maximum pressure load served as W1), and also input the sign conventions properly in order to identify the direction of pressure.
(iii) Put the interpolation direction (in this case we interpolated the load in the Y-direction)
(iv) Add the load case
After all said are done, the output should be as given below;
PRESSURE 2BLOAD
Fig 7: Earth Pressure on the Culvert
At this point, we are going to define the load combination for ultimate limit state as succinctly as possible. The reader is advised to consult the relevant code of practice and standard textbooks on how to group and combine loads involving traffic actions, earth load, etc. In this case, EN 1990, EN 1991-1, EN 1991-2, and EN 1997-1 can be consulted. Note that culverts are also analysed for other loads such as temperature effects, collision on head walls, centrifugal actions, braking actions, etc.
The load combination principle adopted here is based on expressions (6.10a and 6.10b) of EN 1990.
From Table A2.4(B) of EN 1990:2002 + A1:2005, we are going to adopt the following partial factors:
  • All permanent actions including superimposed dead load and vertical earth pressure  γG = 1.35
  • Leading/main traffic action γQ,1 = 1.35
  • Traffic surcharge γQ,2 = 1.5
  • Horizontal earth pressure and ground water γQ,2  = 1.5
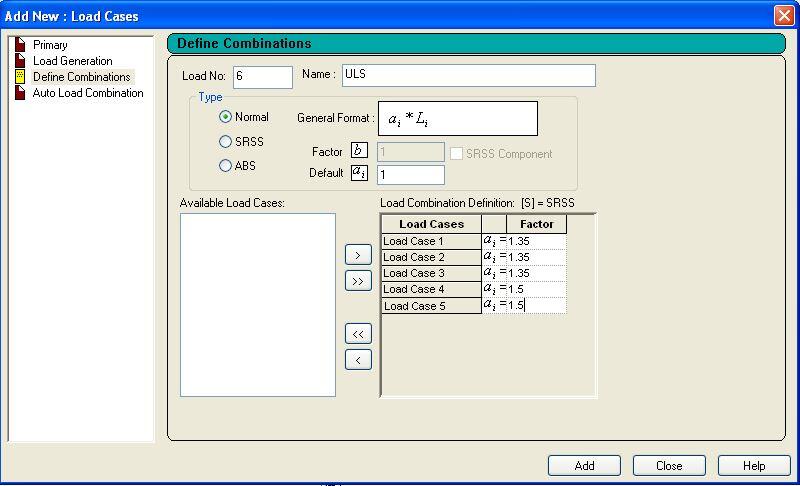
We will now apply this load combination on Staad Pro as shown in Fig. 8.

ULS
Fig 8: ULS Load Combination Dialog Box


(4) Analysis
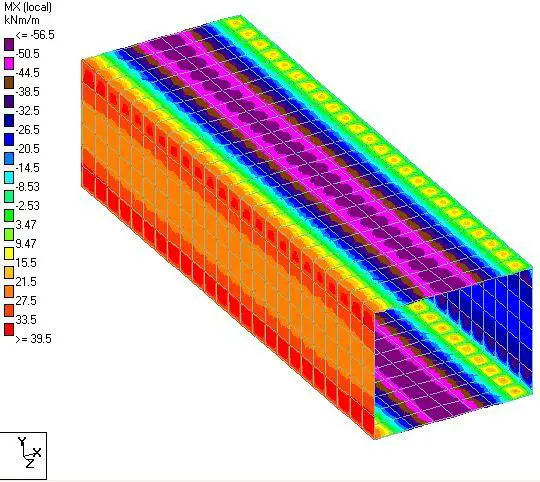
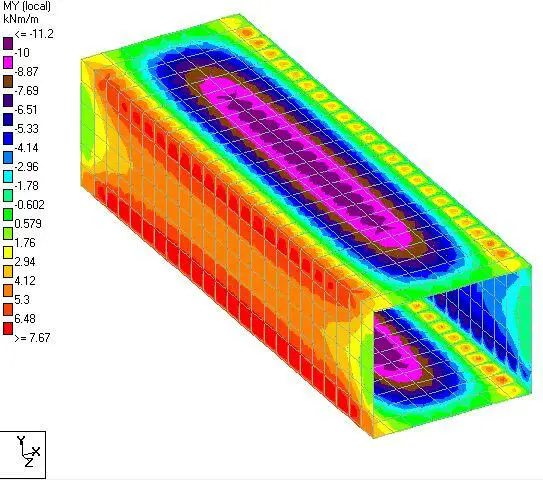
On analysing the structure, we obtain the following results at ultimate limit state;
MX
Fig 9: Transverse Bending Moment
final 2Bfront 2Bcover

[Get this publication on Design of Residential Buildings Using Staad, Orion, and Manual Calculations into your mailbox by clicking HERE or by clicking on the book cover]
Do you wish to get trained in theory of structures, structural design, and use of Staad Pro for analysing and designing of complex structures? Then quickly contact us;
E-mail: info@structville.com or rankiesubani@gmail.com
WhatsApp: +2347053638996 
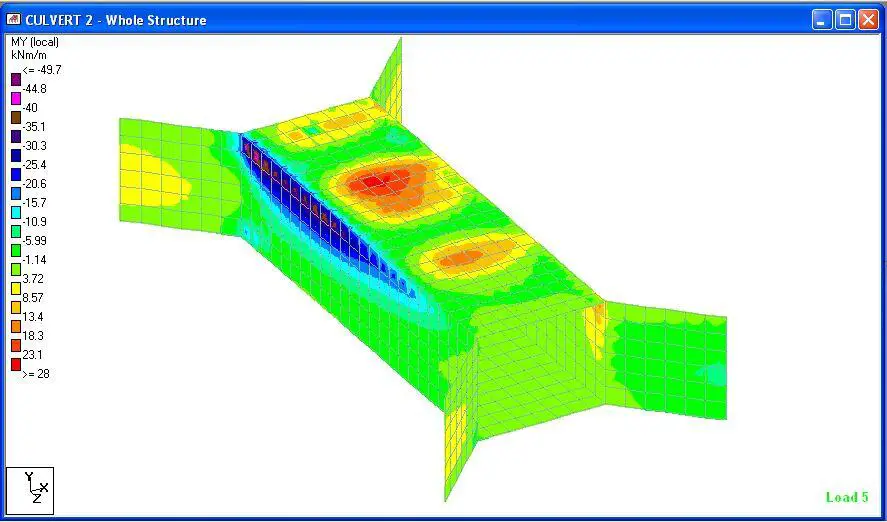
MY
Fig 9: Longitudinal Bending Moment
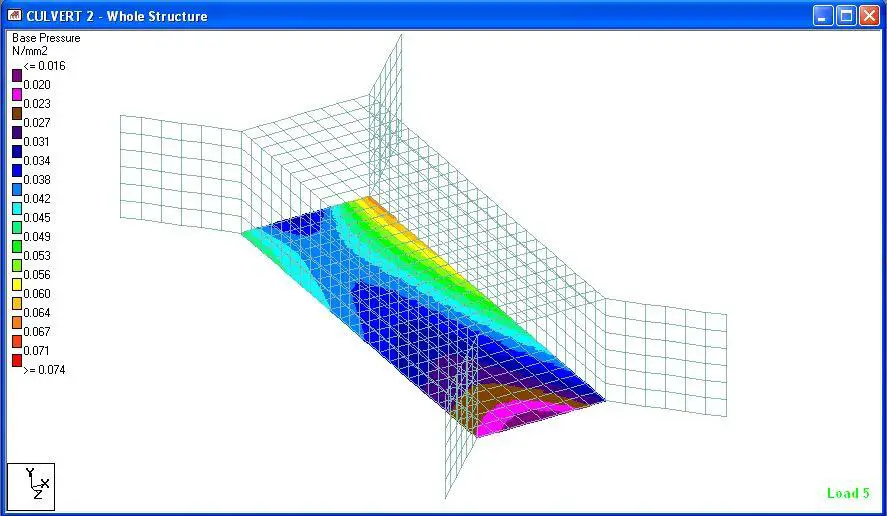
BASE 2BPRESSURE
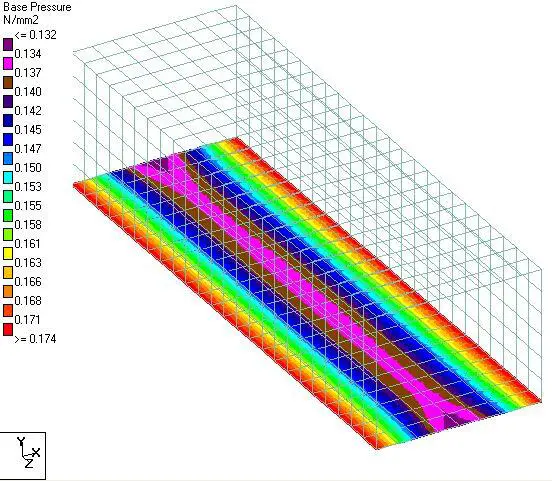
Fig 10: Base Pressure
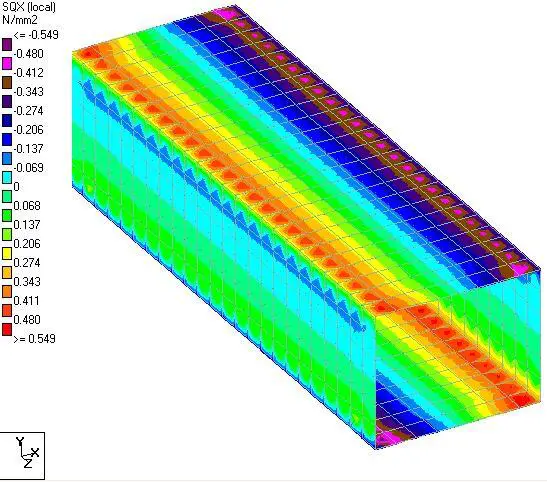
SQX
Fig 11: Transverse Shear Stress

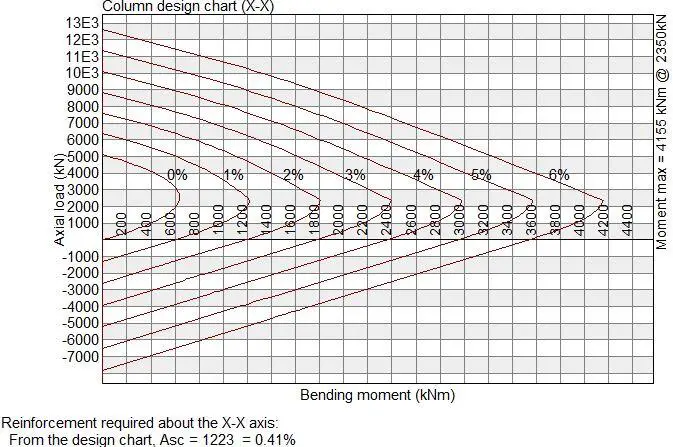
A little consideration will show that the top slab is subjected to an ultimate design moment MEd of 56.5 kNm/m and an axial pull of NEd of 91.5 kN/m (check for membrane stresses in your own Staad Model).

NB: Shear and membrane forces in plates are expressed in Mpa in Staad, so will you have to multiply them with the thickness of the element to get the values in kN/m.

For the top slab of the culvert, the M-N interaction chart is given in Fig. 11 below for obtaining the design reinforcement.
Column 2Bdesign 2Bchart
Fig 12: M-N Interaction Chart on the Box Culvert

When designed, the area of steel for the axial compression and bending is 1223 mm2/m. Therefore, provision of H16@200 c/c (Asprov = 2010 mm2) on each face will be adequate.

Design Case B: No Earth Fill on Box Culvert
(1) Traffic Loads
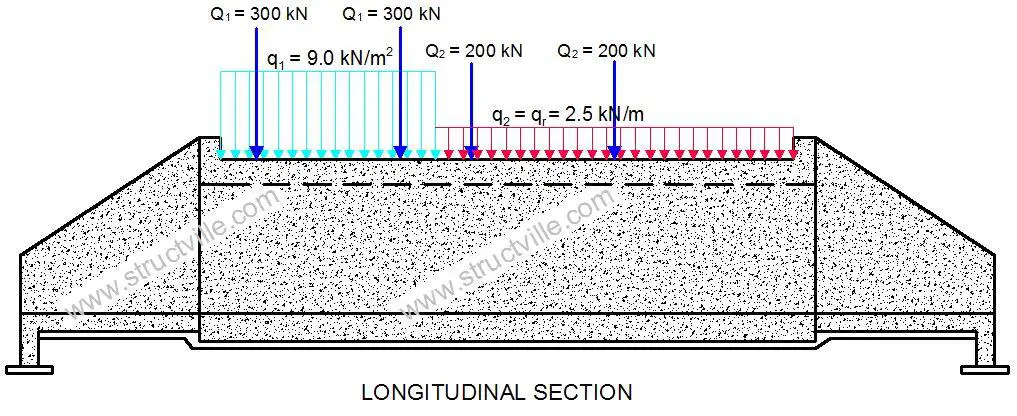
When there is no earth fill on the box culvert, all we have to do is to remove the vertical earth fill load, apply direct traffic load on the top slab, and edit the horizontal earth load from trapezoidal to rectangular. As a reminder, the nature of Load Model 1 (which can be used for global and local verification) on the culvert is given in Fig 14 below;
Eurocode 2Btraffic 2Bload 2Bon 2Bculvert
Fig 14: Load Model 1 on the Culvert

The ideal thing is to apply a moving load on Staad after vehicle definition, such that the worst effect can be obtained. Note that you cannot apply a moving load directly on plate elements on Staad Pro, but you will need to create dummy beam members of negligible stiffness so that the axles can sit on them. In this post, we are not going to bother ourselves with the process, but we are going to treat the wheel load as static.

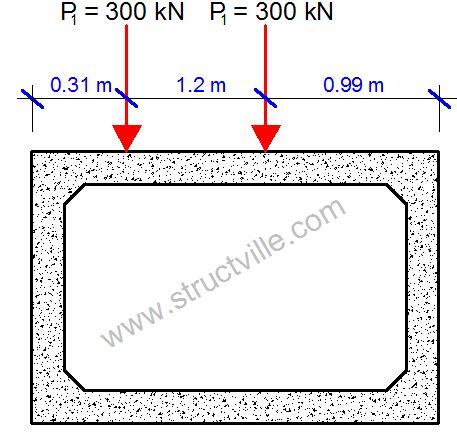
Influence line has shown that the most onerous bending moment is obtained when the front axle is 0.26 m beyond the mid-span of the culvert. Therefore, we are going to apply static wheel load at that location. Remember that it is always recommended to apply the full tandem system of LM1 whenever applicable. The critical location of wheel load on the box culvert for maximum moment is given in Fig 15 below;
most 2Bcritical 2Bwheel 2Bload 2Blocation 2Bon 2Bbox 2Bculvert
Fig 15: Most Critical Location of Wheel Load on the Culvert
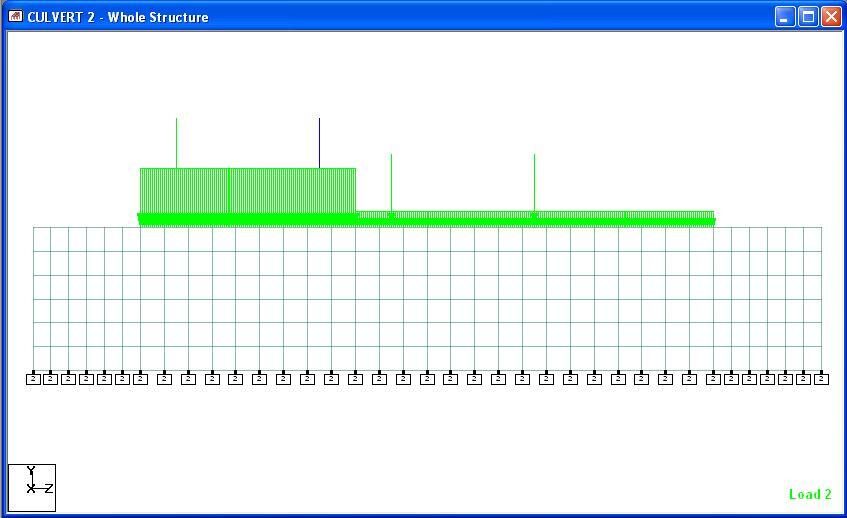
When the static traffic load is applied on Staad and viewed longitudinally on the box culvert, we can see it as given in Fig 16 (note that the unloaded areas represent the wing walls).
Traffic 2Bload
Fig 16: Application of LM1 on Staad Pro

(2) Non-traffic Loads
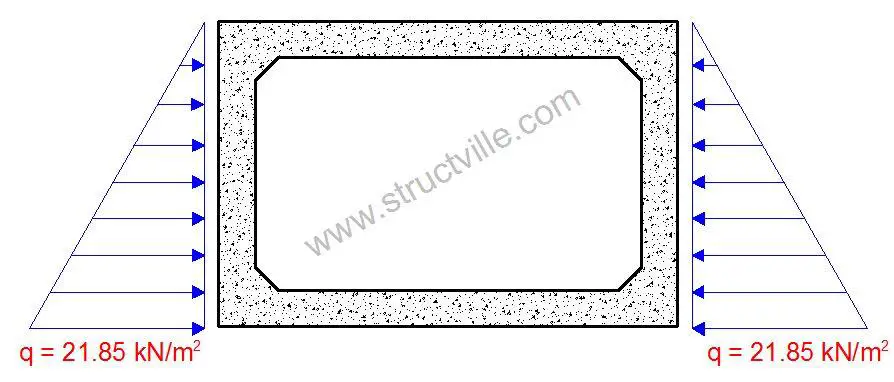
For Design Case A, it is observed that the self weight of the structure and asphalt layer remains the same, the surcharge load also remains the same, but the horizontal earth pressure changes to triangular distribution with a maximum pressure of 21.85 kN/m2 at the bottom of the culvert.


(3) Analysis
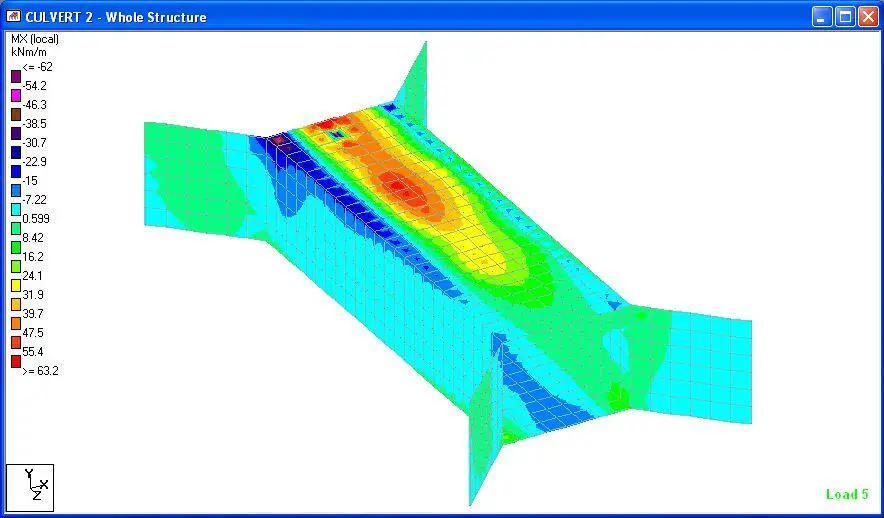
When the structure is analysed, the results at ultimate limit state are as shown below;
MX2
Fig 17: Transverse Bending Moment
MY2
Fig 18: Longitudinal Bending Moment
BASE 2BPRESSURE 2B2
Fig 19: Base Pressure

Our analysis results have shown that when there is earth fill, the bending moment at ultimate limit state on top of the culvert is about 56.5 kNm/m, but when traffic is directly on top of the culvert, the bending moment is about 62 kNm/m. This is about 8.8% difference.

Thank you for visiting Structville today, and remember to share this post with your friends and colleagues.

Do you wish to get trained in theory of structures, structural design, and use of Staad Pro for analysing and designing of complex structures? Then quickly contact us;
E-mail: info@structville.com or rankiesubani@gmail.com
WhatsApp: +2347053638996


Loading and Design of Box Culverts to the Eurocodes

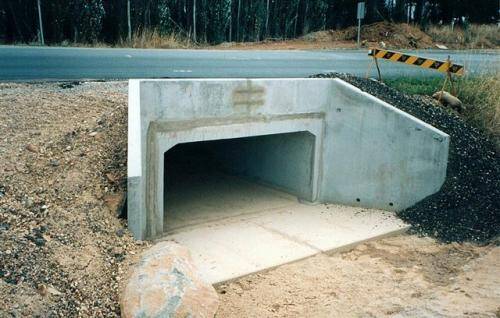
A culvert is a drainage structure designed to convey stormwater or stream of limited flow across a roadway. Culverts can consist of single or multi-span construction, with a minimum interior width of 6 m when the measurement is made horizontally along the centreline of the roadway from face to face of side walls.

Technically, any such structure with a span over 6 m is not a culvert but can be treated as a bridge. Box culverts consist of two horizontal slabs at the top and bottom, and two or more vertical side walls which are built monolithically.

For proper performance of culverts in their design life, there must be a hydraulic design, which will give the geometric dimensions or openings that will convey the design flood.  It is typical for culverts to be designed for the peak flow rate of a design storm of acceptable return period.

The peak flow rate may be obtained from a unit hydrograph at the culvert site, or developed from a stream flow and rainfall records for a number of storm events. In the absence of hydraulic data, it is wise to make conservative assumptions based on visual inspection of the site, performance of existing culverts and other drainage infrastructures, or by asking locals questions.

Structural Design of Box Culverts

Structural design begins when the structural design units receive the culvert survey and hydraulic design report from the hydraulics unit. The report in conjunction with the roadway plans shall be used to compute the culvert length, design fill, and other items that lead to the completed culvert plans.

Box culverts are usually analysed as rigid frames, with all corner connections considered rigid and no consideration for side sway. The centreline of slabs, walls and floor are used for computing section properties and for dimensional analysis. Standard fillets which are not required for moment or shear or both shall not be considered in computing section properties.
Design Loads

The structural design of a reinforced concrete box culvert comprises the detailed analysis of a rigid frame for bending moments, shear forces, and axial forces due to various types of loading conditions outlined below:

(i) Permanent Loads

  • Dead loads
  • Superimposed dead loads
  • Horizontal earth pressure
  • Hydrostatic pressure and buoyancy
  • Differential settlement effects

(ii) Vertical Live Loads

  • HA or HB loads on the carriageway (Load Model 1 of Eurocode)
  • Footway and Cycle Track Loading
  • Accidental Wheel Loading
  • Construction Traffic

(iii) Horizontal Live Loads

  • Live Load Surcharge
  • Traction
  • Temperature Effects
  • Parapet Collision
  • Accidental Skidding
  • Centrifugal Load

I believe that these loads are very familiar to designers, otherwise, the reader should consult standard textbooks. However, I am going to point out some important considerations worthy of attention while assessing design loads on culverts.
Loading of Box Culverts to Eurocode 1 Part 2 (EN 1991-2)

The traffic loads to be applied on box culverts are very similar to those to be applied on bridges. The box culvert will have to be divided into notional lanes as given in Table 1;

Carriageway width (w)Number of notional lanes (n)Width of the notional laneWidth of the notional lane
w < 5.4 m13 mw – 3m
5.4 ≤ w < 6m20.5w0
6m ≤ wInt(w/3)3 mw – 3n
Table 1: Division of Carriageway into Notional Lanes

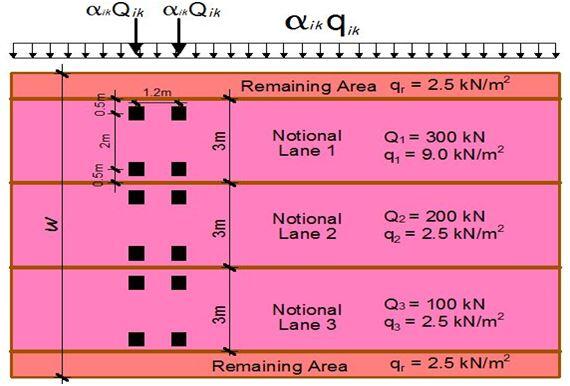
The loading of the notional lanes according to Load Model 1 (LM1) is as given in Figure 1;

load 2Bmodel 2B1
Fig 1: Application of Traffic Load on Notional Lanes

Concentrated loads

According to BD 31/01, no dispersal of load is necessary if the fill is less than 600 mm thick for HA loading. However, once the fill is thicker than 600 mm, 30 units of HB loads should be used with adequate dispersal of the load through the fill. This same concept can be adopted for LM1 of EN 1991-2.

Earth Pressure

Depending on the site conditions, at rest pressure coefficient ko = 1 – sin (∅) is usually used for analysing earth pressure.

Loading Example

A culvert on a roadway corridor has the parameters given below. The culvert was found at a location with no groundwater problem. Using any suitable means, obtain the design internal forces induced in the members of the culvert due to the anticipated loading conditions when the culvert is empty under the following site conditions:

(1) The top slab of the culvert is in direct contact with the traffic carriageway and overlaid with 75 mm thick asphalt
(2) There is a 1.2 m thick fill on the top of the culvert before the carriageway formation level.

The geometry of the culvert
Total length of culvert = 8 m
Width of culvert c/c of side walls = 2.5 m
Height of culvert c/c of top and bottom slabs = 2.0 m
Length of wing walls = 2.12 m
The thickness of all elements = 300 mm
The thickness of the asphalt layer = 75 mm

Materials property
The angle of internal friction of fill soil = 30°
Unit weight of water = 9.81 kN/m3
Unit weight of backfill soil = 19 kN/m3
Unit weight of concrete = 25 kN/m3
Unit weight of asphalt concrete = 22.5 kN/m3
fck = 30 Mpa
fyk = 500 Mpa
Concrete cover = 50 mm

front

[Get this publication on Design of Swimming Pools and Underground Water Tanks into your mailbox by clicking HERE or by clicking on the book cover]

Load Analysis
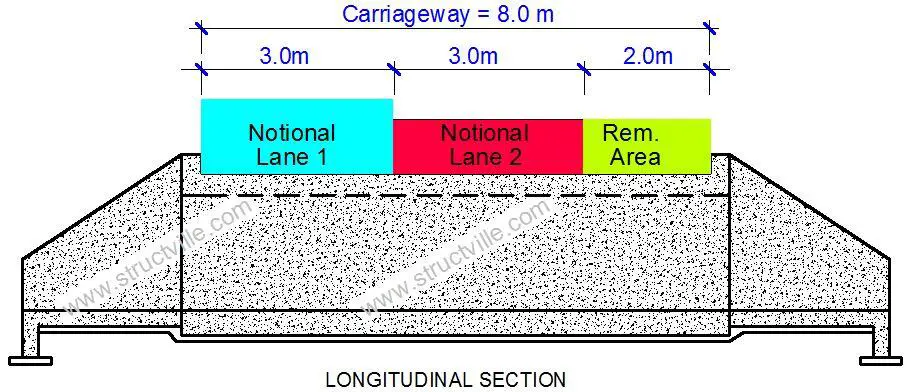
Width of carriageway = 8 m
Number of notional lanes = 8/3 = 2 notional lanes
Width of the remaining area = 8 – (2 × 3) = 2 m

(1) Case 1: Box culvert with no earth fill
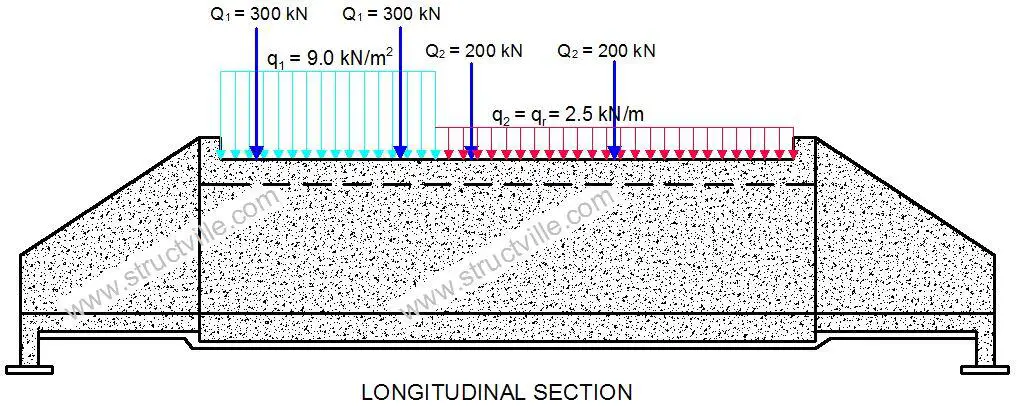
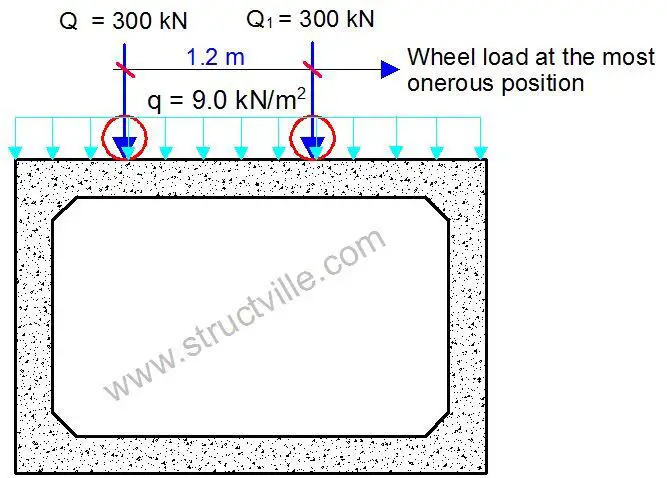
(a) Applying the recommended traffic actions on the notional lanes

Notional 2Blane 2Bon 2Bculvert
Fig 2: Division of the Culvert Carriageway into Notional Lanes
Eurocode 2Btraffic 0A 0A 2Bload 2Bon 2Bculvert 1
Fig 3: Loading of the Notional Lanes
traffic wheel load on box culvert
Fig. 4: Section of the Culvert across Notional Lane 1

(b) Permanent actions
The self-weight of the structure should be calculated by Staad Pro software, but let us show how we can easily compute and apply it to the structure;

(i) Self-weight of top slab
Thickness of top slab = 300 mm = 0.3 m
Self weight of the slab per unit length = 0.3 m × 25 kN/m3 = 7.5 kN/m2

(ii) Permanent action from the asphalt layer
Thickness of asphalt = 75 mm = 0.075 m
Self weight of the asphalt per unit length = 0.075 m × 22.5 kN/m3 = 1.69 kN/m2

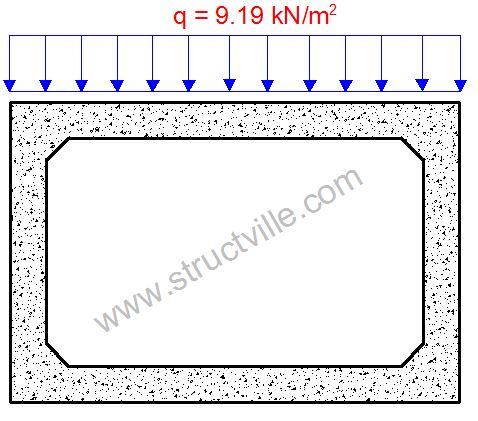
For the purpose of simplicity, let us combine these two actions such that the permanent action is given by gk = 7.5 + 1.69 = 9.19 kN/m2

TOP 2BSLAB
Fig 5: Permanent Action on Top of the Box Culvert

(iii) Earth Pressure
At rest earth pressure coefficient ko = 1 – sin (∅) = 1 – sin (30) = 0.5
Maximum earth pressure on the side walls p = koρH = 0.5 × 19 kN/m3  × 2.3m = 21.85 kN/m2

earth 2Bpressure 2Bon 2Bculvert 2Bwall
Fig 6: Horizontal Earth Pressure on the Culvert Walls

(iv) Live load Surcharge
Consider a live load surcharge of q = 10 kN/m2
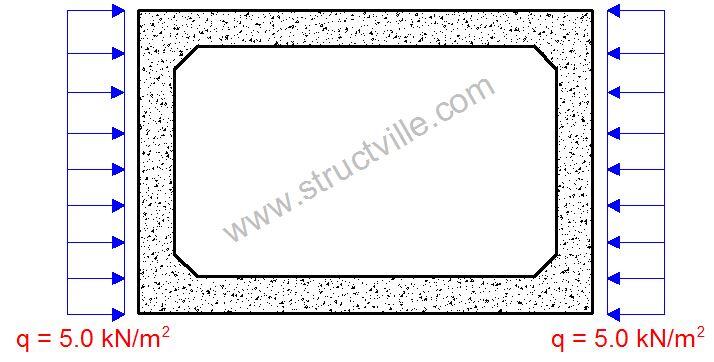
Therefore horizontal surcharge pressure = koq = 0.5 × 10 kN/m2  = 5.0 kN/m2

surcharge 2Bon 2Bculvert 2Bwall
Fig 7: Live Load Surcharge on the Walls of the Culvert

When the culvert is full, the hydrostatic pressure profile inside the culvert can also be easily obtained. However, this was not considered in this analysis.

(2) Case 2: Box culvert with 1.2 m thick earth fill
(a) Traffic Load on the Box Culvert
In this case, since the thickness of the fill is greater than 0.6 m, we are going to consider the wheel load of the traffic actions dispersed to the top slab of the culvert as a uniformly distributed load. The UDL of traffic action will not be considered.

For this case, let us use Load Model 1 of EN 1991-2 which is recommended by clause 4.9.1 of EN 1991-2. The tandem load can be considered to be dispersed through the earth fill and uniformly distributed on the top of the box culvert. The contact surface of the tyres of LM1 is 0.4m x 0.4m, which gives a contact pressure of about 0.9375 N/mm2 per wheel.

load 2Bmodel 2B1 2Btandem 2Bsystem 1
Fig 8: LM1 Tandem System

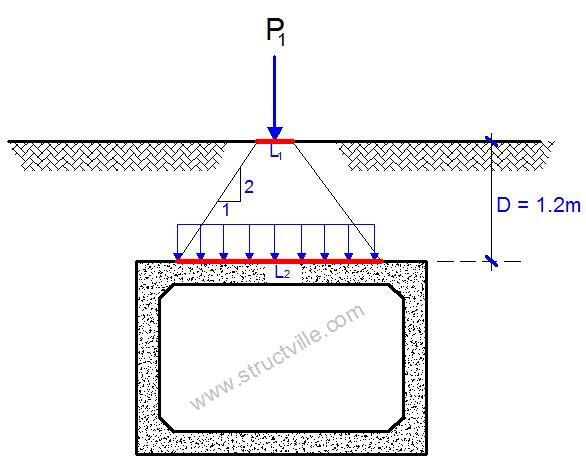
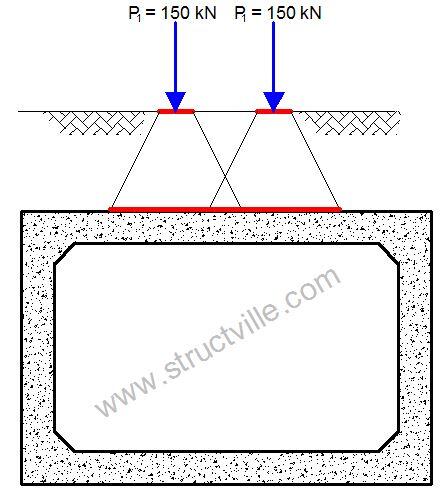
We are going to disperse the load through the earth fill to the box culvert by using the popular 2(vertical):1(horizontal) load increment method. This is the method recommended by BD 31/01, otherwise, Boussinesq’s method can also be used. However, clause 4.9.1 (Note 1) of EN 1991-2:2003 recommends a dispersal angle of 30° to the vertical for a well-compacted earth fill. A little consideration will show that this is not so far away from the 2:1 load increment method.

Load 2BDispersal 2Bon 0A 0A 2BBox 2BCulvert 1
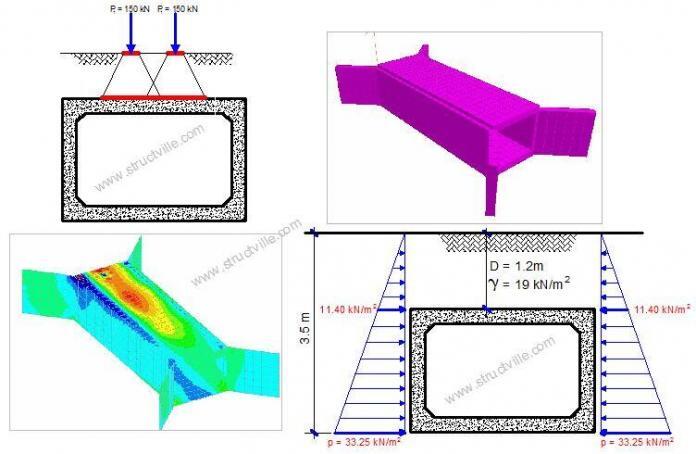
Fig 9: Single Wheel Load Distribution Through Compacted Earth Fill

For the arrangement in Fig 9 above;
P1 = 150 kN
L1 = 0.4 m
L2 = 0.4 + D = 0.4 + 1.2 = 1.6 m

Therefore, the equivalent uniformly distributed load from each wheel to the culvert is;
qec = 150/(1.6 × 1.6) = 58.593 kN/m2

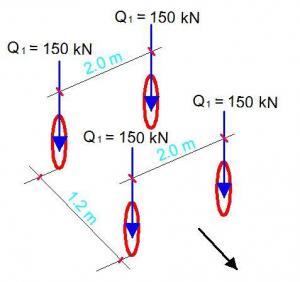
It is acknowledged that the pressure from each wheel in the axles can overlap when considering the tandem system as shown in the figure below. This is considered in the lateral and longitudinal directions.

tandem 2Bload 2Bon 0A 0A 2Bbox 2Bculvert
Fig 10: Overlapping Tandem Axle Load Dispersion Through Earth Fill

When considering the tandem system as shown in Figure 10;
∑Pi = 150 + 150 + 150 + 150 = 600 kN
L2 = 1.2 + 0.4m + 1.2m = 2.8 m (Spacing of wheels + contact length + depth of fill)
B2 = 2.0 m + 0.4m + 1.2m = 3.6 m (Spacing of wheels + contact length + depth of fill)
qec = 600/(2.8 × 3.6) = 59.523 kN/m2
As can be seen, the difference between considering the entire tandem system and one wheel alone is not much. But to proceed in this design, we will adopt the pressure from the tandem system.

Therefore the traffic variable load on the box culvert is given in Fig. 11 below;

traffic 2Bvariable 2Bload
Fig 11: Equivalent Traffic Load Distribution on Top of the Box Culvert
final 2Bfront 2Bcover

[Get this publication on Design of Residential Buildings Using Staad, Orion, and Manual Calculations into your mailbox by clicking HERE or by clicking on the book cover]

(b) Earth load on top of the box culvert
At a depth of 1.2 m, the earth pressure on the box culvert is given by;
p = 1.2 × 19 kN/m= 22.8 kN/m2

Earth 2Bload
Fig 12: Earth Load on Buried Culvert

(c) Horizontal Earth Pressure on the Box Culvert
Since the box culvert is buried under the ground, the pressure distribution is as given in Figure 13.

The maximum pressure at the base of the culvert (at 2.3 m) is given by;
pmax =  koρH = 0.5 × 19 kN/m3  × 3.5 m = 33.25 kN/m2

The minimum pressure at the top of the culvert (at 1.2 m below the ground) is given by;
pmin =  koρH = 0.5 × 19 kN/m3  × 1.2 m = 11.40 kN/m2

horizontal 2Bearth 2Bpressure 1
Fig 13: Horizontal Earth Pressure on Buried Box Culvert

(d) Surcharge load
The horizontal surcharge load distribution on the buried box culvert will be the same as that of case A.

Thank you for visiting Structville today. We are going to present the actual analysis and design of box culverts using Staad Pro in our next post which will come shortly. Please stay tuned and God bless you.

Preliminary Plastic Analysis of Portal Frames

Steel portal frames provide economical solution for construction of industrial structures, warehouses, churches or other buildings with large enclosures. The loading scheme on portal frames usually includes dead load, wind load, imposed load, service loads, snow loads, imperfections, thermal loads, crane loads etc.

In the plastic analysis of portal frames, preliminary analysis is usually carried out to determine member sizes before detailed checks are carried out to determine the adequacy of the selected sections. Weller’s chart is usually used to quickly determine the plastic moments that can enable initial sizing of members. The simplicity of the charts depends on a series of three charts developed by Weller. The application of the method relies on the following assumptions;

(1) The rafter depth is approximately span / 55
(2) The hunch length is approximately span /10
(3) The rafter slope lies between 10° and 20°.
(4) The ratio of span to eaves height is between 2 and 5.
(5) The hinges in the mechanism are formed at the level of the underside of the haunch in the column and close to the apex.

Each chart requires a knowledge of the geometry of the frame and the design loading as input data in order to determine approximate sizes for the column and rafter member.

Application Example

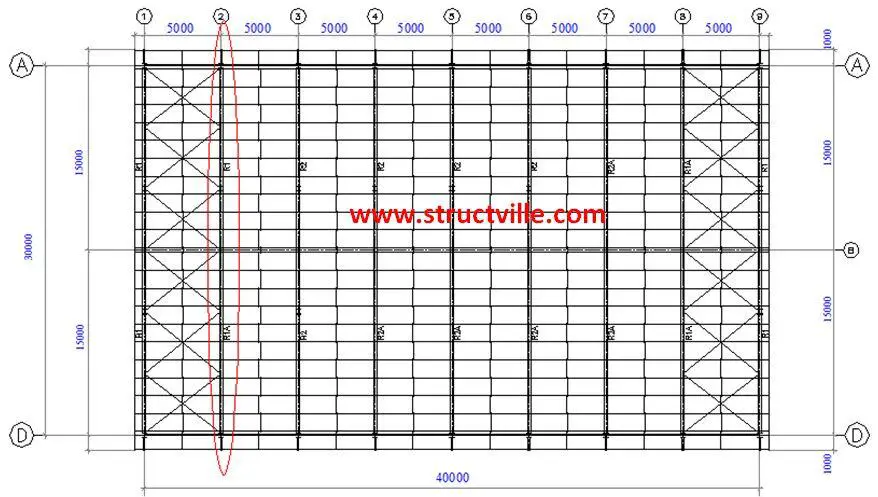
roof 2Blayout 2Bgeneral 2Barrangement
Fig 1: General Arrangement of Steel Structure


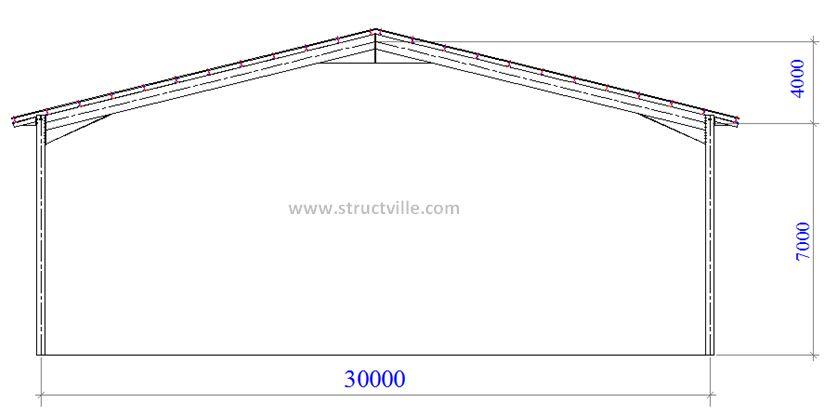
portal 2Bframe 2Bsection
Fig 2: Portal Frame

Length of building = 40 m
Width of building = 30 m
Height to eaves = 7.0 m
Height to roof top = 11.0 m

Consider the portal frame on gridline 2. The gravity load on the portal frame is analysed as follows;

Load Analysis 
(1) Dead Load
Aluminium roof sheeting = 0.04 kN/m2
Insulation (assume gypsum boards per 10 mm thickness) = 0.077 kN/m2
Other permanent services = 0.15 kN/m2
Steel purlins (take) = 0.03 kN/m2
Self weight of rafter (take) = 0.15 kN/m2
Total = 0.447 kN/m2 on slope

Angle of inclination of roof = 15°
Load on plan = 0.447/cos 15° = 0.4627 kN/m2

Spacing of portal frame = 5 m centre to centre
Therefore dead load on roof gk = 0.4627 kN/m2 x 5m = 2.31 kN/m

(2) Imposed Load
According to BS 6399 Part 3, for roof with slope less than 30°, a minimum imposed load of 0.6 kN/m2 on plan should be provided as long as no access except for cleaning and maintenance is provided.

For this design, let us adopt an imposed load of 0.75 kN/m2

qk = 0.75 kN/m2

Imposed load on roof = 0.75 x 5m = 3.75 kN/m

At ultimate limit state;
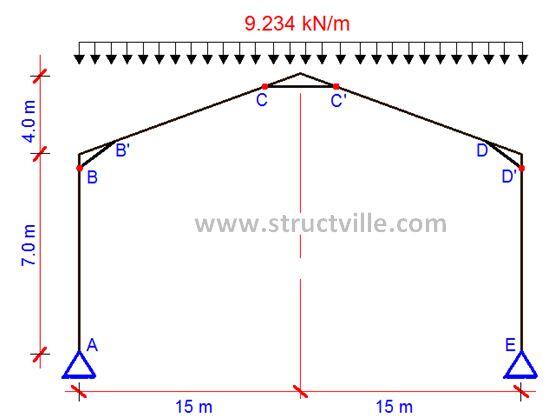
p = 1.4gk + 1.6qk = 1.4(2.31) + 1.6(3.75) = 9.234 kN/m

portal 2Bframe 2Bloaded
Fig 3: Portal Frame with ULS Gravity Load


Step by Step Analysis

(a) Calculate the span/height to eaves ratio = L/h
Span/height to eaves ratio L/h = 30/7 = 4.285

(b) Calculate the rise/span ratio = r/L
Height of Rise / span ratio r/L = 4/30 = 0.133


(c) Calculate the total design load FL on the frame and then calculate FL2, where F is the load per unit length on plan of span L
Ultimate gravity load = 9.234 kN/m (see Fig. 3)
Total load on the frame (wL) = 9.234 x 30 = 277.02 kN
Parameter wL2 = 9.234 x 302 = 8310.6 kNm

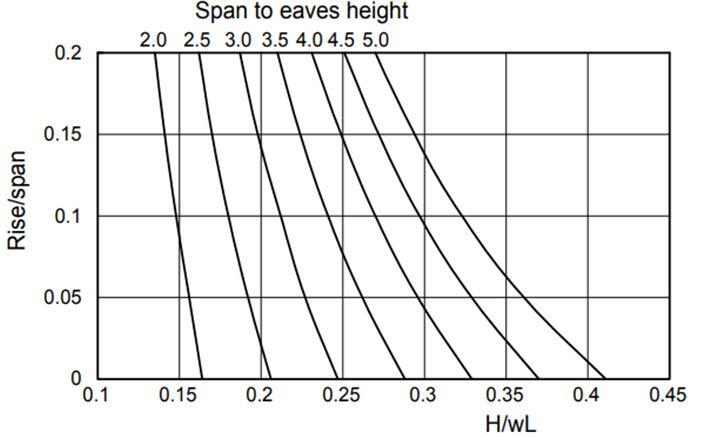
(d) From Fig 4 (Chart 1) obtain the horizontal force ratio HFR at the base from r/L and L/h

Chart 2B1
Fig 4: Chart 1

H/wL = 0.27
Hence, horizontal force ratio HFR = 0.27

(e) Calculate the horizontal force at the base of span H = HFR wL
Hence, H = 0.27 x 277.02 = 74.795 kN

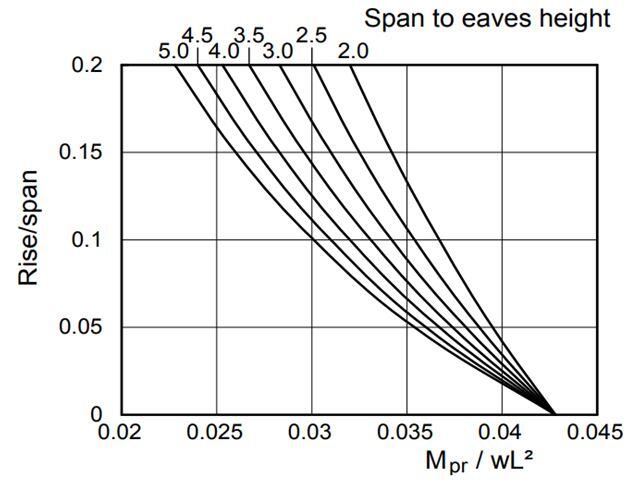
(f) From Fig 5 (Chart 2), obtain the rafter Mp ratio MpR from r/L and L/h.

Chart 2B2
Fig 5: Chart 2

Rafter MpR/wL2  ratio = 0.028

(g) Calculate the Mp required in the rafter from Mp(rafter) = MpR x wL2
Mp,Rafter = 0.028 x 8310.6 = 232.696 kNm

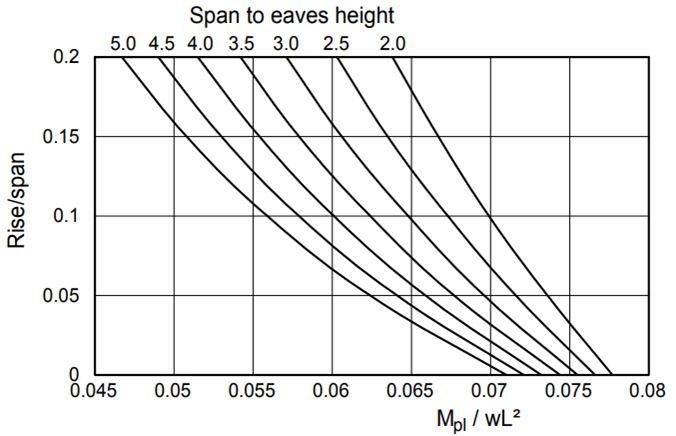
(h) From Fig 6 (Chart 3), obtain the column Mp ratio from r/L and r/h

Chart 2B3
Fig 6: Chart 3

Column MpC/wL2 ratio = 0.057

(i) Calculate the Mp required in the column from Mp,Column = MpC x wL2
Mp,Column  = 0.057 x 8310.6 = 473.70 KNm

(j) Determine the plastic moduli for the rafter Wpl,y,R and the column Wpl,y,C from
Wpl,y,RMp,Rafter /fy
Wpl,y,CMp,Column/fy

Where fy is the yield strength = 275 Mpa.

Using the plastic moduli, the rafter and column sections may be chosen from the range of plastic sections as so defined in the section books

Selection of Members
(a) For Rafters
Plastic Moment Mp,Rafter = 232.696 kNm
Plastic Modulus Required Sx
Sx = (232.696 x 10³) / 275 = 846 cm3
Try UB 356 x 171 x 57 kg/m (Plastic modulus = 1010 cm3)

(b) For Columns
Plastic Moment Mp,Columns = 473.7 kNm
Plastic Modulus Required
Sx = (473.7 x 10³) / 275 = 1722 cm3
Try UB 457 x 191 x 82 kg/m (Plastic modulus = 1830 cm3)

These trial sections are usually checked for the following in the detailed design;
(a) In-plane stability
(b) Column Stability
(c) Rafter Stability
(d) Haunch Stability
(e) Deflection etc.

Thank you for visiting Structville today and God bless you.


Structural Design of Flat Slabs

Flat slabs are slabs are two-way concrete slabs that are supported directly by columns without floor beams. Therefore, they offer economical solutions to larger floor spans in reinforced concrete buildings. The columns supporting the slab panel may or may not have drop panels.

Drop panels are particularly advantageous in situations where substantial negative moments occur at supports or where punching shear stresses are critical and the use of punching reinforcement is undesirable.

There are many advantages of flat slabs such as increased headroom, easier flow of mechanical and electrical services, ease in construction of formwork, faster construction etc. Unlike traditional beam and slab systems, flat slabs eliminate the use of floor beams, resulting in a cleaner, more open space.

Analysis of Flat Slabs

The following methods are usually employed in the analysis of flat slabs:

  • simplified coefficient approaches,
  • equivalent frame analysis,
  • yield line theory,
  • grillage analysis, and
  • finite element methods.

The application of simplified coefficients is subject to specific conditions outlined in Annex I of BS EN 1992-1-1. Yield line and finite element methods are particularly well-suited for computer-based analysis. Given this, this discussion will concentrate on the use of simplified coefficients.

In the Eurocodes, the analysis of flat slab is the same as that recommended in BS 8110. According to clause 3.7.2.7 of BS 8110, the simplified method can be used for flat slabs that the lateral stability is not dependent on the slab and columns provided that the following conditions are met;

(1) The slab is loaded with a single load case of all the panels loaded with maximum ultimate load. This means that the following requirements must be satisfied (clause 3.5.2.3);
(a) The area of each bay exceeds 30 m2
(b) The ratio of the characteristic imposed load to the dead load does not exceed 1.25
(c) The imposed load does not exceed 5 kN/m2

(2) There are at least three rows of approximately equal panels in the direction  being considered
(3)  Moments at supports can be reduced by 0.15Fhc

Table 2Bof 2Bcoefficients

Design Example of Flat Slab

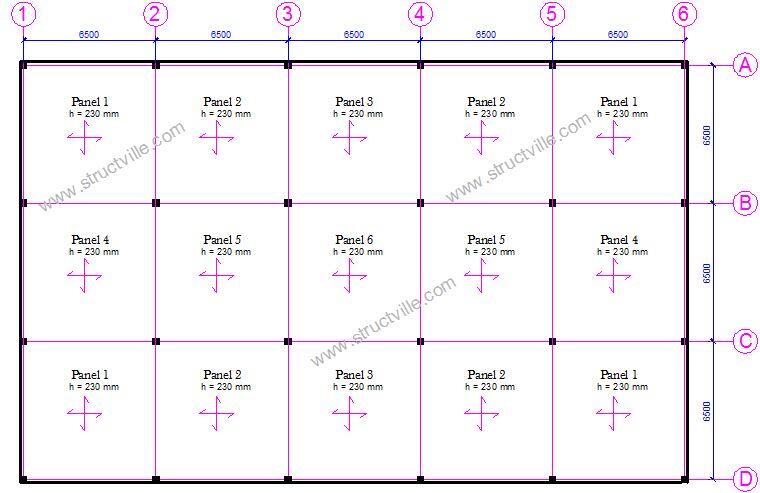
FLAT 2BSLAB 2BCONFIGURATION

In this article, we are going to analyse gridline 2 (same as gridline 5) of the flat slab general arrangement that is given above with the following data;

The thickness of slab = 230 mm (governed by deflection requirements)
fck = 30 Mpa
fyk = 500 Mpa
Imposed load = 3 kN/m2
Concrete cover = 30 mm
Size of columns = 300 x 300 mm

Load Analysis

Permanent Actions

Self weight = 0.23 × 25 = 5.75 kN/m2
Finishes = 1.2 kN/m2
Partition allowance = 1.2 kN/m2
Total permanent actions gk = 8.15 kN/m2

Variable Actions
Imposed floor load qk = 3 kN/m2

Total load on the floor F = 1.35gk + 1.5qk = 1.35(8.15) + 1.5(3) = 15.5 kN/m2

Effective span of the slab = 6500 – 2(300/2) + 2(230/2) = 6430 mm
Width of bay = 6500 mm
Width of column strip = 2(lx/4)= 2(6500/4) = 3250 mm
Width of middle strip = 6500 – 1625 – 1625 = 3250 mm

F = 15.5 × 6.5 × 6.5 = 654.875 kN

A little consideration will show that the slab under consideration met the conditions for use of coefficients.

image

For reference on how the panel was divided into middle and column strips, see Figure 3.12 of BS 8110-1:1997.

Bending Moments (In the longitudinal direction)

Sagging – First Span
M = 0.086 × 654.87 × 6.43 = 362.13 kNm

Hogging – First interior support
M = -0.086 × 654.87 × 6.43 = -362.13 kNm

The apportionment of moments between column strips and middle strips is shown in Table 2:

HoggingSagging
Column strip70%50%
Middle strip30%50%

(Column Strip)
Hogging moment (Support B and C)
MEd = 0.7 × (362.13/3.25) = -77.99 kNm/m

Sagging moment:
MEd = 0.5 × (362.13/3.25) = 55.71 kNm/m

(Middle Strip)
Hogging moment (Support B and C)
MEd = 0.3 × (362.13/3.25) = -33.427 kNm/m

Sagging moment:
MEd = 0.5 × (362.13/3.25) = 55.71 kNm/m

Structural Design – Flexure: column strip and middle, sagging

MEd = 55.71 kNm/m
d = h – Cc – ϕ/2

Assuming ϕ16mm bars will be employed for the construction
d = 230 – 30 – 8 = 192 mm; b = 1000mm (designing per unit width)

k = MEd/(fckbd2) = (55.71 × 10⁶)/(30 × 1000 × 1922) = 0.086

Since k < 0.167 No compression reinforcement required

z = d[0.5 + √(0.25 – 0.882k)]
z = d[0.5 + √(0.25 – 0.882 × 0.086)] = 0.917d = 0.917 × 192 = 176.12 mm

As1 = MEd/(0.87fykz) = (55.71 × 10⁶)/(0.87 × 500 × 176.12) = 727 mm2/m

Provide H16mm @ 200 mm c/c BOT (ASprov = 1005 mm2/m)

Check the minimum area of steel required;
fctm = 0.3 × fck2⁄3 = 0.3 × 302⁄3 = 2.89 N/mm(Table 3.1 EC2)

As,min = 0.26 × fctm/fyk × b × d = 0.26 × 2.89/500 × 1000 × 192 = 289 mm2/m
Check if As,min < 0.0013 × b × d (250 mm2/m)
Since, As,min = 250 mm2, the provided reinforcement is adequate.

Check for deflection
We check for deflection of flat slabs at the long span of the slab

Allowable L/d = N × K × F1 × F2 × F3 ≥ Actual L/d
K = 1.2 for flat slabs
ρ = As,req/bd = 727/(1000 × 192) = 0.003786 > 10-3√fck (0.00547)

Since ρ > ρ0
l/d = [11 + 1.5√fck0/(ρ – ρ’)) + 0.0833√fck0/ρ)0.5] if ρ > ρ0
ρ0/ρ= 0.00547/0.003786 = 1.44

N = [11 + 1.5√(30) × 1.444 + 0.0833√30 × (1.444)0.5] = 11 + 11.86 + 0.548 = 23.4

F1 = 1.0 (beff/bw = 1.0)
F2 = 1.0 (no brittle partitions)
F3 = 310/σs ≤ 1.5

where:

σsu = (500/1.15) × (8.15 + 0.3 × 3)/15.5 = 253.856 MPa
σs = σsu × (As,req/As,prov) = 253.856 × (727/1005) = 183.6 N/mm2
βs = 310/183.6 = 1.688 > 1.5 (take 1.5)

Therefore allowable L/d = 23.4 × 1.2 × 1.0 × 1.0 × 1.5 = 42.12

Actual L/d = 6430/192 = 33.49

Therefore, deflection is okay.

Flexure: column strip, hogging
MEd = 77.99 kNm/m

k = MEd/(fckbd2) = (77.99 × 10⁶)/(30 × 1000 × 1922) = 0.0705
Since k < 0.167 No compression reinforcement required

z = d[0.5 + √(0.25 – 0.882k)]
z = d[0.5 + √(0.25 – 0.882 × 0.0705)] = 0.933d = 0.933 × 192 = 179.2 mm

As1 = MEd/(0.87fykz) = (77.99 × 10⁶)/(0.87 × 500 × 179.2) = 1000 mm2/m

Provide T16mm @ 175 mm c/c Top (ASprov = 1149 mm2/m)

(c) Flexure: Middle strip, hogging
MEd = 33.43 kNm/m

k = MEd/(fckbd2) = (33.43 × 10⁶)/(30 × 1000 × 1922) = 0.030
Since k < 0.167 No compression reinforcement required

z = d[0.5 + √(0.25 – 0.882k)]
z = d[0.5 + √(0.25 – 0.882 × 0.030)] = 0.95d = 0.95 × 192 = 182.4 mm

As1 = MEd/(0.87fykz) = (33.43 × 10⁶)/(0.87 × 500 × 182.4) = 421 mm2/m
Provide T12mm @ 200 mm c/c Top (ASprov = 565 mm2/m)

Perpendicular to edge of slab at edge column
Design transfer moment to column Mt = 0.17 bed2fck
be = cz + y = 300 + 300 = 600 mm

Mt = 0.17 × 600 × 1922 × 30 × 10−6 = 112.8 kNm
k = MEd/(fckbd2) = (112.8 × 10⁶)/(30 × 600 × 1922) = 0.1699

z = d[0.5 + √(0.25 – 0.882k)]
z = d[0.5 + √(0.25 – 0.882 × 0.1699)] = 0.82d = 0.82 × 192 = 157.44 mm

As1 = MEd/(0.87fykz) = (112.8 × 10⁶)/(0.87 × 500 × 157.44) = 1647 mm2/m
This reinforcement to be placed within cx + 2cy = 900 mm

Try H16T1 U-bars in pairs @ 100 (Asprov = 2010 mm2) local to column (max. 200 mm from column)

Punching Shear Check

See worked example on punching shear verification of flat slabs.

Simplified Design of Welded Connections

Welded connections are one of the most fundamental and versatile methods for joining steel members in structural applications. Their inherent strength, reliability, and cost-effectiveness make them a popular choice across various industries, from building construction and bridges to shipbuilding and machinery.

However, ensuring the safety and efficiency of these connections requires careful design and adherence to established codes of practice. In this article, we review the design of welded connections, exploring their key design principles, common types, and considerations, with Eurocode 3 (EN 1993) serving as our primary reference for best practices.

Fundamental Principles of Welded Connections

At the heart of welded connection design lies the understanding of stress distribution and material behaviour. Welds introduce inherent discontinuities within the structure, potentially creating stress concentrations. Therefore, selecting the appropriate weld type, size, and location becomes crucial. Eurocode 3 provides detailed guidance on various weld types, such as butt welds, fillet welds, and groove welds, each with its own load-carrying capacity and suitability for specific scenarios.

Material Properties

Understanding the base metal and filler metal properties is equally important. Eurocode 3 classifies different steel grades based on their yield strength, ultimate tensile strength, and ductility. The chosen weld metal must be compatible with the base metal, ensuring adequate strength and avoiding excessive brittleness.

Load Analysis and Design Methods

Accurately determining the loads acting on the connection is paramount. Eurocode 3 outlines various load combinations including dead loads, imposed loads, wind loads, and seismic loads. Once the loads are defined, different design methods can be employed, such as the ultimate limit state (ULS) and the serviceability limit state (SLS). The ULS ensures sufficient strength to prevent weld failure, while the SLS addresses factors like excessive deformations and fatigue resistance.

Common Types of Welded Connections

  • Butt Welds: Join two members along their full cross-section, often used for plates and pipes.
  • Fillet Welds: Connect two members at an angle, suitable for various member combinations.
  • Groove Welds: Similar to butt welds, but with a prepared groove in one or both members for greater weld penetration.
  • Tee and Corner Joints: Connect members forming an L or T shape, requiring careful consideration of stress concentrations.

Eurocode 3 Requirements

Eurocode 3 provides comprehensive design rules and guidance for welded connections. Key aspects include:

  • Weld throat thickness: Defines the effective depth of the weld, crucial for calculating its load-carrying capacity.
  • Electrode selection: Specifies suitable electrodes based on material properties and desired weld characteristics.
  • Joint geometry: Provides recommendations for joint preparation, weld size, and edge distance to ensure proper stress distribution.
  • Fatigue design: Addresses welds subjected to cyclic loading, requiring specific design considerations.
  • Fabrication and quality control: Outlines requirements for welding procedures, welder qualifications, and inspection methods.

Additional Considerations

  • Residual stresses: Welding introduces residual stresses within the structure, which can affect the overall behavior and need to be accounted for in the design.
  • Distortion and shrinkage: The heating and cooling process during welding can cause distortion and shrinkage of the members, requiring measures to control these effects.
  • Fatigue resistance: Connections experiencing repeated loading require careful design for fatigue resistance, potentially involving specific weld details and material selection.

Welded Connection Design Example

In our previous post, we were able to present an example of the design of fillet welds for truss members using two different approaches. In this article, we are going to simplify it further by presenting an example of how the strength of fillet welds can be easily verified, according to the requirements of Eurocode 3.

Solved Example
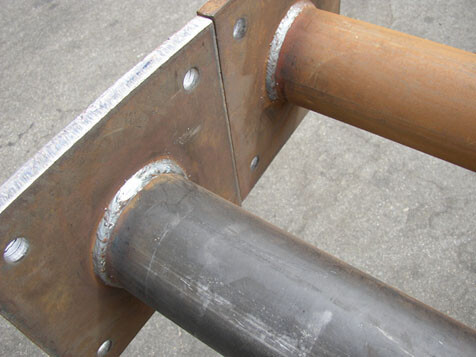
A 150 mm diameter hollow steel pipe is welded to a plate of thickness 25 mm of grade S275. If the welding side is 12 mm, determine the shear resistance of the welded connection (see the connection example with the picture below).

Typical welded connection construction

Solution
Steel grade = S275
Thickness of plate (t) = 25 mm < 40 mm, therefore fu = 430 Mpa (Table 3.1 BS EN 1993-1-1)

For steel grade S275, βw = 0.85 (Table 4.1, BS EN 1993-1-1)

The throat of the weld
a = (√2/2) × welding side
a = 0.7071t
a = 0.7071(12) = 8.485 mm

Design weld shear strength
fvwd = (fu/√3)/(βwγm2)
fvwd = (430/√3)/(0.85 × 1.25) = 233.65 Mpa

Weld resistance per length
Fw,Ed =   fvwda
Fw,Ed =  233.65 × 8.485 = 1982.58 N/mm = 1.982 kN/mm

Since the weld is done right round the perimeter of the pipe, the weld length L = πd = π × 150 = 471.24 mm

The total weld resistance = Fw,Ed × L = 1.982 × 471.24 = 934 kN

Therefore, the shear force at the base must not exceed 934 kN

Conclusion

Designing welded connections effectively requires a combination of engineering principles, material understanding, and adherence to established codes like Eurocode 3. This comprehensive guide serves as a starting point, highlighting key aspects and considerations. However, for real-world applications, seeking the expertise of qualified engineers and strictly adhering to relevant code provisions remain essential for ensuring safe and reliable structural performance.

Review on the Quantity of Cement Required to Lay 9 inches (230 mm) Blocks

In our previous post, we were able to establish that we need 0.03 m3 of mortar to lay one square metre of 9 inches hollow block wall. If you missed the post, or wish to know how we arrived at that value, follow the link below.


How to Calculate the Quantity of Mortar for Laying Blocks

The post has some set backs in the fact that it was not simplified to the most basic level. In this post, I wish to clearly establish a value that can be appreciated on site for all construction purposes.

The typical mix ratio for mortar on construction sites in Nigeria is 1:5 (1 bag of 50 kg cement to 10 head pans of sand).

Therefore, the quantity of cement required per cubic metres is given by;
1/6 x 1440 = 240 kg/m3
For wet mortar, use 1.30 x 240 = 312 kg/m3

NB: We are using a factor of 1.30 to account for shrinkage in volume when water is added to the dry mix.

Therefore, the quantity of cement required per m3 of mortar = 312/50 = 6.24 bags of cement


Quantity of mortar required per 1 m2 (10 blocks) of wall = 0.03 m3
For 5 m2 (50 blocks) of wall = 0.15 m3

Therefore, if 6.24 bags if required in 1 m3 of mortar, then 0.936 bags of cement is required in 0.15 m3 of mortar.

By inference, we can say that we need 1 bag of cement to lay 50 pieces of hollow 9 inches block (i.e 5 m2 of wall).

Design of Waffle Slabs

Waffle slabs are reinforced concrete slabs that are normally employed for large-span construction. They can be described as the equivalent of 2-way spanning solid slabs but with a ribbed slab system spanning in both directions. In waffle slabs, the grids run in two directions to provide support for the floor.

Waffle slabs have a flat top and a surface resembling a grid made of concrete joists on the bottom. After the concrete has set and cured, the waffle moulds are removed to create the grid. Due to the rigidity of the waffle slab, this form of structure is suggested for buildings like manufacturing plants and laboratories that require little vibration.

Additionally, waffle slabs are utilized in structures like theatres and train stations that call for expansive open areas. Waffle slabs may be more expensive than other types of slabs because they require intricate formwork, but depending on the project and the amount of concrete used, they may be less expensive to construct.

waffle slab design

The design concept of waffle slabs is similar to that of ribbed slabs, with the difference being that waffle slabs have ribs spanning in both directions, and the coefficients used for analysing the slab are similar to those used for a two-way restrained slab. Waffle slabs are supported on beams or columns, where the support zones are made to be uniformly thick.

Design Example of Waffle Slab

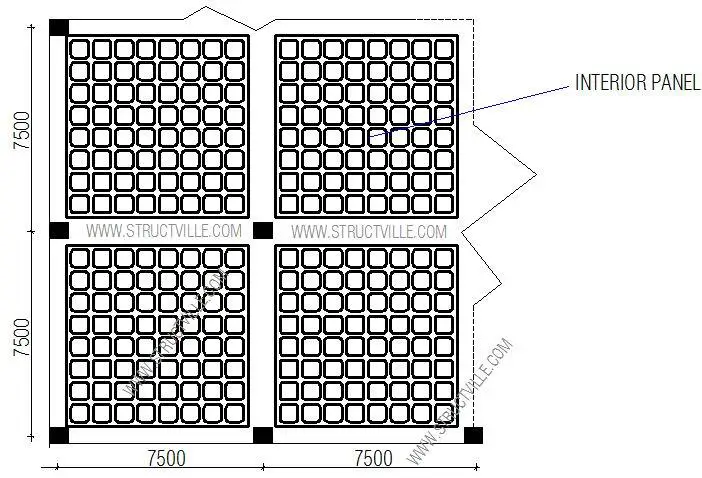
A church building has a square grid of 7.5m x 7.5m of waffle slab, and is to support an imposed load of 5 kN/m2, design an interior panel of the waffle slab, and a supporting beam. fck = 30 Mpa, fyk = 500 Mpa. The design will be done according to Eurocode 2 (EN 1992-1-1:2004).

GENERAL 2BARRANGEMENT 2BOF 2BWAFFLE 2BSLAB

For details of waffle mould, see details of technical data sheet.

Solution
From basic span/effective depth ratio of 26, the trial depth of slab to be adopted = 7500/26 = 288 mm

From the table, let us select the following mould details;
Mould height = 225 mm
Top layer thickness = 75 mm
Total height of slab = 300 mm
Average rib width = 176 mm

Load Analysis
Self weight of concrete = 5.2 kN/m2 (see technical data sheet)
Finishes = 1.2 kN/m2
Partition allowance = 1.5 kN/m2
Total permanent action = 7.9 kN/m2

Imposed load = 5 kN/m2

At ultimate limit state = 1.35gk + 1.5qk = 1.35(7.9) + 1.5(5) = 18.165 kN/m2

Load per rib = 0.9 × 18.165 = 16.35 kN/m2

Analysis of the slab
Treating as all sides fixed:
k = Ly/Lx = 1.0
Span coefficient = +0.024
Support coefficients = -0.032

Design of the span
Designing the span as a T-beam;
MEd =  0.024 × 16.35 × 7.5= 22.07 kN.m

Effective depth (d) = h – Cnom – ϕ/2 – ϕlinks
Assuming ϕ12 mm bars will be employed for the main bars, and ϕ10 mm bars for the stirrups (links)
d = 300 – 25 – (12/2) -10 = 259 mm

k = MEd/(fckbd2) = (22.07 × 10⁶)/(30 × 500 × 2592) = 0.0219
Since k < 0.167, no compression reinforcement required

z = d[0.5+ √(0.25 – 0.882k)]
k’ = 0.0219
z = d[0.5+ √((0.25 – 0.882(0.0219))] = 0.95d = 246.05 mm

Depth to neutral axis x = 2.5(d – z) = 2.5(259 – 246.05) = 32.375 mm < 1.25hf (93.75 mm)
Therefore, we design rib as a rectangular section

Area of tension reinforcement As1 = MEd / (0.87fyk z)
As1 = MEd / (0.87fyk z) = (22.07 × 10⁶) / (0.87 × 500 × 0.95 × 259) = 206 mm2

Provide 2H12  Bot (ASprov = 226 mm2)

Check for deflection
ρ = As,req /bd = 206 / (900 × 259) = 0.0008837
ρ0 = reference reinforcement ratio = 10-3√(fck) = 10-3√(30) = 0.00547
Since  ρ ≤ ρ0;
L/d = k [11 + 1.5√(fck) ρ0/ρ + 3.2√(fck) (ρ0/ρ – 1)(3⁄2)]
k = 1.5 (continuous system)
L/d = 1.5 [11 + 1.5√(30) × (0.00547/0.0008837) + 3.2√(30) × [(0.00547 / 0.0008837) – 1](3⁄2)]
L/d = 1.5[11 + 50.855 + 207.227] = 269.082

βs = (500 Asprov)/(fyk Asreq) = (500 × 226) / (500 × 206) = 1.09

beff/bw = 900/176 = 5.11

Therefore multiply basic length/effective depth ratio by 0.8

Therefore limiting L/d = 1.09 × 0.8  × 269.082 = 234.639
Actual L/d = 7500/259 = 28.96

Since Actual L/d (28.96) < Limiting L/d (234.639), deflection is satisfactory.

Design of Supports;
MEd = 0.032 × 16.35 × 7.5= 29.43 kN.m

k = MEd/(fckbd2) = (29.43 × 10⁶)/(30 × 176 × 2592) = 0.083
Since k < 0.167, no compression reinforcement required

z = d[0.5+ √(0.25 – 0.882k)]
k = 0.083
z = d[0.5+ √((0.25 – 0.882(0.083))] = 0.92d

Area of tension reinforcement As1 = MEd / (0.87fyk z)
As1 = MEd / (0.87fyk z) = (29.43 × 10⁶) / (0.87 × 500 × 0.92 × 259) = 283 mm2
Provide 3H12 TOP (ASprov = 339 mm2)

Shear Design 

Maximum shear force in the rib 
VEd = 0.33 × 16.35 × 7.5 = 40.466 kN/m

VRd,c = [CRd,c.k.(100ρ1 fck)(1/3) + k1cp]bw.d ≥ (Vmin + k1cp) bw.d

CRd,c = 0.18/γc = 0.18/1.5 = 0.12
k = 1 + √(200/d) = 1 + √(200/259) = 1.88 < 2.0, therefore, k = 1.88
Vmin = 0.035k(3/2) fck0.5
Vmin = 0.035 × (1.88)1.5 × 300.5 = 0.494 N/mm2
ρ1 = As/bd = 339/(176 × 259) = 0.00743 < 0.02; Therefore take 0.00743

VRd,c = [0.12 × 1.88 (100 × 0.00743 × 30 )(1/3)] × 176 × 259 = 28941.534 N = 228.94 kN

Since VRd,c (28.94 kN) < VEd (40.466 kN), shear reinforcement is required.
The compression capacity of the compression strut (VRd,max) assuming θ = 21.8° (cot θ = 2.5)

VRd,max = (bw.z.v1.fcd) / (cot⁡θ + tanθ)
V1 = 0.6(1 – fck/250) = 0.6(1 – 30/250) = 0.528
fcd = (αcc fck) / γc = (0.85 × 30) / 1.5 = 17 N/mm2
Let z = 0.9d

VRd,max = [(176 × 0.9 × 259 × 0.528 × 17) / (2.5 + 0.4)] × 10-3 = 126.981 kN

Since < VEd < VRd,c < VRd,max

Hence Asw / S = VEd / (0.87 Fyk z cot θ) = 40466 / (0.87 × 500 × 0.9 × 259 × 2.5 ) = 0.159

Minimum shear reinforcement;
Asw / S = ρw,min × bw × sinα (α = 90° for vertical links)
ρw,min = (0.08 × √(fck)) / fyk = (0.08 × √30) / 500 = 0.000876
Asw/Smin = 0.000876 × 176 × 1 = 0.154
Maximum spacing of shear links = 0.75d = 0.75 × 259 = 194.25 mm

Provide H8mm @ 175 mm c/c as shear links (Asw / S = 0.574)

Slab Topping
A142 BRC Mesh can be provided or H8 @ 250mm c/c

Watch out for design of supporting beams…


8 Top Civil Engineering Questions (Part 2)

(1) For the structure shown in the figure below, which of the following is the most likely bending moment diagram considering linear first order elastic analysis?

FB IMG 1556340232949

(A)
(B)
(C)


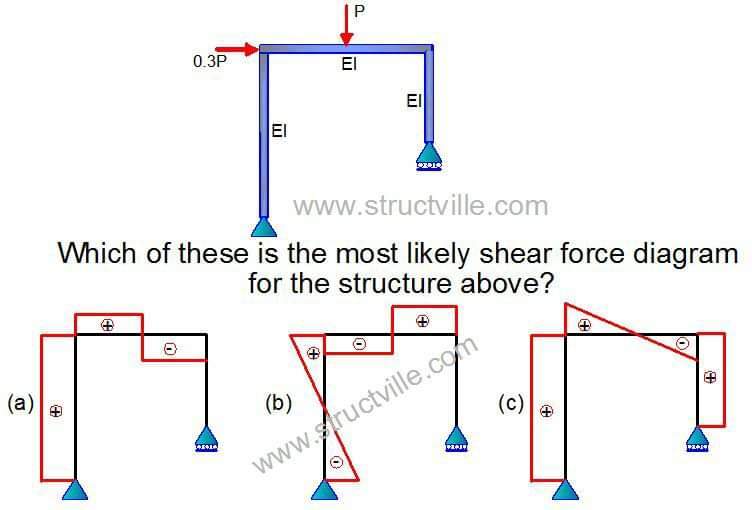
(2) For the structure shown in the figure below, what is the most likely shear force diagram?

FB IMG 1556340286893

(A)
(B)
(C)

(3) A building is generally divided into how many parts?

(A) Four
(B) Three
(C) Two
(D) Six


(4) What is the recommended maximum spacing of shear links in a beam according to British and European codes?

(A) d
(B) 1.5d
(C) 0.75d
(D) Width of beam

(5) What is the recommended minimum compressive strength for water retaining structures according to the Eurocodes?

(A) C20/25
(B) C25/30
(C) C30/37
(D) C35/45

(6) The process through which water reacts with free cement after hydration reaction in a concrete structure to seal up cracks is known as?

(A) Post-hydration reaction
(B) Consolidation healing
(C) Efflorescence
(D) Autogenous healing

(7) How many percentage of 28 days strength is expected of concrete after 7 days?

(A) 50%
(B) 65%
(C) 30%
(D) 75%

(8) A beam of span L is subjected to a uniformly distributed load w with support conditions pinned and fixed at either ends. What is the bending moment at the fixed end?

(A) wL2/8
(B) wL2/12
(C) wL2/16
(C) wL2/24


Use of Polystyrene in Ribbed Slabs: Structural Design Example

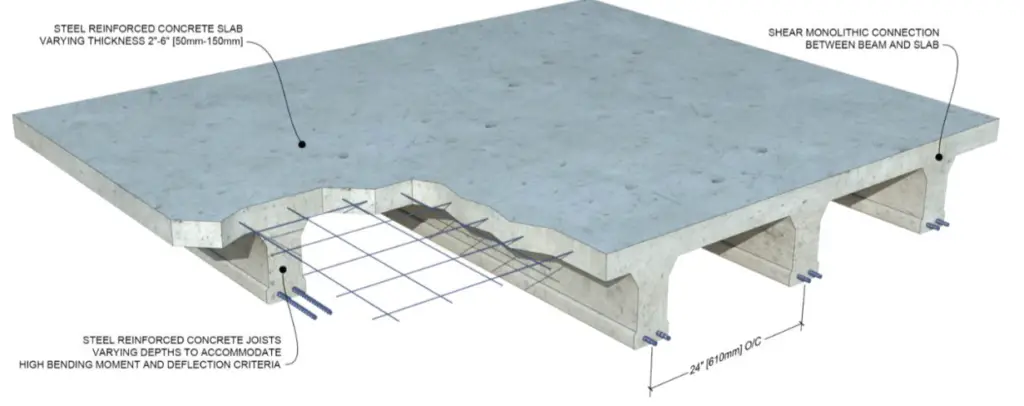
For long-span slabs in a building subjected to a low live load, ribbed slabs are more economical than reinforced concrete solid slabs. In ribbed slab construction, a reduction in the volume of concrete is achieved by removing some of the concrete below the neutral axis of the section, under the assumption that the tensile strength of concrete is negligible.

In effect, closely spaced reinforced concrete beams (more like joists) spanning in one direction are used to support thinner slab topping in ribbed slabs. The closely spaced beams are the major load-bearing elements of the floor and resist major bending and shear forces. The space between the rib beams may or may not be filled.

image 26
Figure 1: Ribbed slab

Therefore, the two major forms of construction of ribbed slabs are;

(1) Ribbed slab without permanent blocks
(2) Ribbed slab with permanent blocks

The major advantage of a ribbed slab with permanent blocks is the reduction in the quantity of formwork required, given the fact that the strength of the blocks is not usually assumed to contribute to the strength of the slab in design.

In Nigeria, clay hollow pots and sandcrete blocks have been successfully used, but on the rise is the use of polystyrene. Polystyrene offers the advantage of lightweight, improved fire resistance, and economy, at the expense of less rigidity compared to clay hollow pots or blocks.

image 27
Figure 2: Expanded Polystyrene (EPS)

In a generic sense, the use of polystyrene is to encourage savings in formwork costs, and may not be assumed to contribute to the strength of the floor in any way.

polystyrene in floor construction
Figure 3: Polystyrene in floor construction

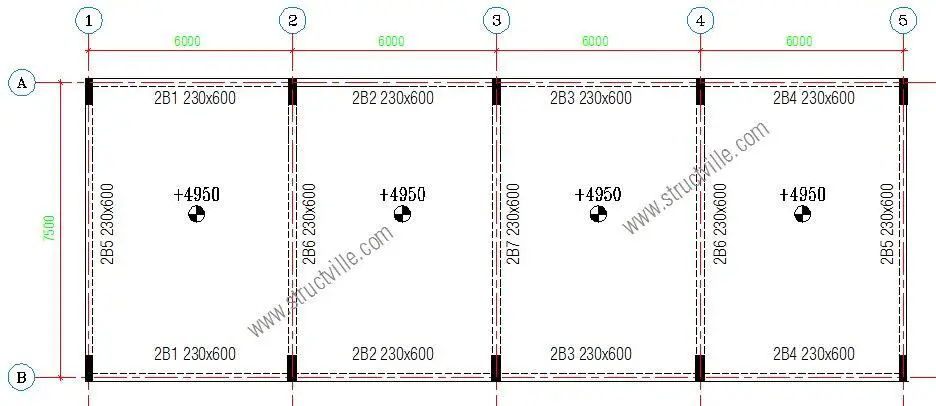
In this article, we are going to consider the design of a floor (see Figure 4) subjected to the following loading conditions;

Structural 2Bscheme 2Bfor 2Bribbed 2Bslab
Figure 4: Preliminary Structural Arrangement

Finishes – 1.2 kN/m2
Partition allowance – 1.5 kN/m2
Imposed load – 2.5 kN/m2

fck = 30 Mpa, fyk = 500 Mpa, Concrete cover = 25 mm

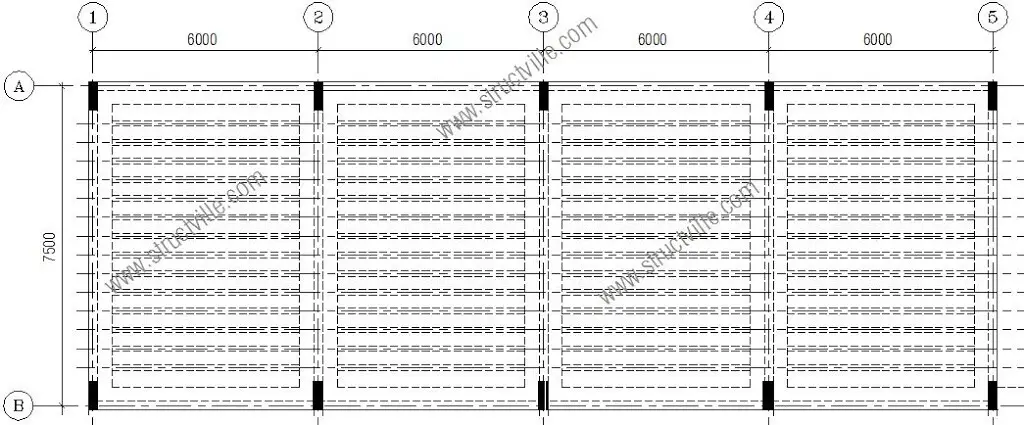
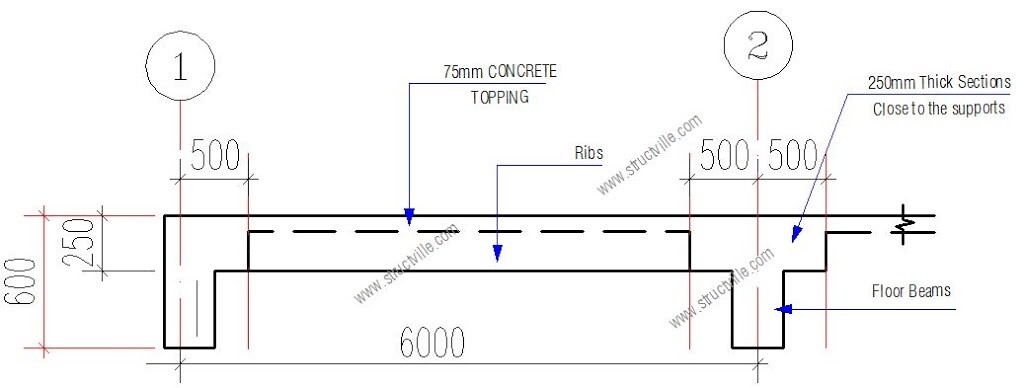
The structural engineer decided the scheme the structural layout as shown in Figure 5. The slab is made solid close to the supports, to enable adequate transmission of shear forces.

general 2Barrangement 2Bof 2Bribbed 2Bslab 1
Figure 5: Layout of the rib beams

From a basic span/effective depth ratio of 26, let us choose a trial depth;
6000/26 = 231 mm

Let us try a total depth of 250 mm

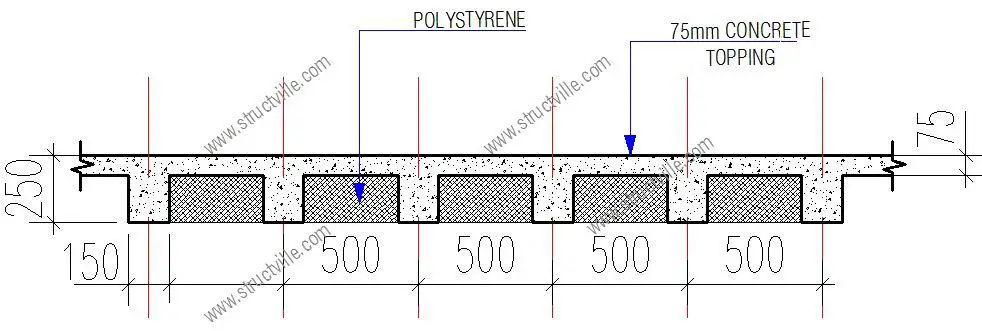
SECTION 2BTHROUGH 2BRIBBED 2BSLAB 1
Figure 6: Transverse Section through the Slab
RIBBED 2BSLAB
Figure 7: Longitudinal Section through the slab

Load Analysis

For 500mm c/c rib spacing;

Permanent Actions
Weight of topping: 0.075 × 25 × 0.5 = 0.9375 kN/m
Weight of ribs: 0.15 × 0.175 × 25 = 0.656 kN/m
Weight of finishes: 1.2 × 0.5 = 0.6 kN/m
Partition allowance: 1.5 × 0.5 = 0.75 kN/m
Weight of heavy-duty EPS (16 kg/m3) = 0.156 × 0.175 × 0.5 = 0.01365 kN/m
Total dead load gk = 2.95 kN/m

Variables Action(s)
Occupancy load qk: 2.5 × 0.5 = 1.25 kN/m

At ultimate limit state; 1.35gk + 1.5qk = 1.35(2.95) + 1.5(1.25) = 5.8575 kN/m

Structural Analysis
The design load per span at the ultimate limit state (FEd) is given by = 5.8575 kN/m × 6m = 35.145 kN/m

From clause 3.5.2.3 of BS 8110-1:1997, we can use the simplified method for structural analysis.

At the middle of span 1-2; M = 0.075 × 35.145 × 6 = 15.815 kNm
At support 2, MEd = -0.086 × 35.145 × 6 = 18.134 kNm

Designing the span as a T-beam;
MEd = 15.815 kN.m

Effective depth (d) = h – Cnom – ϕ/2 – ϕlinks
Assuming ϕ12 mm bars will be employed for the main bars, and ϕ10 mm bars for the stirrups (links)
d = 250 – 25 – (12/2) -10 = 209 mm

k = MEd/(fckbd2) = (15.815 × 10⁶)/(30 × 500 × 2092) = 0.024
Since k < 0.167, no compression reinforcement required

z = d[0.5+ √(0.25 – 0.882k)]
k’ = 0.024
z = d[0.5+ √((0.25 – 0.882(0.024))] = 0.95d = 198.55 mm

Depth to neutral axis x = 2.5(d – z) = 2.5(209 – 198.55) = 26.125 mm < 1.25hf (93.75mm)
Therefore, we design rib as a rectangular section

Area of tension reinforcement As1 = MEd / (0.87fyk z)
As1 = MEd / (0.87fyk z) = (15.815 × 10⁶) / (0.87 × 500 × 0.95 × 209) = 183 mm2

Provide 2H12  Bot (ASprov = 226 mm2)

Check for deflection
ρ = As,req /bd = 183 / (500 × 209) = 0.00175
ρ0 = reference reinforcement ratio = 10-3√(fck) = 10-3√(30) = 0.00547
Since  ρ ≤ ρ0;
L/d = k [11 + 1.5√(fck) ρ0/ρ + 3.2√(fck) (ρ0 / ρ – 1)(3⁄2)]
k = 1.3
L/d = 1.3 [11 + 1.5√(30) × (0.00547/0.00175) + 3.2√(30) × [(0.00547 / 0.00175) – 1](3⁄2)]
L/d = 1.3[11 + 25.68 + 54.321] = 118.3

βs = (500 Asprov)/(fyk Asreq) = (500 × 226) / (500 × 183) = 1.23

beff/bw = 500/150 = 3.33

Therefore multiply basic length/effective depth ratio by 0.8

Therefore limiting L/d = 1.23 × 0.8  × 118.3 = 116.41
Actual L/d = 6000/209 = 28.708

Since Actual L/d (28.708) < Limiting L/d (116.41), deflection is satisfactory.

Design of Support 2;
MEd = 18.134 kN.m

Effective depth (d) = h – Cnom – ϕ/2 – ϕlinks
Assuming ϕ12 mm bars will be employed for the main bars, and ϕ10 mm bars for the stirrups (links)
d = 250 – 25 – (12/2) -10 = 209 mm

k = MEd/(fckbd2) = (18.134 × 10⁶)/(30 × 150 × 2092) = 0.0922
Since k < 0.167, no compression reinforcement required

z = d[0.5+ √(0.25 – 0.882k)]
k = 0.092
z = d[0.5+ √((0.25 – 0.882(0.092))] = 0.91d

Area of tension reinforcement As1 = MEd / (0.87fyk z)
As1 = MEd / (0.87fyk z) = (18.134 × 10⁶) / (0.87 × 500 × 0.91 × 209) = 219 mm2
Provide 2H12  Top (ASprov = 226 mm2)

Shear Design 
Maximum shear force in the rib VEd = 0.6F = 0.6 × 35.145 = 21.087 kN

VRd,c = [CRd,c.k.(100ρ1 fck)(1/3) + k1cp]bw.d ≥ (Vmin + k1cp) bw.d

CRd,c = 0.18/γc = 0.18/1.5 = 0.12
k = 1 + √(200/d) = 1 + √(200/209) = 1.97 < 2.0, therefore, k = 1.97
Vmin = 0.035k(3/2) fck0.5
Vmin = 0.035 × (1.97)1.5 × 300.5 = 0.53 N/mm2
ρ1 = As/bd = 226/(150 × 209) = 0.0072 < 0.02; Therefore take 0.0072

VRd,c = [0.12 × 1.97 (100 × 0.0072 × 30 )(1/3)] × 150 × 209 = 20639.67 N = 20.639 kN

Since VRd,c (20.639 kN) < VEd (21.087 kN), shear reinforcement is required.
The compression capacity of the compression strut (VRd,max) assuming θ = 21.8° (cot θ = 2.5)

VRd,max = (bw.z.v1.fcd) / (cot⁡θ + tanθ)
V1 = 0.6(1 – fck/250) = 0.6(1 – 30/250) = 0.528
fcd = (αcc fck) / γc = (0.85 × 30) / 1.5 = 17 N/mm2
Let z = 0.9d

VRd,max = [(150 × 0.9 × 209 × 0.528 × 17) / (2.5 + 0.4)] × 10-3 = 87.333 kN

Since < VEd < VRd,c < VRd,max

Hence Asw / S = VEd / (0.87 Fyk z cot θ) = 21087 / (0.87 × 500 × 0.9 × 209 × 2.5 ) = 0.103

Minimum shear reinforcement;
Asw / S = ρw,min × bw × sinα (α = 90° for vertical links)
ρw,min = (0.08 × √(fck)) / fyk = (0.08 × √30) / 500 = 0.000876
Asw/Smin = 0.000876 × 150 × 1 = 0.131
Maximum spacing of shear links = 0.75d = 0.75 × 209 = 156.75 mm

Provide H8mm @ 150 mm c/c as shear links.

Slab Topping
A142 BRC Mesh can be provided or H8 @ 250mm c/c

For more information on design and consultancy to accomplish the most challenging design brief, contact the author on info@structville.com. Thank you, and God bless you.

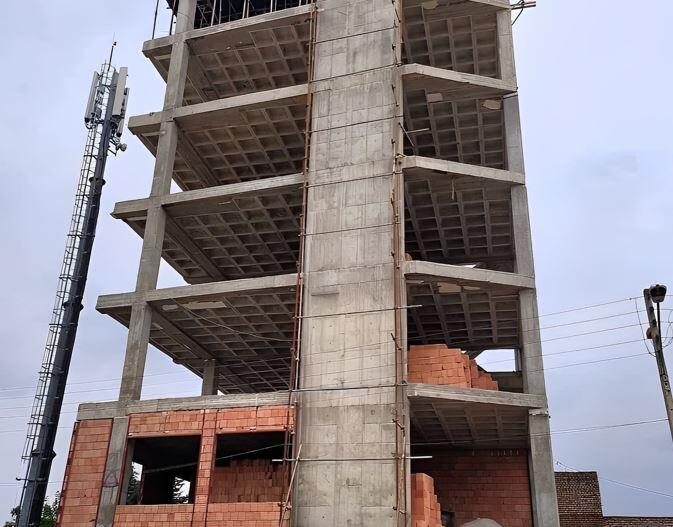
Advise on the Stability of this Structure

Screenshot 20190421 181440 1 1 1

As a structural engineer, advise the client/architect on the stability of the structure, distinguishing between transient and permanent situation.

Height – 11.28 m
Length – 20.00 m


Screenshot 20190421 182059 1 1

Screenshot 20190421 182125 1

Note: This is an existing observatory structure in Tielt-Winge Belgium. Report has it that it was recently vandalised and is looking to be rebuilt…