8.7 C
New York
Thursday, April 3, 2025
Home Blog Page 59

Use of Rice Husk Ash in Concrete: Literature Review

1.0 Introduction
A pozzolan is a siliceous or aluminosiliceous material that, in finely divided form and in the presence of moisture, chemically reacts with the calcium hydroxide released by the hydration of portland cement to form calcium silicate hydrate and other cementitious compounds. Pozzolans are generally categorized as supplementary cementitious materials or mineral admixtures (Kosmatka et al, 2003). On their own, pozzolans possess little or no cementitious value, but when ground in fine form and in the presence of water will react with calcium hydroxide and develop cementitious properties.


Rice husk ash (RHA) has been used as a highly reactive pozzolanic material to improve the microstructure of the interfacial transition zone (ITZ) between the cement paste and the aggregate in high-performance concrete (Biu et al, 2005). Rice husk ash has also been reported to improve the properties of concrete or cement paste due to the pozzolanic reaction and its role as a micro-filler. It is often thought that the first function (pozzolanic reaction) is most important. The partial replacement of cement by rice husk ash in cement paste and mortar would provide micro-structure improvement, pore filling effect and better packing characteristics of the mixer (Kondraivendhan, 2012).
rice husks
One of the major highlights in the use RHA as cementitious material is based on environmental considerations. Rice milling industry generates a lot of rice husk during milling of paddy which comes from the fields. Rice husk ash (RHA) is about 25% by weight of rice husk when burnt in boilers.  It is estimated that about 70 million tones of RHA is produced annually worldwide. This RHA is a great environment threat causing damage to the land and the surrounding area in which it is dumped (http://www.ricehuskash.com/product.htm).
Studies have shown that RHA resulting from the burning of rice husks at control temperatures have physical and chemical properties that meet ASTM (American Society for Testing and Materials) Standard C 618-94a. At burning temperatures of 550 °C – 800 °C, amorphous silica is formed, but at higher temperatures crystalline silica is produced (Reddy and Alvarez, 2006). Amorphous silica is best for the production of concrete.  Rice husk contains about 75 % organic volatile matter and the balance 25% of the weight of this husk is converted into ash during the firing process, and is known as rice husk ash (RHA). This RHA in turn contains around 85% – 90% amorphous silica. So for every 1000 kgs of paddy milled , about 220 kgs (22 %) of husk is produced, and when this husk is burnt in the boilers, about 55 kgs (25 %) of RHA is generated (http://www.ricehuskash.com/product.htm).


2.0 Chemical Properties of RHA
According to Chandrasekhar et al (2003), the chemical composition of rice husk is found to vary from one sample to another due to the differences in the type of paddy, crop year, climate and geographical conditions. Here are samples of variation in chemical properties of RHA from various research works;
According to Habeeb and Mamoud (2010) (Malaysia);
tyue
According to Ganiron (2013) (Saudi – Arabia);
tyue2
According to Egbe-Ngu Ntui Ogork et al (2015) (Nigeria);
nty


According to Oyewumi et al (2014) (Nigeria):
NTYY
According to research done by Naveen et al (2015) (India):
rew
 Thus with all these results, you can verify that the chemical properties of RHA varies, so it is very important that before any RHA sample is used, chemical analysis should be carried out.
 
3.0 Effect of RHA on Compressive Strength of Concrete
In this section, we are going to present some research works that have been carried out by various scholars on RHA.
 
Emmanuel and Akaangee (2015) [Nigeria] collected 4.7kg of RH and weighed it using Sartorius-2 weighing scale. 1.085kg of rice hush ash was obtained after an open burning of the rice husk in a local furnace for two hours at a temperature range of 600°C to 700°C. The finely divided ash was left to cool for 24 hours inside the furnace. It was then grounded forfour minutes to obtain a finer particle size with the aid of a disc-mill, sieved manually using a 45 micro meter sieve to ensure proper fineness of the ash. From their result, the compressive strength of the concrete were as follows;
tyd
From their result,  compressive strength of cubes increases with age of curing and decreases as the percentage of rice husk ash content increases. The major setback in their research work was that 40mm x 40mm x 160mm moulds were used to prepare the concrete samples, and the target design strength was not specified, including the mix ratio adopted. But the major highlight of the research work was that maximum compressive strength was obtained at 15% replacement of OPC with RHA.


Dahiya et al (2015) [India] carried out partial replacement of grade 42.5 Portland cement with 20% RHA. In their result, they discovered that the initial setting time increased from 30 minutes to 60 minutes. The concrete samples were cast using 150mm x 150mm x 150mm mould, and the target strength was M20. The Compressive Strength of M20 (0% RHA) concrete at 3, 7 and 28 days are 14.50, 20.50 and 30.3 respectively. Whereas on replacing cement with 20% of RHA it comes out to be 13.40, 21.60 and 30.70 respectively. In the highlight of his research, water demand increased from 0.6 to 0.8 to achieve a slump 75mm – 100mm, but strength gain was almost the same at 20% replacement.
Naveen et al (2015) (India) carried out a research on the effect of RHA on compressive strength of concrete. He worked on target strengths of M30 and M60. The summary of his mix design for M30 concrete is given below;
gtyo
Grade 53 ordinary portland cement was used for this research, and water to cement ratio of 0.43 to 0.35 was used. The mould size employed was 150mm x 150mm x 150mm, and 60 specimens of this was prepared. The result of the compressive strength is given below;
rq
From his research, the maximum compressive strength was obtained at 10% replacement. The result was also the same considering M60 grade of concrete.
Oyewumi et al (2014) [Nigeria] investigated the effect of RHA in concrete, and the proportioning of the materials is as shown below;
grt
The result of the test is as given below;
t666
From the result, it can be seen that none of the partial replacement met or the control target strength of 27.47 Mpa.  The closest for 28 day strength however came at 10% partial replacement. This is in contrast with two previous results.


Bolla et al (2015) [India] carried out a research on the effect of  partial replacement of cement with RHA on concrete. The cement has been replaced by rice husk ash accordingly in the range of 0%, 5%, 10%, 15%, and 20% by weight of cement for mix. Concrete mixtures were produced, tested and compared in terms of compressive strengths with the conventional concrete. These tests were carried out to evaluate the mechanical properties for the test results of 7, 28, 60 days for compressive strengths. The cement used for this test was grade 53, and cube sizes of 150mm x 150mm x 150mm were used.
Results of the test are given below;
edd
From this result, the maximum compressive strength was attained at 10% replacement. The author reported that the RHA has a minimum silicon dioxide of 90%.
Tsado et al (2014) [Nigeria] carried out the comparative analysis of properties of some artificial pozzolana in concrete production, which included rice husk ash, corn cub ash, and sheanut shell ash. However, we will focus on the result from RHA. A little consideration from his research showed that the silicon dioxide content of the RHA was too low at 48.44% (Bida, Niger state Nigeria). The chemical analysis result of the samples is given below;
drrr
The sample was prepared as 1:2:4 mix ratio, with a water to cement ratio of 0.6. 60 number of 150mm cubes were prepared, and the result of the test is given below;
tryy
From the result, none of the partial replacement met the 28 days strength of the control mix design. The closest with considerable value came at 10% partial replacement.


Zareei et al (2017) [Iran] evaluated the durability and mechanical properties of rice husk ash as a partial replacement of cement in high strength concrete containing micro silica. The research presented resulted from various ratios of rice husk ash (RHA) on concrete indicators through 5 mixture plans with proportions of 5, 10, 15, 20 and 25% RHA by weight of cement in addition to 10% micro-silica (MS). This was compared with a reference mixture with 100% Portland cement. Tests results indicated the positive relationship between 15% replacement of RHA with increase in compressive strengths by about 20%. The optimum level of strength and durability properties generally gain with addition up to 20%, beyond that is associated with slight decrease in strength parameters by about 4.5%.
The chemical properties of the RHA used for the research is given below;
456
In the batching, 8 cubes of 100mm x 100mm x 100mm samples were prepared, and a water to cement ratio of 0.4 was maintained throughout the test. The mix design of the test is given below;
rt5
The compressive strength of the entire batch is given below;
rrr
From the result, you can see that the maximum compressive strength was obtained at 20% replacement. Note that this research is aimed at high strength concrete, and Micro-Silica (MS) has been added.
Abalaka and Okoli (2013) [Nigeria] carried out test on strength development and durability of concrete containing pre-soaked rice husk ash. The aim of the research was to determine the optimum ordinary Portland cement (OPC) replacement with RHA resulting from the reactivity of pre-soaked RHA and the effects of presoaked RHA on durability properties (coefficient of water absorption and sorptivity) of concrete at the age of 90 days.
The mix proportion of the experiment is as given below;
The characteristic chemical composition of the RHA is given below;
dff
100mm x 100mm x 100mm steel moulds were used for the experiment, and the resulting compressive strength of the mixture is as given below;
frtt
From the above test, the maximum compressive strength was achieved at 15% replacement. Note that FOSROC’s Conplast P505 (plasticizer conforrming to BS EN 934) was used to improve workability.


Ujene and Achuenu (2013) [Nigeria] carried out research to determine the compressive strength of concrete prepared with various agricultural wastes across Nigeria. To ensure uniformity of the data, the research is restricted to percentage replacement of 10%, 20% and 30% of cement with local binders using design strengths of 25 Mpa and 30 Mpa at 7, 14 and 28 days curing.
The designation of the alternative binders used in the research is given below;
de
The results of the findings are as follows;
drt
drrr
From the result, we can see that for grade 25, partial replacement of 10% exceeded the target design strength. This was also the same situation for grade 30 concrete.
Summary of research works
(1) Optimum replacement of cement with RHA occurs between 10 – 20% replacement.
(2) Performance in terms of increased compressive strength increases when plasticizers are used.
(3) Water requirement increases as the percentage of RHA increases. From the literature reviewed in this post, best performance was observed at water to cement ratio less than 0.4
(4) Plasticizer is therefore recommended when using RHA for concrete production.
References
[1] Bolla R.K.,  Ratnam M.K.M.V.,  Raju U. R. (2015): Experimental Studies on Concrete with Rice Husk Ash as a Partial Replacement of Cement Using Magnesium Sulphate Solution. IJIRST –International Journal for Innovative Research in Science & Technology| Volume 1 | Issue 7 | December 2015 ISSN (online): 2349-6010
 
[2] Bui DD, Hu J, and Stroeven P, (2005): Particle size effect on the strength of rice husk ash blended gap-graded Portland cement concrete. Cement and Concrete Composites, 27( 2005) pp357-66.
 
[3]Dahiya A., Himanshu,  Kumar N.,  Yadav D. (2015): Effects of Rice Husk Ash on Properties of Cement Concrete. International Journal of Advanced Technology in Engineering and Science Vol. No. 3, Issue No 12 ISSN 2348-7550 pp 59 – 63
[4] Egbe-Ngu Ntui Ogork, Okorie A.U., Augustine U.E. (2015): Hydrochloric Acid Aggression in Groundnut Shell Ash (GSA)-Rice Husk Ash (RHA) Modified Concrete. Scholars Journal of Engineering and Technology (SJET) ISSN 2321-435X (Online) Sch. J. Eng. Tech., 2015; 3(2A):129-133
 
[5] Emmanuel A., Akaangee N.C. (2015): Evaluation of the properties of Rice Hush Ash as a Partial Replacement for Ordinary Portland cement. International Journal of Scientific Research Engineering & Technology (IJSRET), ISSN 2278 – 0882 Volume 4, Issue 7, July 2015
 
[6] Ganiron Jr T.U. (2013): Effects of Rice Hush as Substitute for Fine Aggregate in Concrete Mixture. International Journal of Advanced Science and Technology Vol.58, (2013), pp.29-40 http://dx.doi.org/10.14257/ijast.2013.58.03
 
[7] Habeeb G.A.,  Mahmud H.B. (2010): Study on properties of rice husk ash and its use as cement replacement material. Materials Research Print version ISSN 1516-1439 Mat. Res. vol.13 no.2 São Carlos Apr./June 2010 http://dx.doi.org/10.1590/S1516-14392010000200011
 
[8] Kondraivendhan B. (2012): Strength and Flow Behaviour of Rice Husk Ash
Blended Cement Paste and Mortar. Asian Journal of Civil Engineering (BHRC) VOL. 14, NO. 3 (2013) pp 405-416
 
[9] Kosmatka, Steven H.; Kerkhoff, Beatrix; and Panarese, William C. (2003): Design and Control of Concrete Mixtures. EB001, 14th edition, Portland Cement Association, Skokie, Illinois, USA 
 
[10] Naveen S.B., Antil Y. (2015): Effect of Rice Husk on Compressive Strength of Concrete. International Journal on Emerging Technologies 6(1): 144-150(2015) ISSN No. (Print) : 0975-8364 ISSN No. (Online) : 2249-3255
[11] Oyewumi O.D., Abdulkadir T.S., and Ajibola V.M. (2014): Investigation of rice husk ash cementitious constituent in concrete. Journal of Agricultural Technology 2014 Vol. 10(3): 533-542 Available online http://www.ijat-aatsea.com ISSN 1686-9141
 
[12] Reddy D.V., Alvarez, M.B.S. (2006): Marine Durability Characteristics of Rice Husk Ash-Modified Reinforced Concrete. Fourth LACCEI International Latin American and Caribbean Conference for Engineering and Technology (LACCET’2006) “Breaking Frontiers and Barriers in Engineering: Education, Research and Practice” 21-23 June 2006, Mayagüez, Puerto Rico.
 
[13] Tsado T.Y., Yewa M., Yaman S., Yewa F. (2014): Comparative Analysis of Properties of Some Artificial Pozzolana in Concrete Production. International Journal of Engineering and Technology Volume 4 No. 5, May, 2014 ISSN: 2049-3444 pp 251 – 255
[14] Ujene A. O. and Achuenu E. (2013): Comparative Assessment of Compressive Strength of Concrete Containing Agricultural and Environmental Cementitious Wastes in Nigeria. Nigerian Journal of Agriculture, Food and Environment. Vol. 9No (4): pp 37-42
[15] Zareeia S.A., Amerib F., Dorostkarc F., Ahmadic M. (2017): Rice husk ash as a partial replacement of cement in high strength concrete containing micro silica: Evaluating durability and mechanical properties. Case Studies in Construction Materials 7 (2017) 73–81 ISSN 2214-5095 Published by Elsevier Ltd. http://dx.doi.org/10.1016/j.cscm.2017.05.001


Do Commercial Software Make Engineers Better?

In the 1950s, a method of analysis involving discretization of a continuous domain into a set of discrete sub-domains called elements was developed in the field of engineering. This method called the Finite Element Analysis (FEA) is a numerical solution to problems in engineering and mathematics and has been applied extensively in structural engineering.

In the year 1965, NASA issued a request for the development of a structural analysis software tool.  The result of this was NASTRAN (NASA Structural Analysis), which implemented the available FEA technology to solve structural problems.

In the 1970s, the commercialisation of finite element analysis began in full force and gave birth to finite element modelling. Apart from FEA, design packages also sprang up within that period. For instance, DECIDE (DEsk-top Computers in DEsign) package was written by A.W. Beeby and H.P.J. Taylor in the mid-1970s, when they were both in the Cement and Concrete Association. The program was covering all aspects of design in accordance with CP110, from structural analysis to bar curtailment.

Also around 1980, OASYS software was developed by Ove Arup Partnership for Hewlett-Packard 9845S system. The program was produced to include a large number of various aspects of structural analysis and design, and other aspects like surveying, drainage, road works, thermal behavior of sections etc. The CP110 design package of the program contained programs for analysis and design of continuous beams, rectangular and irregular columns, flat slabs, foundation, etc.

While all these were going on, in 1982, Autodesk made Autocad commercially available for drafting and computer-aided designs. From that moment till now, numerous computer packages have been developed to assist engineers in analysis, design, simulation, and drafting.

We have ANSYS, Staad Pro, Etabs, SAP, Safe, STRAP, Tekla, Orion, and so many packages too numerous to mention. There are also many computer programs written with packages like FORTRAN, MS Excel VBA, MATLAB etc, which serve the purpose of helping the engineer solve a specific problem.

structural design

These packages have made life easier for design engineers in the office by considerably lowering the man-hours involved on the analysis, design, and drawing of structures. This means that working drawings, costing, and presentations can be done faster prior to kicking off of constructions. On the other hand, it has made it easier for corrections and modifications to be made to a structure, with their effects appropriately accounted for.

But the question still remains, ‘Do all these programs and packages make a design engineer better?

The answer is relative. An engineer is an individual who has been trained in an accredited institution, with appropriate years of experience and professional license to practice the profession of engineering. An engineer is expected to improve on the job, by following up with relevant technological advancements in the field, attending seminars and conferences, and networking with his colleagues.

For instance, a new construction procedure might demand a new method of reinforcement detailing and it expected that a modern engineer keeps up with all these developments.

Back to the issue of engineering software, if an engineer is proficient in the use of say computer programs, does that make him better than an engineer who can use just two programs? The first answer that will come to mind is probably ‘NO’. This is because the knowledge of computer programs does not make an engineer.

What makes a complete engineer is his personality, competence, knowledge, training, background on engineering practice, and years of experience. For engineers, the knowledge of software is not an end itself, but an alternative means to an end. These packages are here to help engineers work faster and more efficiently, and that is why they are programmed to request our input before they can give us an output.

I was involved in a project in Lagos Nigeria, and when I looked at the structural drawing, it was a complete waste of resources. The residential building was to go four storeys high, and no span was longer than 7m. At the ground floor, a column section of 900mm x 300mm was provided with 10Y25 (Asprov = 4910 mm2) as reinforcement. On the first floor of the same column, 28Y25 (Asprov = 13748 mm2) was provided!!

The drawing in question has been approved and construction has commenced already. Based on the design results, the designer would have asked questions. But a certain software gave him the result, and he submitted it just like that without probably reviewing the output. Even if there were unbalanced moments due to eccentricity or structural arrangement that is causing heavy bending on the column, it is his duty to scrutinize the arrangement. But he is an ‘engineer’ who can use design software, yet he has shown that he has no solid foundation in engineering as far as that output was concerned, or he doesn’t care about cost.

In terms of job opportunities and employability in the industry, the knowledge of a certain software can be an advantage to a candidate. Yes, this is because a design firm might be users of a particular computer program, and they might prefer to hire someone who already has knowledge of that software. But on the other hand, it would still be very disastrous if the desired candidate does not understand the basic theory of structures. It is easier to train someone on how to use a computer program than to train someone on the fundamentals of structural analysis and design. This calls for consideration on the part of employers.

In summary, commercial design software are helpers. We are supposed to do the thinking and design, while computer programs will help us carry out the lengthy calculations. When they produce an inconsistent result, we are supposed to ask why, and review our inputs.

Computer programs do not make better engineers, but they have made engineering as a profession better. That is why Structville remains committed to original and sound knowledge from the first principles. The current curriculum of our universities is sufficient to produce engineers who can handle simple designs after graduation, and lecturers should be willing to ‘teach’ design, and not ‘lecture’ it.

From my experience in the industry so far, the quality of teaching received in the university contributes immensely to the capacity of fresh graduates to carry out structural design independently. If they were ‘lectured‘ and not ‘taught‘, they might spend the rest of their professional career relying solely on computer programs.

Structural design at the undergraduate level should not be an issue of, “take this handout or textbook and study the examples” only. Structural design should be taught passionately from scratch and demonstrated with practical examples to the fullest extent possible.

I will ever be grateful to Prof. C. H. Aginam of the Department of Civil Engineering, Nnamdi Azikiwe University Awka. In the first semester of our 3rd year, he loaded us with knowledge on the deflection of elastic systems, analysis of continuous beams (Clapeyron’s theorem of three moments, slope deflection method, force method), Maxwell’s theorem, Betti’s law, Vereschagin’s rule, Castigliano’s theorem, analysis of portal frames, etc.

When we found ourselves mid-way in the 2nd semester, we were already designing three-storey buildings using pen and calculator from the roof beam to the foundation. I still remember the way he shouts and sweats, writing on the board, and cleaning over and over again, inspecting our notes, making sure every one downloaded and printed a copy of BS 8110-1:1997, ensuring that everyone purchased at least one design textbook of his/her choice. He is a phenomenal teacher.

Benefiting from his wealth of knowledge, I did all my designs with pen and calculator until I went for my Industrial Training in 4th year. It was during my industrial training that I had my first laptop and learned how to use AUTOCAD and a few other design software.

It is the fundamental knowledge of engineering and ingenuity that makes a good engineer; computer programs are here to make our work faster and eliminate human errors from lengthy computations. Once again, it is worth acknowledging that the availability of these design software have made engineering as a discipline better and more efficient. Let us keep getting it right.


How to Calculate the Settlement of Spread Foundation (EC7 Part 2)

In this article, we will discuss an approach described in Annex E of EN 1997-2:2006 (Eurocode 7 Part 2) for determining the elastic settlement of spread foundations. This is based on a semi-empirical method and the result of the MPM test (Menard Pressuremeter Test).

The formula for evaluating the settlement of a spread footing is given below;

settlement%2Bequation


where;
Bo is a reference width of 0.6 m;
B is the width of the foundation;
λd , λc are shape factors given in Table E.2;
α is a rheological factor given in Table E.3;
Ec is the weighted value of EM immediately below the foundation;
Ed is the harmonic mean of EM in all layers up to 8 × B below the foundation;
σv0 is the total (initial) vertical stress at the level of the foundation base;
q is the design normal pressure applied on the foundation.

The Table E.2 and E.3 of EC7-2 are given below;

Table%2BE2
tABLE%2BE3

Solved Example

A 2m x 2m square footing is carrying a quasi-permanent SLS combination load of 1040 kN. The Menard Pressuremeter moduli values are as given in the sketch below. Calculate the settlement of the foundation, if the unit weight of the first layer of soil is 18.0 kN/m3.

Question

Solution

σv0 = 18 kN/m3 × 1.2m = 21.6  kN/m2
q = 1040 kN / (2m × 2m) = 260  kN/m2
B = 2.0m (width of the foundation)
λd = 1.12 (square foundation)
λc = 1.1 (square foundation)
α = 0.67 (normally consolidated clay)
Ec = 16.8 MPa
Ed = 3/[(1/16.8) + (1/27) + (1/33)] =  23.447 MPa
Substituting these values into the settlement equation;

equation

Therefore, the settlement of the foundation is 5.358mm.

What do you think about this approach?
Thank you for visiting Structville today.


Design of Timber Roof Truss

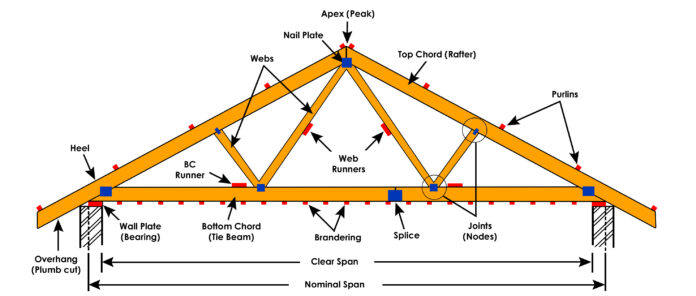
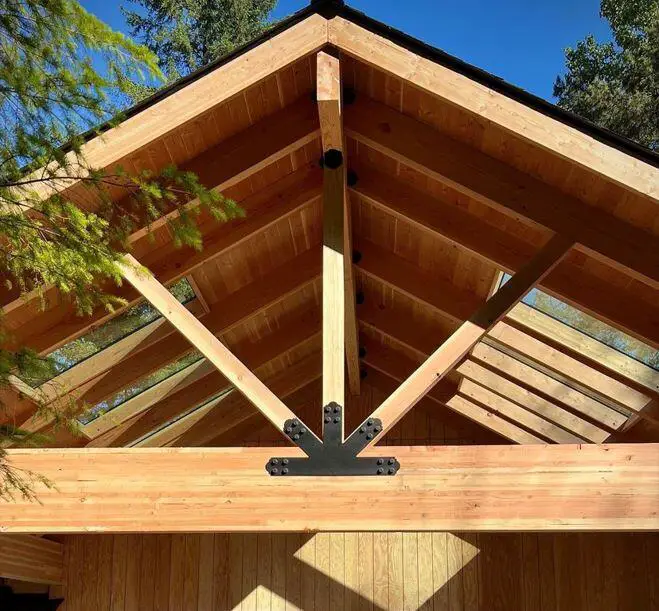
The use of timber as trussed rafters for roofs of buildings is a very popular alternative all over the world. Timber roof trusses are made up of a series of interconnected timber members that are arranged in a triangular pattern. This pattern allows the truss to distribute the weight of the roof evenly across its supports, making it a strong and efficient structural system.

roof truss design
Figure 1: Members of a timber roof truss

The aim of this article is to show the design example of a timber roof truss (trussed rafter). As a direct product of nature, timber has so many variable properties that are more complex than that of concrete, steel, bricks, or aluminium. Some of the characteristics which influence the structural behaviour of timber are;

  • moisture content
  • the direction of applied load (perpendicular or parallel to the grain)
  • duration of loading
  • strength grading of the timber
commercial timber log
Figure 2: Unprocessed timber logs

Steps in the Design of Timber Roof Trusses

Here’s a step-by-step overview of the design process for timber roof trusses:

1. Preliminary Design: In this step, the designer is to determine the roof span, pitch, and overall architectural design of the building. It is important to choose a truss configuration based on structural performance, aesthetic preferences, functional requirements, and available space.

2. Load Analysis: In this case, it is important to identify and analyze all relevant loads, including dead loads (roofing materials, insulation), live loads (snow, occupants), and potential wind or seismic loads. Calculate the total design load that the truss system must support.

3. Material Selection: Choose an appropriate timber species based on its mechanical properties, availability, and durability. It is important to consider factors such as bending strength, compression and tension properties, and resistance to decay.

4. Truss Geometry and Configuration: Based on the chosen truss configuration (e.g., king post, queen post, Howe truss), determine the angles, lengths, and dimensions of each timber member. It is important to ensure that the truss geometry is consistent with both structural and architectural requirements.

5. Member Sizing and Design: Calculate the axial forces, bending moments, and shear forces in each timber member using static equilibrium equations. Size each timber member to withstand the calculated forces while considering factors such as serviceability and durability.

6. Connection Design: Design secure and efficient connections between timber members using appropriate fasteners (nails, screws, bolts) and connectors (metal plates, brackets). Ensure that connections provide load transfer, prevent excessive movement, and account for potential wood shrinkage.

7. Lateral Stability and Bracing: Incorporate diagonal bracing or other lateral stability measures to prevent buckling or twisting of the truss members under lateral loads (wind or seismic forces).

8. Serviceability and Deflection Control: Assess the truss deflection under the designed loads to ensure that it meets acceptable serviceability criteria. Incorporate additional members or adjust member sizes if necessary to control deflection.

9. Fire Resistance and Protective Treatments: Consider fire resistance requirements by choosing fire-rated timber or applying fire-retardant treatments if needed. Apply appropriate protective coatings or treatments to enhance the truss’s durability and resistance to decay.

10. Detailed Drawings and Documentation: Create detailed construction drawings that specify the geometry, dimensions, connections, and material details of the truss members. Prepare design calculations and documentation that outline the design methodology, load assumptions, and member sizing.

Analysis of Timber Roof Trusses

Ideal trusses are theoretical structures in which the members meet at points called nodes. These nodes are idealized as hinges or pins, which means that they cannot transmit bending moments. Loads are applied to ideal trusses only at the nodes. This keeps the truss members free from shear and bending stresses and makes the analysis of the truss much simpler.

However, practical construction does not allow roof trusses to behave exactly as ideal trusses. The members of real-world trusses are not pinned at the nodes, and loads are often applied along the length of the chords. This means that practical trusses must resist bending moments and shear in addition to axial stress.

As a result, the classical methods of analyzing trusses are only valid for ideal trusses. These methods do not account for the bending moments and shear in practical trusses. As a result, the results of classical methods of analysis can be inaccurate for real-world trusses, even though they are usually employed.

Quickly in this post, I am going to carry out a very simple design example of timber roof truss using BS 5268. A lot of information regarding timber as a structural material can be obtained from specialist textbooks. It is worth knowing that the most current design code for timber structures is Eurocode 5.

Timber%2Broof%2Btruss%2Bdesign

Note:
BS 5268 is based on permissible stress design. When using permissible stress design, the margin of safety is introduced by considering structural behaviour under working/service load conditions and comparing the stresses thereby induced with permissible values. The permissible values are obtained by dividing the failure stresses by an appropriate factor of safety. The applied stresses are determined using elastic analysis techniques, i.e.

Stress induced by working loads ≤  (failure stress/factor of safety)

Since BS 5268 is a permissible stress design code, mathematical modelling of the behaviour of timber elements and structures is based on assumed elastic behaviour.

Solved Example

Let us design the roof truss of a building subjected to the following medium-term loads. The configuration of the roof truss is as shown above.

Data
Span of roof truss = 4.8m
Spacing of the truss = 2.0m
Nodal spacing of the trusses = 1.2m
Service class of roof truss: Service class 2

Load Analysis

(i) Dead Loads

On rafter (top chord)
Self-weight of long-span aluminium roofing sheet (0.55mm gauge thickness) = 0.019 kN/m2
Weight of purlin (assume 50mm x 50mm African Mahogany hardwood timber)
Density of African Mahogany = 530 kg/m3 = 0.013  kN/m = (0.013 × 2m)/(2m × 1.2m) = 0.0108 kN/m2
Self-weight of rafter (assume) = 0.05 kN/m2
Total = 0.0885 kN/m2
Weight on plan = 0.0885 × cos 17.35 = 0.08 kN/m2

On Ceiling Tie Member (bottom chord)
Weight of ceiling (10mm insulation fibre board) = 0.077 kN/m2
Weight of services = 0.1 kN/m2
Self weight of ceiling tie = 0.05 kN/m2
Total = 0.227 kN/m2
Therefore the nodal permanent load on rafter (Gk) = 0.08 kN/m2 × 2m × 1.2m = 0.192 kN
Therefore the nodal permanent load on ceiling tie (Gk) = 0.227 kN/m2 × 2m × 1.2m = 0.5448 kN

(ii) Live Load
Imposed load on top and bottom chord (qk) = 0.75 KN/m(treat as medium-term load on plan)
Therefore the nodal permanent load on rafter (Gk) = 0.75 kN/m2 × 2m × 1.2m = 1.8 kN

Analysis of the rafter (top chord)
Span Length = 1.257m
Load = (0.0885 + 0.75) × 2m = 1.667 kN/m

Timber%2BTruss%2BRafter

Results
Analysis of the structure for the loads gave the following results;

on%2Bstaad


All load values are medium-term loads;

Medium-term load is defined in this case by:
Dead load + temporary imposed load

Top Chord Result
Axial force = 10.1 kN (Compression)
Bending Moment = 0.2 kNm
Length of member = 1.26 m

Design of the Top Chord
Let us try 38mm x 100mm timber
Strength class C18

Compression parallel to grain (σc,g,||) = 7.1 N/mm2
σc,adm,|| = σc,g,|| ×  k× k3 × k8 × k12

Bending parallel to grain (σm,g,||) = 5.8 N/mm2
σm,adm,|| = σm,g,|| ×  k× k3 × k6 × k× k8

k= wet exposure (does not apply in this case)
k= duration factor = 1.25 (medium-term loading)
k= shape factor = 1.0 (rectangular section)
k= Depth of section 72mm < h < 300mm
k= (300/h)0.11 = (300/100)0.11 = 1.128
k= Load sharing factor (does not apply since the spacing of the rafters exceed 610 mm).

Section Properties
Area = 3.8 × 10mm2
Zxx = 63.3 × 10mm3
Zyy = 24.1 × 10mm3
Ixx = 3.17 × 10mm4
Iyy = 0.457 × 10mm4
rxx = 28.9 mm
ryy = 11 mm

Applied bending stress
σm,a,|| = M/Z = (0.2 × 10⁶)/(63.6 × 103) = 3.144 N/mm2

Axial compressive stress
σc,a,|| = P/A = (10.1 × 10³)/(3.8 × 103) = 2.657 N/mm2

Check for slenderness
Effective length (Le) = 1260 mm (assuming pin end connection)

λ = Le/r = 1260/28.9 = 43.598 < 52 Ok  (clause 2.11.4)

Medium-term load
Compression parallel to grain (σc,g,||) = 7.1 N/mm2

Emin = 6000 N/mm2

k3 = 1.25 (Table 17)

σc,|| = 7.1 × 1.25 = 8.88 N/mm2

E/σc,|| = 6000/8.88 = 675.67
Slenderness λ = 43.598

We can obtain the value of k12 by interpolating from Table 22 of the code
We are interpolating for E/σc,|| = 675.67 and  λ = 43.598

E/σc,||           40         50
600           0.774       0.692
700           0.784       0.711

On interpolating (bivariate interpolation);
k12 = 0.7545

σc,adm,|| = σc,g,|| ×  k× k3 × k8 × k12
σc,adm,|| = 7.1 ×  1.0× 1.25 × 1.0 × 0.7545 = 6.699 N/mm2

σm,adm,|| = σm,g,|| ×  k× k3 × k6 × k× k8
σm,adm,|| = 5.8 ×  1.0× 1.25 × 1.0 × 1.128 × 1.0 = 8.178 N/mm2

Euler critical stress σ=  π2Emin2

σ=  π2(6000)/(43.598)= 31.154 N/mm2

For combined bending and compression

For%2Bcombined%2Bbending%2Band%2Bcompression

σm,a,|| =  3.144 N/mm2
σc,a,|| = 2.657 N/mm2
σc,adm,|| =  6.699 N/mm2
σm,adm,|| =  8.178 N/mm2
σ=  31.154 N/mm2

[3.144/(6.699 × 0.9034)] + [2.657/6.699] = 0.919 < 1.0
Therefore, 38mm x 100mm GS C18 Timber is adequate for the rafter

Consider portion over nodes (at supports)
Bending moment = 0.28 kN.m
Axial load (taking the average at that joint) = (10.81 + 8.43)/2 = 9.62 kN

Applied bending stress
σm,a,|| = M/Z = (0.28 × 10⁶)/(63.6 × 103) = 4.40 N/mm2

Axial compressive stress
σc,a,|| = P/A = (9.62 × 10³)/(3.8 × 103) = 2.531 N/mm2

At node point, λ < 5.0, and the rafter is designed as a short column at this point;

σc,adm,|| = σc,g,|| ×  k× k3 × k8
σc,adm,|| = 7.1 ×  1.0× 1.25 × 1.0  = 8.875 N/mm2

The interaction formula for this scenario is given below;

m,a,|| / σm,adm,||] + [σc,ma,|| / σc,adm,||] ≤ 1.0

[4.40 / 8.178] + [2.531 / 8.875] = 0.8232 < 1.0

This shows that the section is satisfactory for rafter.

Analysis of Tie Element
Span Length = 1.2m
Load = (0.227 + 0.75) × 2m = 1.954 kN/m

Results
Axial force = 9.74 kN (tension)
Bending Moment = 0.22 kNm
Length of member = 1.2m

Design of the Bottom Chord (ceiling tie)
Let us still try 38mm x 100mm timber
Strength class C18

Tension parallel to grain (σt,g,||) = 3.5 N/mm2
σt,adm,|| = σt,g,|| ×  k× k3 × k8 × k14
(width of section) k14 = (300/h)0.11 = (300/100)0.11 = 1.128
σt,adm,|| = 3.5 × 1.0× 1.25× 1.0 × 1.128 = 4.935 N/mm2

Bending parallel to grain (σm,g,||) = 5.8 N/mm2
σm,adm,|| = 5.8 ×  1.0× 1.25 × 1.0 × 1.128 × 1.0 = 8.178 N/mm2

Applied bending stress
σm,a,|| = M/Z = (0.22 × 10⁶)/(63.6 × 103) = 3.459 N/mm2

Axial tensile stress
σc,a,|| = P/Effective Area = (9.74 × 10³)/(3.8 × 103) = 2.563 N/mm2

Note: When the ceiling tie is connected to rafter by the means of a bolt, the projected area of the bolt hole must be subtracted from the gross area of the section.

Combined tension and bending
m,a,|| / σm,adm,||] + [σt,ma,|| / σt,adm,||] ≤ 1.0

[3.459 / 8.178] + [2.563 / 4.935] = 0.9422 < 1.0

This is ok.

Consider portion over nodes (at supports)
Bending moment = 0.3 kN.m
Axial load (taking the average at that joint) = (9.5 + 9.74)/2 = 9.62 kN

Applied bending stress
σm,a,|| = M/Z = (0.3 × 10⁶)/(63.6 × 103) = 4.7169 N/mm2

Axial tensile stress
σc,a,|| = P/Effective Area = (9.62 × 10³)/(3.8 × 103) = 2.531 N/mm2

Combined tension and bending
m,a,|| / σm,adm,||] + [σt,ma,|| / σt,adm,||] ≤ 1.0

[4.7169/ 8.178] + [2.531 / 4.935] = 1.089

In this case, the tie element may be increased to 38mm x 175mm or the grade of the timber could be changed to accommodate the combined flexural and axial stress in the member.

Check for deflection
Deflection of trussed rafter under full load = 6.095 mm (calculated on Staad)
Permissible deflection = 14 mm

Deflection is ok.

That is it for now. Thank you so much for visiting Structville today and God bless you. Remember to share with your folks.

Member Design of a 22m Span Steel Roof Truss

Introduction

We all need a roof over our head. Nowadays, architects frequently use roof pattern and design to enhance the aesthetics and functionality of a building, and it is very important that engineers follow up and ensure that the structural integrity of such roof systems are guaranteed. On the 10th of December 2016, the roof a church building collapsed at Uyo in Akwa Ibom state Nigeria, leaving about 60 people dead, and many other injured. This is why such designs are to be taken seriously, especially when the span is large.

truss

Large span construction of roof systems is usually found in public or commercial buildings. This comes in handy especially when there is need to have a large uninterrupted floor area. However, the efficiency of trusses in dealing with long span structures has been widely recognised in the structural engineering community, but there is no doubt that the longer the span, the more complex the design.


Some basic considerations in the design of trusses
(1)The connection design is as important as the member design. The connections could be welded or bolted or both.
(2) 2D idealisation of the structure is usually very sufficient for analysis and design.
(3) Joints are hardly pinned in reality, but the use of pinned joint is usually encouraged for the purpose of analysis and design.
(4) Trusses can be analysed as having continuous top and bottom chords, with the internal members pinned. In this case, loads can be applied at locations other than the joints with the resulting bending moment appropriately accounted for in the design.
(5)  It is usually important to consider out of plane buckling for compression members in trusses. However, purlins usually take care of the top chord, while bracing can be used to take care of the bottom chord.

Read Also…
Design of Roof Purlins

(6) For efficient structural performance, it is recommended that the truss span to depth ratio be kept between 10 to 15.
(7) In the layout of truss systems, it is more preferable (in terms of economy and efficiency) to have the shorter members in compression and the longer members in tension.
(8) Welded connections offer more advantages in terms of  deflection behaviour of trusses. Slack displacements are possible in bolted connections especially when non-preloaded bolts are used.
(9) In the design of compression members, buckling is the most critical.
(10) When member lines do not intersect at a node, it is important that the moment that arises due to the eccentricity be included in the design.


Design Example
The structural layout of a roof system is given below;

roof%2Blayout

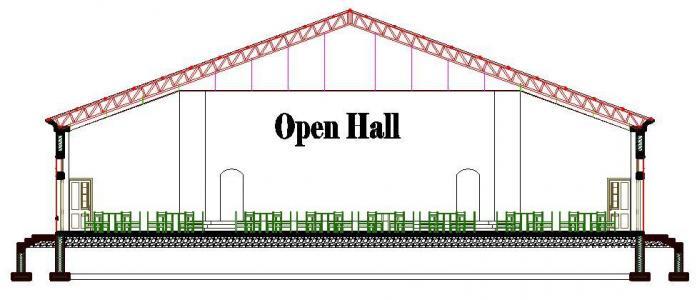
We are required to carry out the member design of the trusses for this 23m span open hall. The design data is given below;

Data
Design code: BS EN 1993-1-1:2005
Design wind pressure: 1.5 kN/m2
Variable load = 0.75 kN/m2

To make this post simpler and shorter, a 29 page fully referenced design paper for all the trusses in the roof system has been attached.

Click HERE to download the calculation sheet in PDF format (premium).

Thank you for visiting Structville today, and remember to tell your colleagues about us.

truss33

Read Also...
Practical Analysis and Design of Roof Trusses

Structural Analysis of Free-Standing Staircase

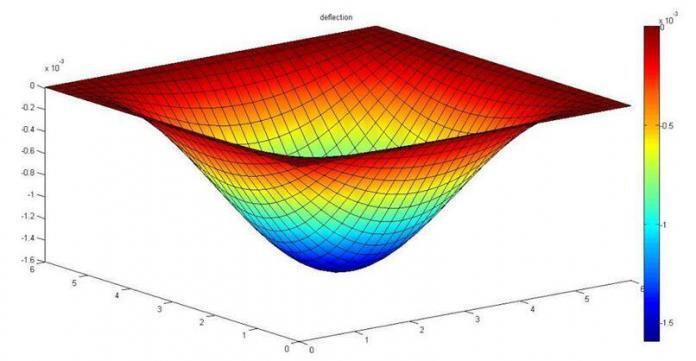
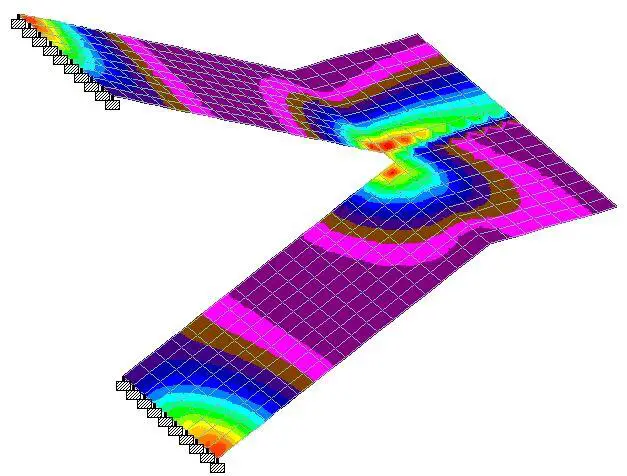
Free-standing staircases offer a very pleasing solution for vertical circulation in residential and commercial buildings. They are usually constructed in such a way that the landing is freely supported, while the supports at the flight are fully fixed. It is possible to have the flights supported in other ways, but that makes the analysis more complicated. Freestanding staircase structures are complex in analysis and design, but with finite element analysis packages, simple solutions can be easily obtained as shown in this post.

The most widely available manual solution for the analysis of free-standing staircases was developed by Cusens and Kuang using the strain-energy principles. Expressions were developed relating the horizontal restraint force H and the bending moment Mo at the mid-point of the free-standing stair. By solving both equations simultaneously, the values of Mo and H can be substituted into the general expressions to obtain the bending moments and forces at any point in the structure.

In this article, we are going to compare the results obtained with Staad Pro software with results from manual analysis using the method proposed in Table 175, Reynolds and Steedman, 2005.

Dimensions

FREE%2BSTANDING%2BPLAN
SECTION


Solved Example
The geometry of a free-standing staircase is given below. We are expected to analyse the staircase for the ultimate moment using the formula given in Reynolds and Steedman (2005) and compare the answer with the result from Staad Pro.

QUESTION

Data
Thickness of waist of flight and landing = 250 mm
Depth of riser = 150mm
Unit weight of concrete = 25 kN/m3

Actions on the stairs
Concrete self weight (waist area) = 0.25 × 25 = 6.25 kN/m2 (normal to the inclination)
Stepped area = 1⁄2 × 0.15 × 25= 1.875 KN/m2 (global vertical direction)
Finishes (say) = 1.2 kN/m2

We intend to apply all gravity loads purely in the global y-direction, therefore we convert the load at the waist of the stair from local to global direction by considering the angle of inclination of the flight area to the horizontal;

γ = tan-1⁡(1.5/3) = 26.565°

Therefore UDL from waist of the stair in the global direction is given by = (6.25 × cos 26.565) = 5.59 kN/m2

Total permanent action on flight area (gk) = 5.59 + 1.875 + 1.2 = 8.665 kN/m2
Total permanent action on landing; (gk) = 6.25 + 1.2 = 7.45 kN/m2

Variable load on staircase (qk) = 4 kN/m2

The load on the flight area at ultimate limit state = 1.35gk + 1.5qk
nf = 1.35(8.665) + 1.5(4) = 17.67 kN/m2

The load on the landing at ultimate limit state = 1.35gk + 1.5qk
nl = 1.35(7.45) + 1.5(4) = 16.06 kN/m2

From Table 175, Reynolds and Steedman (2005), the approximate formula for calculating the critical design moments for free-standing stairs with the flights fully fixed is given below;

H
MO
K

From the given question;
Load on flight nf = 17.67 kN/m2
Load on landing nl  = 16.06 kN/m2
Thickness of flight hf = 250 mm
Thickness of landing hl = 250 mm
a = 3.35m
b = 1.4m
b1 = 2.0m
γ = 26.565°

Plugging these values into the equations above;
K = 0.746
H = 222.637 kN
M0 = 70.541 kNm

Comparing the above answer with ultimate limit state answer from Staad Pro;

Longitudinal Moment

MY

You can see that M0 from Staad Pro is 65.1 kNm. This about 8.3% less than the anser gotten from manual analysis, and further reinforces the fact that finite element analysis approach to this problem yields a more economical result.

Transverse Moment
The moment in the x direction due to ultimate load is given below;

The maximum moment in the x-direction can be found to be 45.5 kNm. Cusens and Kuang (1966) recommends that the transverse reinforcement be concentrated in the vicinity of the flight and the landing. This results offers a good insight.

Torsion
The twisting moment on the staircase due to the load is given below;

Torsion

A little consideration of the above result will show that considerable twisting is occurring at the mid-span section of the flights. This completely agrees with the conclusions made by Cusens and Kuang (1966). In their own words,

“Large torsional moments are present in the flights of free-standing stairs and a proper thickness of concrete must be chosen to resist these moments, due to the difficulty of reinforcing shallow-wide sections against torsion.”

Cusens and Kuang (1966)


Longitudinal Shearing Stresses

SY

As you can see, the maximum longitudinal stress is occurring at point O with a value of 1.64 N/mm2.

We are undertaking further studies on the dynamic behaviour of free standing stairs. We will update in due time. Thank you for visiting, and God bless you.

References
Cusens A.R., Jing Gwo Kuang (1966): Experimental Investigation of Free Standing Stairs. Journal of the American Concrete Institute, Proceedings V. 63, No. 5, May 1966.

Reynolds C.E., Steedman J.C (2005): Reinforced Concrete Designers Handbook. Spon Press, Taylor and Francis Group, London ISBN 0-419-14540-3

Introduction to Structville Research

We are excited to announce that we have recently added a unique new page to our blog called ‘Structville Research‘. You can visit the page by clicking the link below;

Structville Research is a unique page dedicated to download of research articles, textbooks, design/analysis calculations, spreadsheets, drawings, and other useful educational resources and materials. Currently, we have about 10 articles waiting for your free download! However, some contents are premium, and purchases can be made easily on the spot through Paystack (see www.paystack.com).
Structville Research will be updated on regular basis, and we encourage you to always visit the page for the latest article. From Structville’s home page, you can easily find Structville Research at the menu bar and at the side bar.
Furthermore, if there is any article, drawing, or spreadsheet that you have the copyright permission to distribute, and you will like to have it featured on Structville Research, kindly let us know by sending an e-mail to info@structville.com.
We look forward to seeing you at Structville, where passion for excellence reflects in everything. Thank you, and enjoy the rest of your day. God bless.

Structural Design of Pile Caps Using Strut and Tie Model (EC 2)

Pile caps are concrete mats that rests on piles with adequate rigidity to transfer the column loads to the piles. Piles are provided as alternatives to shallow foundations when a firm and stable soil to carry column load is too deep below the surface, or when high lateral load is anticipated. More often than not, pile caps are usually so rigid that they make the entire group of piles to behave like one unit.

EN 1992-1-1:2004 permits us to use strut and tie models to analyse structures where non-linear strain distribution exists (e.g. pile caps, deep beams and corbels).

In strut and tie models, trusses are used with the following components:
• Struts (concrete)
• Ties (reinforcement)
• Nodes (intersections of struts and ties)

Eurocode 2 gives guidance for each of these.


Design Example
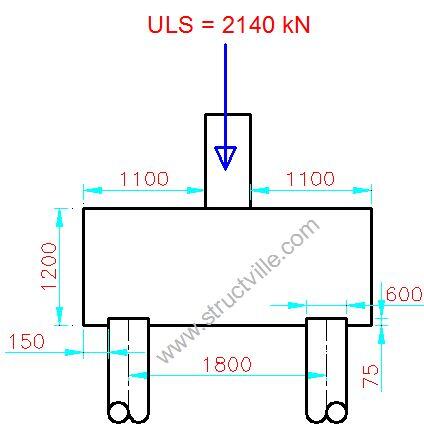
A 500mm x 500mm column is carrying an ultimate limit state load of 2140 kN. We are to design the pile cap using the following data;

Grade of concrete fck = 30 N/mm2
Fyk = 500 N/mm2
Concrete cover = 75mm
Spacing of pile = 1800mm
Diameter of piles = 600mm

Pile%2Bcap%2Bdesign%2BStrut%2Band%2BTie%2BMethod
Solution

The strut and tie model is as given below;

pile%2Bcap

Angle of inclination of strut γ = tan-1 (1100/900) = 50.710°
cos  γ = 0.633
sin γ = 0.7739

Force in strut Fs = 1070/sinγ = 1382.6075 kN

Force in tie Ft = 1382.6075 cos γ = 875.15 KN

Area of tension steel required As = Ft/0.87Fyk = (875.15 × 1000) / (0.87 × 500) = 2011.8 mm2
Provide 7H20 @ 150 c/c (Asprov = 2189 mm2 )
Asmin = 0.13bh/100 = 0.0013 × 900 × 1200 = 1404 mm2

Since pile spacing is less than three times pile diameter, the bars may be spread uniformly across the cap.

Check for Shear
Consider the critical section for shear to be located at 20% of the pile diameter inside the pile cap.

Distance of this section from the column face;
av = 0.5(Spacing between piles – width of column) – 0.3(pile diameter)
av = 0.5(1800 – 500) – 0.3(600) = 470 mm

Length of corresponding perimeter for punching shear
u = 2(900 + 1440) = 4680mm

Perimeter of pile cap = 2(900 + 2700) = 7200mm

Since the perimeter of the pile cap is less than 2u, normal shear extending across the full width of the pile cap is more critical than punching shear.

The contribution of the column load to the shear force may be reduced by applying a factor β = av/2d, where 0.5d ≤ a≤ 2d

But a little consideration will show that av(470 mm) < 0.5d(550 mm), therefore, take av as 0.5d (550)
Therefore β = 550 / 2(1100) = 0.25

v = βV/bd

V = 1070 KN + (Self weight of pile cap/2)
Self weight of pile cap = 1.35(25 × 2.7 × 0.9 × 1.2) = 98.415 KN

v = (0.25 × 1119.2 × 1000)/(2700 × 1100) = 0.0942 N/mm2

VRd,c = [CRd,c.k.(100ρ1 fck)(1/3) + k1cp] ≥ (Vmin + k1cp)


CRd,c = 0.18/γc = 0.18/1.5 = 0.12
k = 1 + √(200/d) = 1 + √(200/1100) = 1.426 > 2.0, therefore, k = 1.426
Vmin = 0.035k(3/2) fck0.5
Vmin = 0.035 × (1.426)1.5 × 300.5 = 0.326 N/mm2
ρ1 = As/bd = 2185/(2700 × 1100) = 0.0007356 > 0.02; Therefore take 0.02

VRd,c = [0.12 × 1.426 (100 × 0.0007356 × 30)(1/3)]  = 0.2227  N/mm2

Shear is ok.

Punching Shear Along Column Perimeter
V = 2140 KN

v = V/ud
v = (2140 × 1000)/(2000 × 1100) = 0.972 N/mm2

VRd,max = 0.2(1 –  fck/250)fck
VRd,max = 0.2 (1 – 30/250)30 = 5.28 N/mm2
This shows that the punching shear around column perimeter is ok.

Extra
This pile cap has been modelled on Staad Pro and the results obtained are given below.The set back in the model is the piles were modelled as columns that could sway under the load. What do you think?

PILE%2BCAP%2BSTAAD%2BPRO
pile%2Bcap%2Bbending
Thank you for visiting Structville today and God bless. Kindly share with your folks.

Structural Design of Steel Fin Plate Connection

1.0 Introduction
The fin plate connection is very popular in the construction industry due to its ease of erection, and the absence of shared bolts in two sided connections. It consists of a length of plate welded to the supporting member (eg column or primary beam), and the supported member bolted to the fin plate. Technically, fin plates derive their rotational capacity from shear deformation of the bolts, and hole distortion in the fin plate and/or the beam web.

Fin%2BPlate%2BConnection

2.0 Practical Considerations and Recommended Geometry
With 10mm thick fin plate in S275 steel, 8mm fillet weld to the supporting member will guard against any possibility of weld failure (CSI, 2011). Fin plates may be classified as short or long as follows;

Short tp/zp ≥ 0.15
Long tp/zp < 0.15

Where zp is the distance between the face of the support and the first line of bolts. For short fin plates, erection on site is usually more difficult, but with long fin plates, care must be taken against lateral torsional buckling, especially if the beam is laterally unrestrained.

According to SCI (2011), when detailing the joint, the following recommendations should be followed;
(1) Full strength fillet welds are provided
(2) The fin plate is positioned close to the top flange in order to provide positional restraint
(3) The depth of the fin plate is at least 0.6 times the supported beam depth in order to provide the beam with adequate torsional restraint
(4) The thickness of the fin plate or the beam web is ≤ 0.50d (for S275 steel)
(5) Property class 8.8 bolts non-preloaded are used
(6) All end and edge distances on the plate and the beam web are at least 2d

fin%2Bplate
3.0 Solved Example
A secondary beam UKB 305 x 165 x 40  is supported on a primary beam of  UKB 533 x 210 x 101 with an ultimate shear force of 100.25 kN. We are to design a fin plate connection for this joint using grade 8.8 non preloaded bolts.
 
Initial Considerations

Since the depth of beam is less than 610mm, let us adopt fin plate size of 100 x 10mm
Gap gh = 10mm
Bolt rows = 3
Length of plate = 0.6 × 303.4 = 182.04mm (provide plate length = 220mm)

Fin%2Bplate%2Bjoint%2Bconnection

(i) Supported beam Bolt Shear Check
Basic requirement VEd ≤ VRd

VRd = nFv,Rd/sqrt[(1 + αn)2 + (βn)2]

Fv,Rd = (αvfubA)/γm2

For M20 8.8 bolts;
Fv,Rd = (0.6 × 800 × 245)/1.25 = 94080 N = 94.08 kN

For a single vertical line of bolt (n2 = 1, and n = n1); α = 0

β = 6z/[n1(n1 + 1)p1]
β = (6 × 30)/[3 × (3 + 1) × 70] = 0.214

Therefore;
VRd = (3 × 94.08)/sqrt[(1 + 0 × 3)2 + (0.214 × 3)2)] = 237.506 kN

VEd = 100.25 kN < 237.506 kN
Therefore bolt group is ok for shear


(ii) Fin plate in bearing
Basic requirement VEd ≤ VRd

VRd = n/sqrt{[(1 + αn)/(Fb,ver,Rd )]2 + [βn/(Fb,hor,Rd]2}

α = 0; β = 0.214

The vertical bearing resistance of a single bolt
Fb,ver,Rd = (k1αbfupdtp)/γm2

k= min[2.8(e2/d0) – 1.7; 2.5) =  min[2.8(50/22) – 1.7; 2.5)
= min[4.66;2.5] = 2.5

α= min[e1/3d0; (p1/3d0 – 1/4); fub/fup; 1.0]
= min[40/(3 × 22); (70/(3 × 22) – 0.25); 800/410; 1.0]
= min[0.61; 0.81; 1.95; 1.0] = 0.61

Fb,ver,Rd = (2.5 × 0.61 × 410 × 20 ×10)/1.25 = 100040 N = 100.04 kN

The horizontal bearing resistance of a single bolt
Fb,hor,Rd = (k1αbfupdtp)/γm2

k= min[2.8(e1/d0) – 1.7; 1.4(p1/d0) – 1.7;  2.5)
=  min[2.8(40/22) – 1.7; 1.4(70/22) – 1.7;2.5)
= min[3.39; 2.75; 2.5] = 2.5

α= min[e2/3d0; fub/fup; 1.0]
= min[50/(3 × 22); 800/410; 1.0]
= min[0.76; 1.95; 1.0] = 0.76

Fb,hor,Rd = (2.5 × 0.76 × 410 × 20 ×10)/1.25 = 124640 N = 124.64 kN

VRd = (3)/sqrt{[(1 + 0 × 3)/100]2 + [(0.214 × 3)/124.64]2) = 288.218 kN

VEd = 100.25 kN < 288.218 kN Ok

(iii) Supported Beam – Fin Plate

Shear
Basic requirement VEd ≤ VRd,min

VRd,min = min(VRd,g;VRd,n;VRd,n)

Gross section
VRd,g = (hp.tp.ffy,p)/[1.27 × sqrt(3) × γm0]

VRd,g = [(220 × 10 × 275)/(1.27 × √3 × 1.0)] × 10-3 = 275.034 kN

Net Section
VRd,n = Av,net × [fu,p / (sqrt(3) × γm2)]

Net Area = Av,net =  tp.(h– n1.d0)
Av,net =  10(220 – 3 × 22) = 1540 mm2

VRd,n = 1540  × [410 / (√3 × 1.1)] × 10-3 = 331.399 kN

Block Tearing
VRd,b = [(0.5fu,p Antm2] +  [fy,p Anv / (sqrt(3) × γm0)]

Net area subject to tension = Ant = tp[e2 –  0.5d0]
Ant = 10[e2 –  0.5d0]
Ant = 10[50  –  0.5 × 22] = 390 mm2

Net area subject to shear = Anv = tp[h– e1 –  (n– 0.5)d0]
Anv = 10[20 – 40 –  (3 – 0.5) × 22] = 1250 mm2

VRd,b = [(0.5 × 410 × 390)1.1] +  [(275 × 1250)/ (sqrt(3) × 1.0)] = 72681.818 + 198464.155 = 271145.973 = 271.145 kN

VRd,min = min(275.034; 331.399; 271.145 ) = 271.145 kN

VRd,min = 100.25 kN < 271.145 kN Ok

Lateral Torsional Buckling of fin plates
Basic requirement VEd ≤ VRd
tp/zp = 220/50 = 4.4 > 0.15

Therefore fin plate is short;
VRd = [(Wel,p/z) × (fy,p / γm0)]

Wel,p = (tphp2)/6 = (10 × 2202)/6 = 73333.333 mm3

VRd = [(73333.333/50) × (275 / 1.0)] = 403333.333 N = 403.333 kN
VEd = 100.25 kN < 403.33 kN Ok

Supported Beam in Shear
Gross Section
VRd,g = [Av,web × (fy,b1  / (sqrt(3) × γm0))]

Gross Area Av  = ATee – btf,b1 + (tw,b1 + 2rb1× 0.5tf,b1

ATee =  (265.2 – 10.2) × 6 + (165 × 10.2) = 1530 + 1683 = 3213 mm2
Av  = 3213 – (165 × 10.2) +  (6 + 2 × 8.9) × 0.5 × 10.5 = 3213 – 1683 + 124.95 = 1654.95 mm2

VRd,g = 1654.95 × 275 / (sqrt(3) × 1.0) = 262758.603 N = 262.758 kN


Net Section
VRd,n = [Av,net × (fu,b1  / (sqrt(3) × γm2))]

Net area; Av,net = A– n1d0tw,b1 1654.95 – (3 × 22 × 6) = 1258.95 mm2

VRd,n = 1258.95 × 410 / (sqrt(3) × 1.1) = 270918.727 N = 270.918 kN

Block Tearing
VRd,b = [(0.5fu,b1 Antm2] +  [fy,b1 Anv / (sqrt(3) × γm0)]

Net area subject to tension = Ant = tw,b1[e2,b –  0.5d0]
Ant = 6[40  –  0.5 × 22] = 174 mm2

Net area subject to shear = Anv = tw,b1[e1,b + (n– 1)p– (n– 0.5)d0]
Anv = 6[40 + (3 – 1)70 –  (3 – 0.5)22] = 750 mm2

VRd,b = [(0.5 × 410 × 175)1.1] +  [(275 × 750)/ (sqrt(3) × 1.0)] = 35873.9 + 119081.986 = 154955.886 = 154.955 kN

VRd,min = min(262.758; 270.918; 154.955) = 154.955 kN

VRd,min = 100.25 kN < 154.955 kN Ok

Check for welding (supporting beam)
For a beam in S275 steel;

Basic requirement; a ≥ 0.5tp
0.5tp = 0.5 × 10 = 5mm
a = 5.7mm > 0.5tp

Thank you for visiting Structville today. God bless you.

Thickness Design of Column Base Plate Using Prokon Software

Last year, I made a submission here on how to carry out the thickness design of column base plates.

See post below;
Thickness Design of Column Base Plates According to EC3

Column%2BBase%2BPlate

Right now, we wish to check the result obtained from the manual analysis above with result from Prokon software. This present design has been carried out according to BS 5950:2000, and in this post, we will highlight all the input variables that are necessary to carry out the design, as well as the results.

Axial Load on Column 
Characteristic force from permanent action Gk = 620 kN
Characteristic force from leading variable action  Qk = 132 kN

Partial Factor for Loads 
Permanent action γG = 1.4
Variable action γG = 1.6

At ultimate limit state;
N = 1.4Gk + 1.6Qk
N = 1.4(620) + 1.6(132) = 1079.2 kN

Column Dimensions and Properties (UC 203 x 203 x 60)
Depth (d) = 209.6mm
Width (b) = 205.8mm
Thickness of web (tw) = 9.4mm
Thickness of flange = (tf) = 14.2mm
Root radius (r) = 10.2mm
Perimeter of section = 1206.4mm
Area of section = 76.4 cm2

Base Plate Bedding Details
Strength of concrete/grout = 25 N/mm2

Design Using Prokon


Step 1: Getting stared
Launch the Prokon Software, go to ‘Connections Module’, and select ‘Base Plate’. The window below comes up.

Window

This is a simple interactive interface that allows you to carry out your design in a very simple manner. As you input the design variables, the graphical representation of what you are doing comes up on the window, so that you will remain properly guided.


Step 2: Verify Design Code
At the upper left hand side of the screen, go to ‘File’, and make sure that the design code is set to BS 5950

Step 3: Select the Section Size

column

At the column dialog box at the upper left hand side of the screen, check the universal column symbol (see screenshot above). Now, go to the drop down list and select the appropriate column section. In this example, we are dealing with UC  203x203x60.

Step 4: Input Dimensions
As a guide, the area of base plate required should be equal to or greater than;
N/0.6fcu = (1079.2 x 1000)/(0.6 x 25) = 71946.667 mm2

It is always a good practice to allow at least 100mm from the edge of the column to the base plate.

Let us adopt base plate 350mm x 350mm (Aprov = 122500 mm2).

Now input the base plate dimensions as given below;

a1

You will discover that the drawing below automatically appears on the window;

a2

What this requires is for you to input the offset, in order to position the column on your desired location on the base plate. However, we want our column to centralised, and Prokon gives us that option by the click of a button. Go to the area where you input loads, and by the side of the table, click on ‘Centralise Column’. This brings the column to the centre of the base plate, and the offset value is calculated automatically for us. See the new image below;

a4

Now, by imputing the rest of the variables, we can position the bolts to suit the design appropriately. We are offsetting the bolts 35mm from the edge of the plate. See the input and the result below;

a5
a6


Step 5: Define materials properties (general parameters)
From the dialog box below, define the properties of the materials to be used in the construction.

a7

We are saying no to the use of studs because we want the column load to be transferred directly to the concrete bedding and not to the bolts. The grade of concrete and yield stress of steel selected is as given above.

Step 6: Define the loads
Since we have already factored our loads, we can input the ultimate load directly and set the load factor as unity (1.0). Alternatively, we can input the dead load and live load separately with their appropriate factor of safety, but note that they must be presented as the same load case. See below;

a8
Step 7: Design
If you have gotten to this point without any errors, we can then click on ‘Design’ function, and the window below comes up with the design completely done;

unstiffened

When the plate is unstiffened, the design result above holds good, with base plate thickness of 18mm.

When the plate is stiffened, the design result below holds good, which also includes the thickness of the stiffeners, and weld designs. The plate thickness in this case reduced to 10mm.

stiffe


Step 8: Detail Drawing
Click on drawing, and you will be able to see the shop drawing for the design. The images below gives the detailing for the unstiffened and stiffened plates respectively.

det1
det%2B2

Conclusion
I think the result above needs no interpretation. The details are quite crystal clear and I must say that it is very impressive. It is very interesting to note that when this same base plate was designed manually using EC3 (unstiffened), we obtained a thickness of 18.447mm, and then provided a base plate of 20mm. This shows reliability of both methods for all practical purposes. You can read the manual design below just in case you missed it.

Thickness Design of Column Base Plates According to EC3

Thank you for visiting Structville today, and God bless.

E-mail your thoughts to the author: ubani@structville.com