8.7 C
New York
Wednesday, April 2, 2025
Home Blog Page 25

Application of Waste Rubber Tyre in Concrete Production: A Brief Review

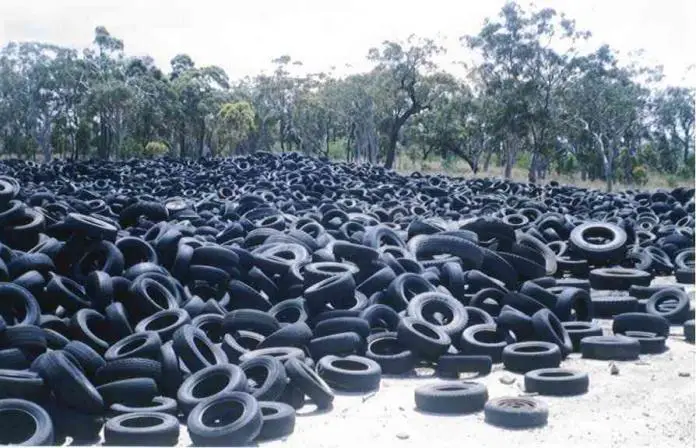
Waste rubber tyre is a serious environmental issue that is becoming increasingly important. Currently, huge amounts of waste rubber tyres are being stockpiled (whole tyres) or landfilled (shredded tyres), with 3 billion in the EU and 1 billion in the US (Sofi, 2018). By the year 2030, the number of tyres used in automobiles is expected to exceed 1.2 billion, equating to about 5 billion waste tyres thrown away on a yearly basis.

Landfilling of tyres poses a severe environmental risk. Waste tyre disposal regions, in particular, contribute to biodiversity loss, as tyres contain hazardous and soluble components (Thomas et al, 2015). Recycling is one of the most significant waste reduction methods; nevertheless, recycling discarded tyres is especially difficult due to their high creation rates and non-biodegradability. Incorporating waste tyres as a partial substitute for coarse aggregate in the most extensively used building material, concrete, is one strategy to reduce the volume of waste tyres in the environment (Muyen et al, 2019).

In the majority of studies and research works, three general categories of waste tyre rubber are usually investigated, namely chipped, crumb, and ground rubber:

(1) Chipped Rubber:
Chipped rubber is waste tyre rubber that has been shredded or chopped to replace the gravel (coarse aggregate in concrete). Two phases of tyre shredding are required to generate this rubber. The rubber should be 300 – 430 mm long and 100–230 mm wide by the end of stage one. Cutting reduces the size to 100–150 mm in the second stage. If the shredding process is prolonged, shredded particles with a size of 13–76 mm are formed, which are referred to as “shredded particles.”

(2) Crumb Rubber:
Crumb rubber, which is used to substitute sand (fine aggregate), is made in special mills where large rubbers are broken down into smaller ripped pieces. Depending on the type of mills used and the temperature generated, different sizes of rubber particles may be produced. Particles with a high irregularity in the range of 0.425–4.75 mm are created using a simple approach.

(3) Ground Rubber:
Ground rubber that could be used to replace cement is dependent on the equipment used for the size reduction. Magnetic separation and screening are commonly performed in two steps on waste rubber tyres. In increasingly complicated techniques, different size percentages of rubber are obtained. The particles produced in the micro-milling process range in size from 0.075 to 0.475 mm.

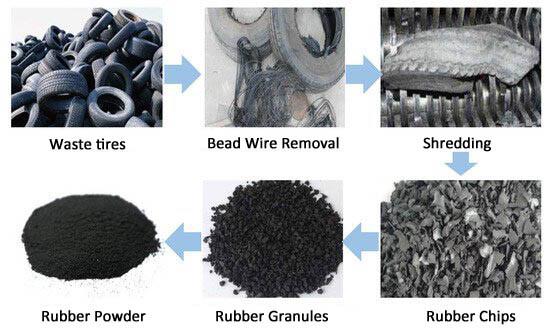
Processing of Waste Rubber Tyre
Figure 1: Processing of waste rubber tyre for concrete production

Generically, rubber aggregates are made from waste tyres using one of two methods: mechanical grinding at room temperature or cryogenic grinding below the glass transition temperature. To substitute coarse aggregates, the first process yields chipped rubber. The second process, on the other hand, frequently results in crumb rubber being used to substitute fine aggregates (Kotresh and Belachew, 2014).

Effect of Waste Rubber Tyre on the Mechanical Properties of Concrete

The inclusion of tyre rubber particles in concrete has been proven to affect the performance of concrete in both positive and negative ways, according to research. According to some research works cited by Sofi (2018), waste rubber tyre in concrete is especially recommended for concrete constructions located in locations with a high risk of earthquakes, as well as applications subjected to high dynamic forces, such as railway sleepers. One of the most significant disadvantages of employing tyre rubber in concrete is that it has a significantly lower mechanical performance than normal concrete.

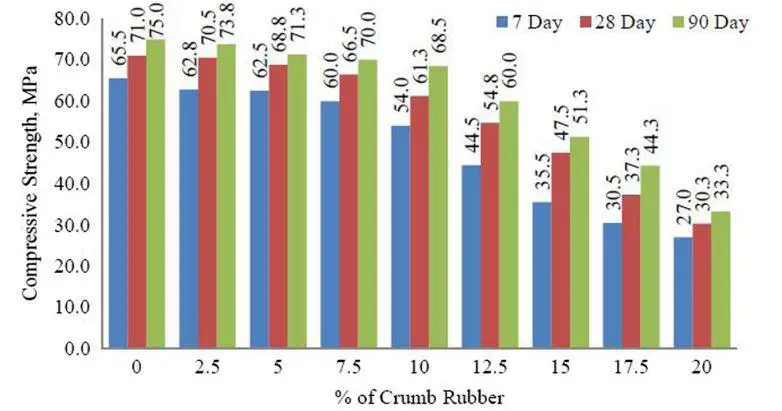
According to Muyen et al. (2019), a 5% replacement of conventional aggregates with waste tyre chips leads to a 5% loss in compressive strength, a 10% replacement results in a 26% drop, and a 15% replacement results in a 47% reduction in compressive strength. As a result, when waste tyre rubber aggregates are utilized in concrete production, a reduction in compressive strength is predicted. This is consistent with the findings of Ganjian et al (2009) and Su et al (2014).

Variation of crumb rubber with compressive strength of concrete
Figure 2: Variation of compressive strength of concrete with rubber content (Sofi, 2018)

On the other hand, when 20% fine aggregate was replaced with rubber aggregate, Su et al. (2015) observed a 12.8%drop in the flexural strength. When the rubber particles were smaller, there was less loss of strength. The tensile strength of concrete reduces with increase in the percentage of rubber replacement in concrete. The tensile strength of concrete containing chipped rubber (replacement for aggregates) is lower than that of concrete containing powdered rubber (for cement replacement) (Sofi, 2018).

Rubberized concrete’s strength and elastic modulus were found to be significantly reduced, according to researchers (Zheng et al, 2008; Elchalakani, 2015). The decreased stiffness (5 MPa) of the rubber, the uneven distribution of the rubber aggregate due to its lightweight, and the poor bonding between the rubber aggregate and the cement paste have all been blamed for the reduced mechanical performance (Panda et al, 2012).

Chipped rubber causes larger strength losses than crumb rubber, according to several researchers (Khatib and Bayomy, 1999; Topçu and Avcular, 1997). The lowering of stress and strain concentrations in the concrete, according to Huang et al. (2013), is what causes the strength improvement when smaller sizes are employed.

Li et al. (2011) investigated the effects of tyre rubber content and rubber particle size on the mechanical performance of concrete. High rubber content and smaller tyre rubber aggregate size were shown to reduce rubberised concrete’s compressive strength and static young’s modulus. The final strain of the rubberised concrete, on the other hand, increased as the rubber content and particle size reduced.

The explanations for the rubberized concrete’s decreased compressive and flexural strength (Ganjian et al, 2009);

(a) The aggregate in the concrete mix would be surrounded by the cement paste containing rubber particles. This leads to a cement paste that will be softer compared to cement paste without rubber particles. When loaded, there will be rapid development of cracks around the rubber particles and this leads to quick failure of specimens.
(b) There will be no proper bonding between rubber particles and cement paste, as compared to cement paste and natural aggregate. This can lead to cracks due to non-uniform distribution of applied stresses.
(c) The compressive strength depends on the physical and mechanical properties of the constituent materials. If part of the materials is replaced by rubber, a reduction in strength will occur.
(d) Due to the low specific gravity of rubber and lack of bonding of rubber with other concrete ingredients, there is a tendency for rubber to move upwards during vibration leading to higher rubber concentration at the top layer. Such a non-homogeneous concrete sample leads to reduced strengths.

Summarily, when tyre rubber aggregate content and rubber aggregate size increased, the mechanical properties of concrete reduced. Different studies by several researchers corroborated these findings. As a result, most studies recommend a maximum rubber content of no more than 20% total aggregate volume and a size no larger than crumb rubber size in terms of rubber content and size. The soft rubber was thought to act as air gaps inside the concrete matrix, providing minimal resistance to loads and causing the particles to become weak spots within the concrete matrix.

References

[1] Elchalakani M. (2015): High strength rubberized concrete containing silica fume for the construction of sustainable road side barriers, Structures (1):20–38
[2] Ganjian E, Morteza K, Ali AM. (2009): Scrap-tire-rubber replacement for aggregate and filler in concrete. Constr Build Mater 2009(23):1828–36.
[3] Khatib Z. K., Bayomy F. M. (1999): Rubberized Portland Cement Concrete, J. Mater. Civ. Eng., 11(3):206–213
[4] Kotresh K.M., and Mesfin G. B. (2014): Study on Waste Tyre Rubber as Concrete Aggregates. International Journal of Scientific Engineering and Technology 3(4): 433-436
[5] Li L. J., Xie W. F., Liu F., Guo Y. C., Deng J. (2011): Fire performance of high-strength concrete reinforced with recycled rubber particles, Mag. Concr. Res., 63(3):187–195
[6] Muyen Z., Mahmud F., and Hoque M. N. (2019): Application of waste tyre rubber chips as coarse aggregate in concrete. Progressive Agriculture 30 (3): 328-334
[7] Panda K. C., Parhi P. S., Jena T. (2012): Scrap-Tyre Rubber Replacement for Aggregate in Cement Concrete: Experimental Study, Int. J. Earth Sci. Eng., 5(6):1692–1701
[8] Sofi A. (2018): Effect of waste tyre rubber on mechanical and durability properties of concrete – A review. Shams Engineering Journal 9 (2018):2691–2700 https://doi.org/10.1016/j.asej.2017.08.007
[9] Su H, Yang J, Ling TC, Ghataora GS, Dirar S. (2015): Properties of concrete prepared with waste tyre rubber particles of uniform and varying sizes. J. Clean. Prod. 2015(91):288–96.
[10] Thomas BS, Gupta RC, Mehra P, Kumar S. (2015): Performance of high strength rubberized concrete in aggressive environment. Constr. Build. Mater. 2015(83):320–6.
[11] Topçu I. B., Avcular N. (1997): Analysis of rubberized concrete as a composite material, Cem. Concr. Res., 27(8):1135–1139
[12] Zheng L., Huo X. S., Yuan Y. (2008): Strength, Modulus of Elasticity, and Brittleness Index of Rubberised Concrete, J. Mater. Civ. Eng., 20, 11 (2008)

Geotextiles: Design, and Applications in Civil Engineering

Geotextiles are permeable geosynthetic fabrics (textiles) that can separate, filter, reinforce, protect, or drain when used in conjunction with soil. As the use of geotextile fabrics has grown, so has the creation of geotextile composites and products like geogrids and meshes. Geotextiles and associated materials/products are the umbrella term for these materials. Roads, airfields, railroads, embankments, retaining structures, reservoirs, canals, dams, bank protection, and coastal engineering are among the many civil engineering applications where they are beneficially used.

Geotextiles are employed as an integral part of a human-made project, structure, or system with foundation soil, rock, earth, or any other geotechnical engineering-related material. AASHTO (M288-96) specifies geotextile strength standards in the United States of America. In Europe, EN 13249:2016 specifies the relevant characteristics of geotextiles and geotextile-related products used in the construction of roads and other trafficked areas (excluding railways and asphaltic inclusion), and the appropriate test methods to determine these characteristics. According to EN 13249:2016, the intended use of these geotextiles or geotextile-related products is to fulfill one or more of the following functions: filtration, separation, and reinforcement. The separation function will always occur in conjunction with filtration or reinforcement, and hence will not be specified alone.

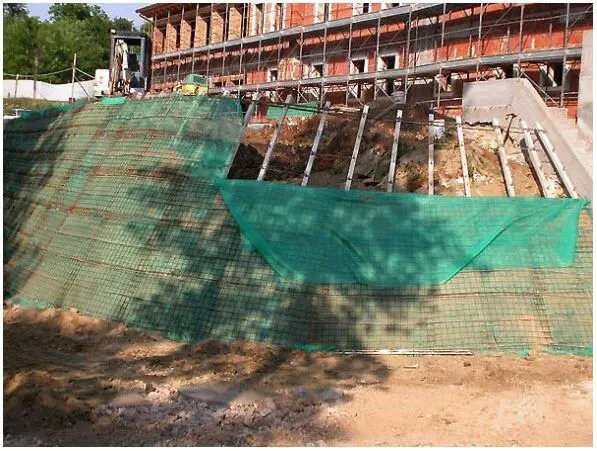
Geotextiles in erosion control works and embankment protection
Figure 1: Erosion protection using geotextile (Van Baars, 2016)
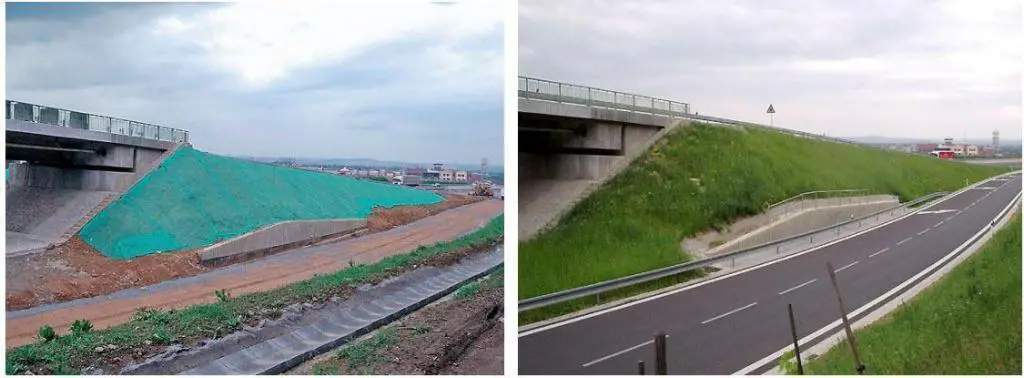
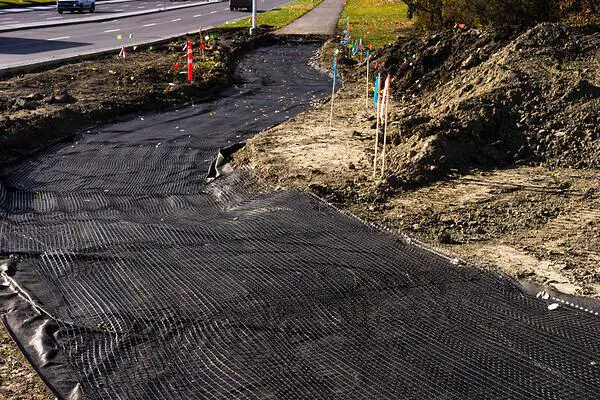
geotextile in road construction
Figure 2: Geotextiles in highway construction

Geotextile tensile strength varies depending on the geotextile designation and the design requirements. A woven slitfilm polypropylene (weighing 240 g/m2), for example, has a strength range of 30 to 50 kN/m. The angle of friction between soil and geotextiles varies depending on the geotextile and the soil. For design purposes, it is usually necessary to apply reduction factors to the laboratory tensile strength of geotextiles in order to suit site conditions.

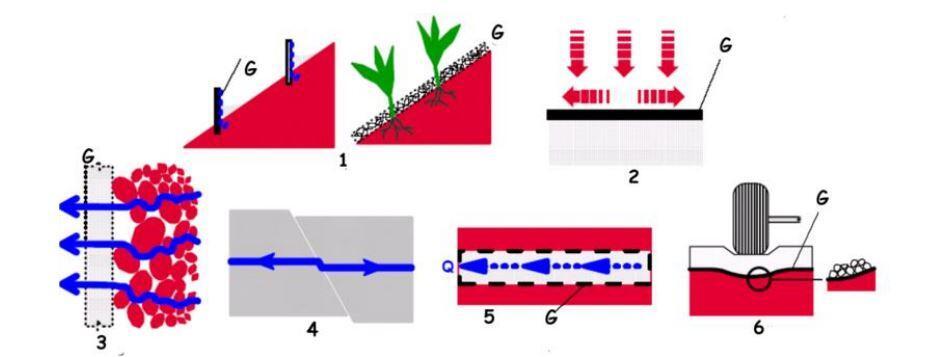
The different functions of geotextiles in soils are:

  1. Erosion protection
  2. Sealing
  3. Filtering
  4. Reinforcing
  5. Drainage
  6. Separation
different ways of using
Figure 3: Six different functions of geotextiles (Van Baars, 2016)

Geomembranes are impervious membranes that are frequently utilized as cut-offs and liners. Geomembranes were mostly utilized as canal and pond liners until recently; nevertheless, one of the most common current uses is the containment of hazardous or municipal wastes and their leachates. Geotextile or mesh underliners are used in many of these applications to support or protect the more flexible geomembrane while also functioning as an escape route for gases and leachates generated in specific wastes.

Construction of Reinforced Earth Structures using Geotextiles

Reinforced earth is a construction material made up of soil fill that has been strengthened by the addition of rods, bars, fibers, or nets that provide frictional resistance to the soil. The idea of using rods or fibers to reinforce soil is not new. Thin metal strips, geotextiles, and geogrids are currently used as reinforcing materials in the construction of reinforced earth retaining walls. The three components of a mechanically stabilised earth wall are the facing unit, the backfill, and the reinforcing material. Modular concrete blocks, currently called segmental retaining walls are most common as facing units.

The type of facing unit and reinforcing material employed in the system usually determine the process of constructing a mechanically stabilised earth wall. The skin, also known as the facing unit, can be flexible or rigid, but it must be robust enough to hold the backfill in place and allow fastenings for the reinforcement to be connected. The facing units only need a small foundation to be built on, which usually consists of a trench filled with mass concrete that provides a footing similar to that seen in domestic housing.

Construction procedure using
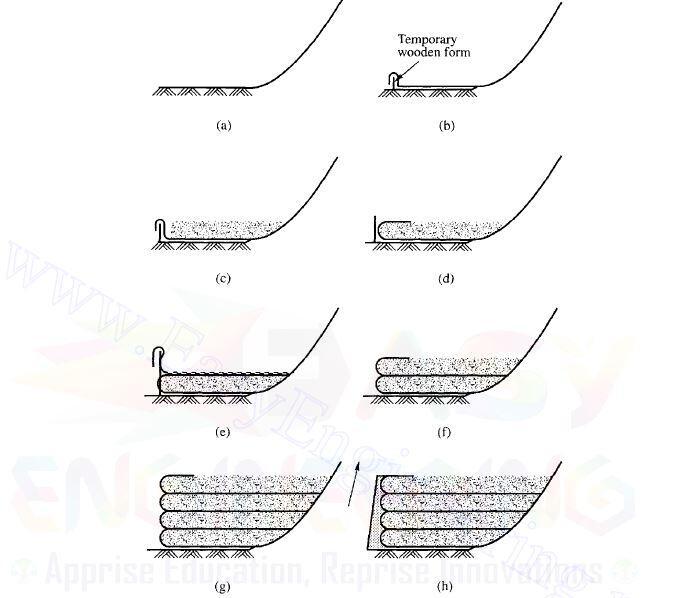
Figure 4: General construction procedures for using geotextiles in fabric wall construction (Murthy, 2009)

The construction procedure with the use of geotextiles is explained in Figure 4. Here, the geotextile serves both as a reinforcement and also as a facing unit. The procedure is described below as given by Murthy (2009) with reference to Figure 4.

  1. Start with an adequate working surface and staging area (Fig. 4(a)).
  2. Lay a geotextile sheet of proper width on the ground surface with 4 to 7 ft at the wall face draped over a temporary wooden form (b).
  3. Backfill over this sheet with soil. Granular soils or soils containing a maximum of 30% silt and /or 5% clay are customary (c).
  4. Construction equipment must work from the soil backfill and be kept off the unprotected geotextile. The spreading equipment should be a wide-tracked bulldozer that exerts little pressure against the ground on which it rests. Rolling equipment likewise should be relatively lightweight.
  5. When the first layer has been folded over the process should be repeated for the second layer with the temporary facing formwork being extended from the original ground surface or the wall being stepped back about 6 inches so that the form can be supported from the first layer. In the latter case, the support stakes must penetrate the fabric.
  6. This process is continued until the wall reaches its intended height.
  7. For protection against ultraviolet light and safety against vandalism, the faces of such walls must be protected. Both shotcrete and gunite have been used for this purpose.

Design Considerations for Mechanically Stabilised Earth Walls using Geotextiles

The design of a mechanically stabilised earth wall involves the following steps (Murthy, 2009):

  1. Check for internal stability, addressing reinforcement spacing and length.
  2. Check for external stability of the wall against overturning, sliding, and foundation failure.

The general considerations for the design are:

  1. Selection of backfill material: granular, freely draining material is normally specified. However, with the advent of geogrids, the use of cohesive soil is gaining ground.
  2. Backfill should be compacted with care in order to avoid damage to the reinforcing material.
  3. Rankine’s theory for the active state is assumed to be valid.
  4. The wall should be sufficiently flexible for the development of active conditions.
  5. Tension stresses are considered for the reinforcement outside the assumed failure zone.
  6. Wall failure will occur in one of three ways
    a. tension in reinforcements
    b. bearing capacity failure
    c. sliding of the whole wall soil system.
  7. Surcharges are allowed on the backfill. The surcharges may be permanent (such as a roadway) or temporary.
    a. Temporary surcharges within the reinforcement zone will increase the lateral pressure on the facing unit which in turn increases the tension in the reinforcements but does not contribute to reinforcement stability.
    b. Permanent surcharges within the reinforcement zone will increase the lateral pressure
    and tension in the reinforcement and will contribute additional vertical pressure for the reinforcement friction.
    c. Temporary or permanent surcharges outside the reinforcement zone contribute to lateral pressure which tends to overturn the wall.
  8. The total length L of the reinforcement goes beyond the failure plane by a length Lg. Only length Lg (effective length) is considered for computing frictional resistance. The length LR lying within the failure zone will not contribute to frictional resistance
  9. For the purpose of design, the total length L remains the same for the entire height of wall H. Designers, however, may use their discretion to curtail the length at lower levels.

References
[1] Van Baars Stefan (2016): Advanced Soil Mechanics. Edited and published by Stefan Van Baars. Edition May 2016
[2] Murthy V. N. S. (2009): Textbook of Soil Mechanics and Foundation Engineering: Geotechnical Engineering series. CBS PUBLISHERS AND DISTRIBUTORS PVT LTD

Differential Settlement of Foundations

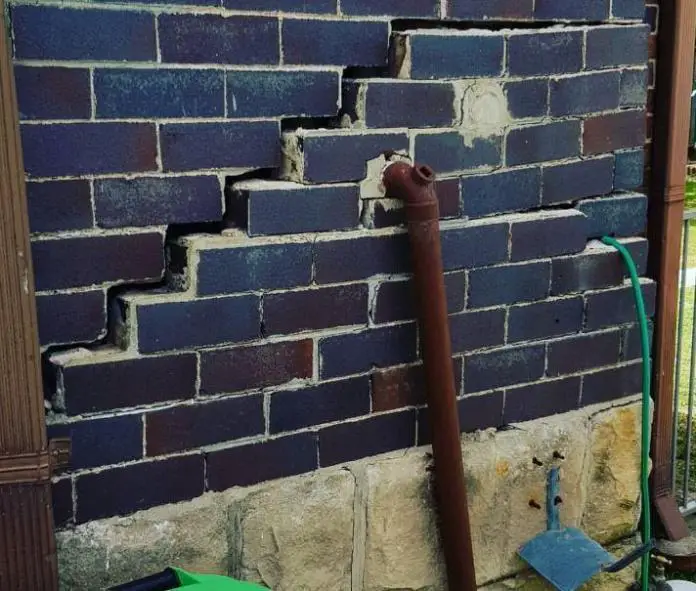
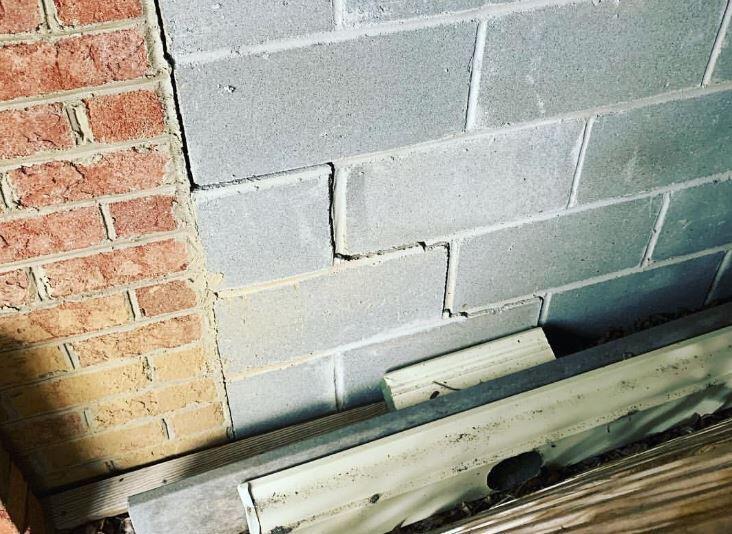
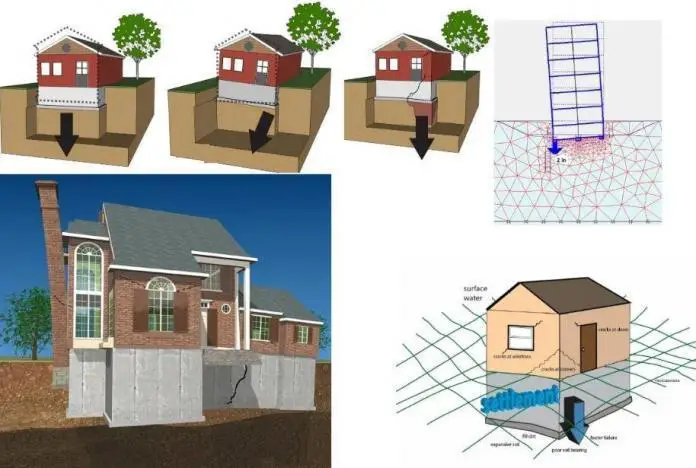
cracking of a building due to differential settlement

When there is relative movement or differential settlement between various parts of a foundation, internal stresses are developed in the structure. Differential settlement occurs when one part of a foundation settles relative to the other. When the settlement of a foundation is uniform, there are usually no structural implications. However, serious cracking, and even collapse of the structure, may occur if the differential movements are excessive.

Causes of Differential Settlement

The differential settlement between parts of a structure may occur as a result of the following;

(a) Variation in soil properties
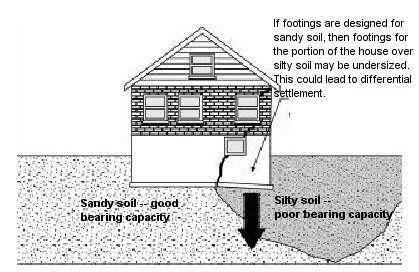
Highly compressible soil may be used to support one part of a structure and an incompressible material for the other. Such differences are typical, especially in glacial deposits, where clay lenses might be found in primarily sandy material or vice versa.

Furthermore, some parts of a structure may be built on shallow rock and others on soil or compressible weathered rock in places with uneven bedrock surfaces. Sand and gravel deposits thrown down by the wind or water can vary greatly in density both vertically and horizontally. In such cases, differential settlement may occur in the foundations of structures built on such soil deposits.

differential settlement due to non uniform soil property
Figure 1: Differential settlement due to variation in soil properties

(b) Variation in foundation loading
When the magnitude of loads coming from superstructure columns or walls vary significantly, differential settlement may occur unless special design considerations are made to prevent it. For example, in a building with a tower and wings, a differential settlement between the tower and the wings would be predicted unless special foundation design procedures were used to prevent it. Furthermore, a light superstructure might surround a very large piece of machinery in a factory building, and the area supporting the machinery may settle relative to the factory building.

(c) Large loaded area on flexible foundations
When built directly on compressible soil, the settlement of large flexible raft foundations, or big loaded regions consisting of independent foundations of a number of columns, takes on a characteristic bowl form, with the largest settlement in the centre and the minimum at the corners.

In most cases, the maximum differential settlement is around half of the entire settlement. Even while the maximum differential settlement between the centre and corners may be significant in a building made up of a large number of closely spaced equally loaded columns, the relative settlement between columns may be only a fraction of the maximum.

However, where the large loaded region is founded on a relatively incompressible stratum (e.g. dense gravel) overlying a compressible layer, settlement of the structure will occur due to consolidation of the deeper compressible layer, but it will not take the form of the bowl-shaped depression. If the dense layer is thick enough, it will produce a rigid raft, which will eliminate differential settlement to a considerable extent.

(d) Differences in time of construction
This problem happens when an extension is added to a structure several years after the original structure was completed. Although the latter’s long-term consolidation settlements may be nearly complete, the new structure (assuming the same foundation loading as the original) will eventually settle an equivalent amount. To prevent distortion and cracking between the old and new structures, special precautions in the form of vertical joints are required.
Cracking of partitions
Figure 2: Crack between two adjoining structures

(e) Variation in site condition
On a sloping site, it may be necessary to remove a significant thickness of overburden to produce a level site, or one portion of a building area may have been occupied by a heavy structure that had been demolished. Different stress conditions both before and after loading emerge from these variances, resulting in differential settlement or swelling. One part of a site may be normally consolidated, and another part overconsolidated. This will result in variation in the settlement behaviour.

Deformation of Structures and their Supporting Foundations

In a conference held in Tokyo in the year 1977, Burland et al (1977) highlighted the basic conditions that must be met when considering the limiting movements of a structure due to soil-structure interaction. The criteria stated are still very much the basis for the design of structures and foundations today. The basic criteria that must be satisfied when considering the limiting movements of a structure are;

(a) The visual appearance of the structure
(b) Serviceability or functionality of the structure
(c) Stability of the structure

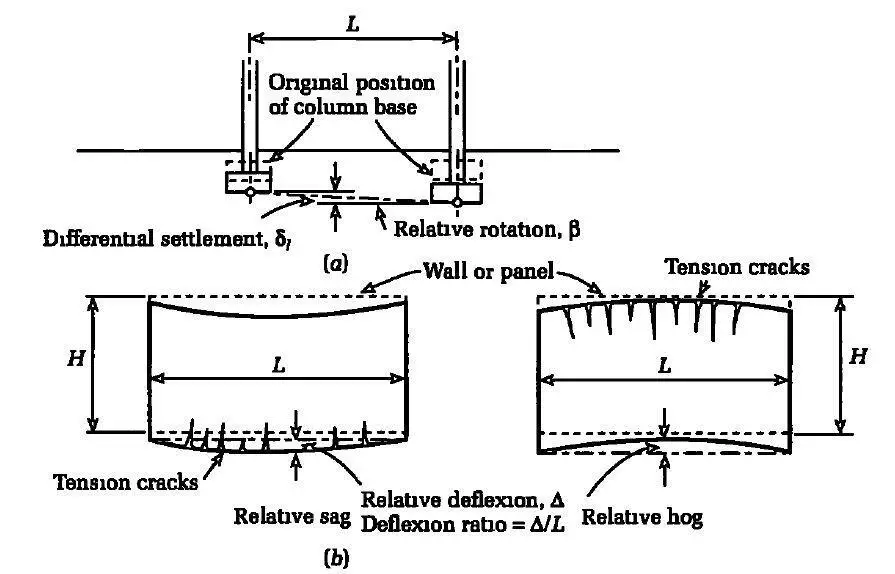
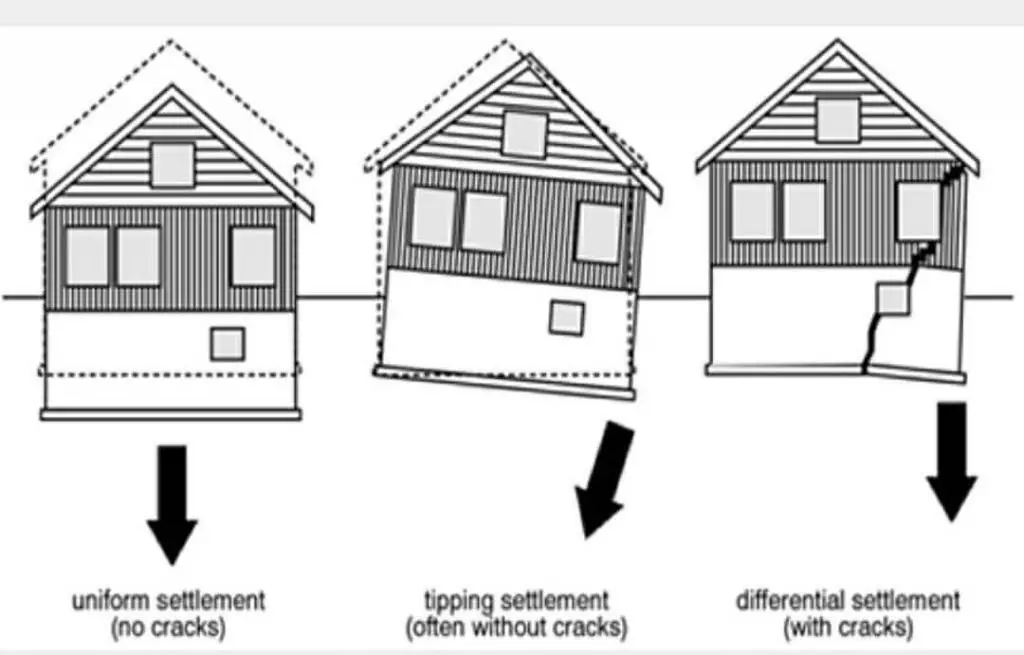
It is necessary to describe settlements and distortions in line with the established terminology presented in Figure 3 when considering the criteria above in connection to limiting movements. When looking at the visual appearance of a building, a tilt or rotation of more than 1 in 250 is likely to be visible to the human eye. A deflection ratio of more than 1 in 250 or a local rotation of horizontal components greater than 1 in 100 is likely to be very visible. The appearance of framed buildings is affected when load-bearing walls or claddings crack. At eye level, crack widths of more exceeding 3—5 mm are ugly and require repair.

Differential settlement
Figure 3: Definitions of differential settlement and distortion for framed and load-bearing wall structures (Tomlinson, 2001)

Cracking in structures can lead to loss of weather/water tightness, fire resistance, and thermal and sound insulation characteristics, thereby affecting the serviceability or functionality of the structure. Total settlement can be important to serviceability when connecting to exterior drains or other piping, while deformations can interfere with the proper operation of overhead cranes and precision gear. Relative deflections and rotations may be important for structural stability because they can produce excessive bending strains in members. Excessive tilting might cause a structure to completely collapse.

The amount of damage produced by settlement is partly determined by the order and timing of construction operations. For example, if a tall building is built on a deep clay basement, the excavation’s base will first heave to a convex shape. The foundation soil will consolidate and finally deform to a concave (bowl) shape when the superstructure is built, resulting in a full reversal of curvature of the basement and lowermost stories.

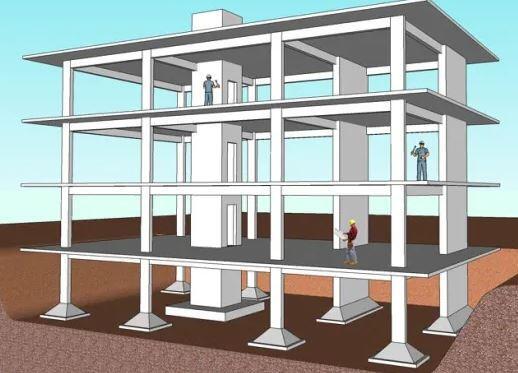
The structural frame of a multi-story housing or office building bears the major portion of the overall dead load. As a result, by the time the frame is finished, the majority of the building’s settlement will have occurred (see Figure 4). Then, at a later time, claddings or finishes will add to the structure’s rigidity and suffer far less deformation than that which has already occurred in the structural frame.

On the other hand, this will not be the case for structures like silos. The majority of the settlement in silos does not occur until the compartments are filled for the first time. The contents of the silo can weigh significantly more than the confining structure.

Typical foundation of a framed structure
Figure 4: Typical foundation of a framed structure

Empirical standards for restricting the movement of structures have been established in order to prevent or reduce cracking and other forms of structural damage. Tables 1 and 2 show some of the criteria. Skempton and Macdonald’s (1956) criteria are consistent with the guidelines for acceptable limits in EN 1997-1:2004 (EC 7) Clause 2.4.9. Clause 2.4.8(5)P stipulates that the limiting values must be agreed upon with the structure’s designer during the design of the building. The relative rotation (or angular distortion) is the key factor for framed buildings and reinforced load-bearing walls, but the deflection ratio is the requirement for unreinforced load-bearing walls that fail by sagging or hogging, as illustrated in Figure 3.

Table 1: Criteria for limiting values for relative rotation (Tomlinson, 2001)

Type of damageLimiting values for relative rotation (angular distortion)
Skempton and MacDonald (1956)
Limiting values for relative rotation (angular distortion)
Meyerhof (1947)
Structural Damage1/1501/250
Cracking in walls and partitions1/300 (but 1/500 recommended)1/500

Table 2: Criteria for limiting values for deflection ratio (∆/L) (Tomlinson, 2001)

Type of damageLimiting values for deflection ratio (∆/L)
Meyerhof (1947)
Limiting values for deflection ratio (∆/L)
Burland and Wroth (1974)
Cracking by sagging0.4 × 10-3At L/H = 1: 0.4 × 10⁻³
At L/H = 5: 0.8 × 10⁻³
Cracking by hoggingAt L/H = 1: 0.2 × 10⁻³
At L/H = 5: 0.4 × 10⁻³

Methods of Avoiding or Accommodating Excessive Differential Settlement

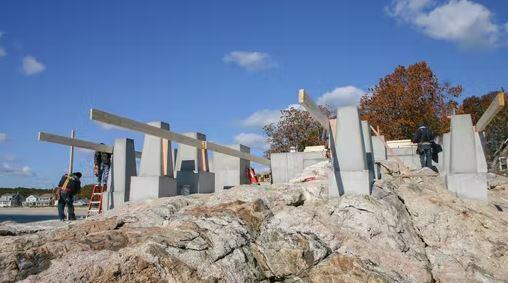
Differential settlement does not have to be taken into account only when structures are to be built on relatively incompressible bedrock. When structures are built on weathered rocks or soils, an estimate of total and differential settlements must be made to determine whether the movements are likely to be tolerated by the structure’s design, or whether they are large enough to necessitate special measures to avoid or accommodate them. The Institution of Structural Engineers (1989), in a report, provides general recommendations on how to approach this study.

Foundation on rock
Figure 5: Differential settlement may be ignored for foundations on rocks

It is impractical to design foundations to be completely free of cracks caused by differential settlement. This is because temperature and moisture movements in the structure also cause cracking in walls and ceilings in most buildings with internal plaster finishes. Therefore a certain degree of readily repairable cracking owing to differential settlement should be permitted (Tomlinson, 2001). The risks of damage due to settlement can be calculated using empirical principles based on experience in the case of simple structures on generally uniform compressible soils.
Foundations on Sand

The differential settlement for foundations on sand is unlikely to exceed 75% of maximum movement, and since most conventional structures can withstand 20 mm of settlement between adjacent columns, a limiting maximum settlement of 25 mm was proposed by Tezarghi and Peck (1967).

The maximum settlement limit for raft foundations on sand is increased to 50 mm. Skempton and MacDonald (1956) concluded from a study of the movement of 11 buildings that the limiting maximum differential settlement is roughly 25 mm for a limiting angle of distortion (β) of 1 in 500, the limiting total settlement is 40 mm for pad foundations, and 40—65 mm for raft foundations.

Buildings on sands seldom settle by more than 50 mm, according to studies, and in the vast majority of cases, settlement is on the order of 25 mm or less (Sutherland, 1974). These guidelines should not be applied to sands that contain silt or clay, as these materials increase the compressibility of the sand.

Foundations on Clay

Skempton and MacDonald (1956) proposed a design limit for maximum differential settlement of 40 mm for foundations on clays, as well as design limitations for a total settlement of 65 mm for isolated foundations and 65—100 mm for rafts. If the total and differential settlements exceed the serviceability limit state as a result of applying the above empirical rules or conducting a settlement analysis of the structure based on the assumption of complete flexibility in the foundations and superstructure, the engineer has the option of either avoiding settlement or accommodating the movement through appropriate structural design measures.

If the structures themselves are not rigid enough to prevent excessive differential movement with regular spread foundations, one or more of the procedures listed below may be used to limit total and differential settlements to a tolerable level.

(a) Provision of a rigid raft foundation in two or three directions
(b) Provision of deep basements to reduce net bearing pressure on the soil
(c) Transference of foundation loading to deeper and less compressible soil via basements, piers, or piles
(d) Provision of jacking pockets, or brackets, in columns to relevel the superstructure
(e) Provision of additional loading on lightly loaded areas in the form of kentledge or embankments to even out soil pressure distribution

Method (b) is effective in minimizing excessive differential settlement between components of a structure with differing foundation loads, as well as reducing maximum settlements owing to the relief of overburden pressure and excavating for deep basements. As a result, the deepest basements can be given under the structure’s heaviest components, while shallower or no basements can be provided in places with lighter loading.

References

[1] Burland J. B., Broms B. B. and De Mello V. (1977): Behaviour of foundations and structures, in Proceedings of the 9th International Conference on Soil Mechanics, Tokyo, Session 2, 1977
[2] Burland J. B. and Wroth C. P. (1974): Review paper Settlement of buildings and associated damage, in Proceedings of the Conference on Settlement of Structures, Pentech Press, Cambridge, pp 611—654, 1974
[3] Institution of Structural Engineers (1989): Structure—Soil Interaction — The Real Behaviour of Structures, Institution of Structural Engineers, London, 1989
[4] Meyerhof G. G. (1947): The settlement analysis of building frames, Structural Engineer, 25, 309,
[5] Skempton A. W. and MacDonald D. H. (1956):, The allowable settlement of buildings, Proceedings of the Institution of Civil Engineers, 3(5):727—784
[6] Sutherland H. B. (1974) Review paper Granular materials, in Proceedings of the Conference on Settlement of Structures, Pentech Press, Cambridge, pp 473—499, 1974
[7] Terzaghi K. and Peck R. B. (1967): Soil Mechanics in Engineering Practice, 2nd edn, John Wiley, New York, 1967
Tomlinson M. J. (2001): Foundation Design and Construction (7th Edition). Pearson Education Ltd UK

Partial Replacement of Sand with Waste Glass in Concrete Production

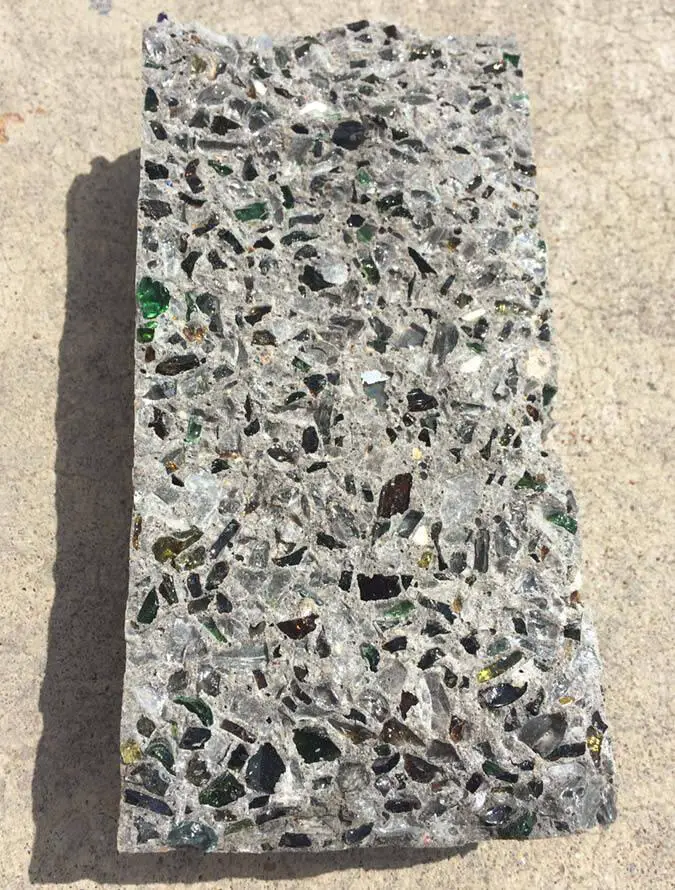
Crushed waste glass

Glass is a transparent or translucent material that is used in the production of materials like sheet glass and container glass. It is manufactured by rapidly cooling molten components like silica sand to prevent the creation of visible crystals. Glass is an excellent material for recycling, and its applications, including concrete manufacturing, reduce the embodied energy in concrete production (Gautam et al, 2012). The use of waste glass in concrete production is still uncommon due to the alkali-silica reaction (ASR), which reduces concrete durability and strength (Lui, 2011).

Waste glass aggregate is angular in shape and has a smooth feel. It is tough, but also fragile and brittle (Chen et al, 2006; Taha and Nounu, 2008). Recycling waste glass and turning it into fine aggregate for concrete production reduces landfill space and the demand for natural raw materials in the construction sector (Rakshvir and Barai, 2006). In a study by Ibrahim (2017), it was discovered that waste glass may replace sand up to 40% by weight without affecting the tensile and compressive strengths when compared to control concrete. He observed that 15% partial replacement was the optimum dosage.

Waste glass in concrete

To address the cement/concrete industry’s environmental and economic challenges, Malik et al. (2013) used waste glass as a partial replacement for fine aggregates (sand) in concrete. Several samples were made by replacing sand with glass contents of 10%, 20%, 30%, and 40% by weight in M-25 grade concrete. The samples were tested for compressibility, splitting tensile strength, and density 28 days after curing. The experiment’s findings were compared to those of conventional concrete. Specimens containing crushed waste glass had higher compressive strength for particle sizes of 0.1 – 1.18 mm, with up to 30% weight replacement of small aggregates. Specimens made of glass were also shown to be more cost-effective and environmentally friendly.

Ramana and Samdani (2013) studied the effects of replacing fine sand aggregates with waste glass in the ranges of 0%, 5%, 10%, 15%, 20%, 25%, and 30%. The research work investigated compressive strength, split tensile strength, and flexural strength, among other mechanical properties. The results of the laboratory tests were recorded and compared to traditional concrete results. The results showed that mechanical properties improved when fine aggregates were replaced with crushed glass at 15% but reduced when fine aggregates were replaced at a rate of 30%.

Dabiri et al. (2018) assessed the effects on compressive strength and, more importantly, the effects on the weight of the concrete by replacing fine aggregates with waste glass particles. 27 cube samples were produced to achieve the objectives, with 6 specimens produced of normal concrete and the rest incorporating glass particles mixed in varying amounts. Micro-silica was added to the glass cubes to prevent the Alkali-Silica reaction (ASR). According to the results of the testing, replacing aggregates with glass particles increased the compressive strength by more than 30%. The weight of the concrete was observed to be nearly constant for the most part. The optimum proportion for replacing aggregates with waste glass particles, according to the research, is 50%.

Ganiron et al. (2014) conducted an experimental study to discover a substitute for coarse aggregates in concrete mixtures. In the study, crushed glass bottles were utilised in place of coarse aggregates, and the influence on the mixture’s physical and mechanical properties was observed. The results of the testing showed that replacing coarse aggregates with recycled glass bottles up to 10% by weight and adding 5% by weight to the concrete mix produced acceptable compressive strength values. In the experiment, it was shown that recycled glass bottles may effectively replace coarse aggregates.

Turgut and Yahlizde (2009) studied and compared the physical and mechanical properties of concrete cubes by substituting varying degrees of fine glass (FG) and coarse glass (CG) in the concrete mixture. The values of several parameters including compressive strength, flexural strength, splitting tensile strength, and abrasion resistance of the samples were measured and observed at a 20% FG replacement. The results showed that compressive strength, flexural strength, splitting tensile strength, and abrasion resistance were 69%, 90%, 47%, and 15% respectively greater than the typical concrete sample. According to the findings, at a 20% replacement level by weight of FG, the alkali-silica reaction (ASR) in concrete is reduced.

waste glass into concrete
Waste glass in concrete

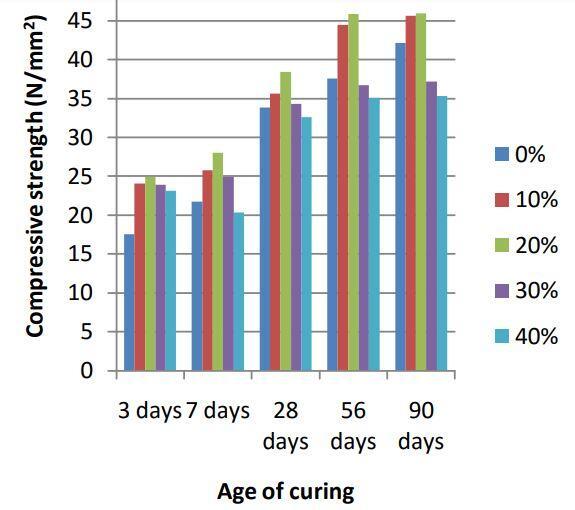
Kavyateja et al. (2016) studied the use of crushed glass as a substitute for fine aggregates in concrete production. The control mix proportion of 1:1.5:3 was batched by volume with a water/cement ratio of 0.5. The replacement rates in the samples ranged from 0% to 40%, with a 10% difference between the two. To study the variation in their compressive strength, concrete cube samples of 150mm x 150mm x 150mm were cast and tested after 3 days, 7 days, 28 days, 56 days, and 90 days. According to the experimental data, the compressive strength increases up to a 20% substitution dosage, then drops at 30% and 40% substitution dosage. The split tensile strength test also demonstrated that the split tensile strength reduces as the glass content increases.

Compressive strength
Compressive strength for different ages by using different percentages of crushed glass as sand in concrete (Kavyateja et al., 2016).

Jain et al (2020) investigated the possibility of utilizing solid waste, such as granite powder from the granite industry, and wasted soda-lime glass powder from waste glass bottles, in concrete production. The durability of blended concrete mixes using waste glass powder and granite powder at various replacement amounts was investigated in the research work. Glass powder (GP) was added to the concrete mixes in amounts of 5%, 10%, 15%, 20%, 25%, and granite powder (GrP) in amounts of 10%, 20%, 30%, 40%, and 50%, respectively, as a partial replacement for cement and sand.

Water absorption, water permeability, acid attack, sulphate attack, and a quick chloride penetration test (RCPT) were used to assess the durability of a series of blended mixes. Microstructure investigation was done using a scanning electron microscope (SEM) and X-ray diffraction (XRD). The durability properties of concrete containing 15% GP and 30% GrP in place of cement and sand, respectively, showed a considerable increase. The results show that glass granite blended concrete has improved water permeability and absorption. The response of the blended mix to sulphate and acid attack was significantly better than that of the control concrete mix.

Ibrahim (2020) utilized waste glass as a partial replacement for coarse aggregate, with ratios of 0%, 5%, 10%, 15%, 20%, 25%, 30%, 35%, 40%, 45%, and 50% by weight. At both the hardened and fresh stages, some mechanical and other properties of concrete were investigated. The results from the study showed that when waste glass was used as a partial replacement for coarse aggregate, it caused a reduction in the slump, density, and water absorption of the concrete. However, it improved the concrete’s tensile and compressive strengths until a 25% weight substitution ratio was reached. According to the results of the tests, when the waste content increases, the strengths gradually increase up to a certain point, after which they gradually decline. The highest level of influence was a 25% substitution ratio.

According to studies published in multiple papers, waste glass and glass powder have all been effectively employed as partial replacements for fine and coarse aggregates in concrete. Waste glass particles can improve concrete’s compressive strength, flexural strength, workability, and tensile strength, according to the findings. By replacing fine aggregates with glass powder in a 20% ratio by weight, the highest compressive strength can be achieved. The addition of waste glass particles in concrete has also shown to be more cost-effective and environmentally friendly than ordinary concrete.

References

[1] Chen C. H., Huang R, Wu J. K., and Yang C. C. (2006): Waste E-glass particles used in cementitious mixtures. Cement and Concrete Res 36(3):449–56
[2] Dabiri H., Sharbatdar M. K., Kavyani A. and Baghdadi M. (2018): The Influence of Replacing Sand with Waste Glass Particle on the Physical and Mechanical Parameters of Concrete. Civil Engineering Journal 2018 (4):1646-1652
[3] Ganiron T. U. (2014): The Effect of Waste Glass Bottles as an Alternative Coarse Aggregates in Concrete Mixture. International Journal of ICT-aided Architecture and Civil Engineering 2014 (02):1-10
[4] Gautam S. P.,  Srivastava V. and V.C. Agarwal V. C. (2012):  Use of glass wastes as fine aggregate in concrete. J. Acad. Indus. Res. 1(6):320-322
[5] Liu M. (2011):  Incorporating ground glass in self-compacting concrete. Construction and Building Materials 25 (2): 919-925 https://doi.org/10.1016/j.conbuildmat.2010.06.092
[6] Ibrahim K. I. M (2017): The Effect of Using Waste Glass [WG] as Partial Replacement of sand on Concrete. IOSR Journal of Mechanical and Civil Engineering (IOSR-JMCE) 14(2):41-45
[7] Ibrahim KIM (2020): Recycled Waste Glass [WG] in Concrete. Glob J Eng Sci. 6(1): 2020 http://dx.doi.org/10.33552/GJES.2020.06.000627
[8] Jain K. L.,Sancheti G., Lalit Kumar Gupta L. K. (2020): Durability performance of waste granite and glass powder added concrete, Construction and Building Materials, Volume 252, 2020, 119075, https://doi.org/10.1016/j.conbuildmat.2020.119075
[9] Kavyateja B. V., Reddy P. N., Mohan U. V. (2016): Study of Strength Characteristics of Crushed Glass used as Fine Aggregates in Concrete. International Journal of Research in Engineering and Technology (05):157- 160
[10] Malik M. I., Bashir M., Ahmad S., Taruq T. and Chowdhary U. (2013): Study Of Concrete Involving Use of Waste Glass as Partial Replacement of Fine Aggregates. International Organization of Scientific Research Journal of Engineering 2013 (3):08-13
[11] Taha B., and Nounu G. (2008): Properties of concrete contains mixed color waste recycled glass as sand and cement replacement. Construction and Building Materials 22(5):713–720
[12] Rakshvir M. and Barai S.V. (2006): Studies on recycled aggregates-based concrete. Waste Management & Research  24(3):225–233
[13] Ramana K.V. and Samdani S. S. (2013): Study on Influence of Crushed Waste Glass on Properties of Concrete. International Journal of Science and Research 2013 (4):1034-1039
[14] Turgut P. and Yahlizade E. S. (2009): Research into Concrete Blocks with Waste Glass. International Journal of Civil and Environmental Engineering 3(3):186-92

Settlement of Foundations

Foundation soils undergo settlement and deformation when loaded. When permissible stress methods are utilized in design, settlement due to foundation soil consolidation is usually the most essential consideration when calculating the serviceability limit state or analyzing acceptable bearing pressures. Even though ultimate limit state calculations or the application of an arbitrary safety factor to the calculated ultimate bearing capacity protects foundations from sinking due to soil shear failure, it is still necessary to investigate the likelihood of settlements before the allowable bearing pressures can be determined.

The causes of settlement of foundations, the implications of total and differential movements on the structure, techniques of calculating settlement, and foundation design to eliminate or minimize settlement will all be discussed in this article. Where (EN 1997-2:2007) EC 7 recommendations are used to compute the serviceability limit state, the partial factor γF for actions is unity for unfavorable loads and zero for favorable loads. When determining the characteristic deformation modulus or the coefficient of compressibility, the material factor γM is equal to one.

There are three parts to the settlement of a structural foundation.

The ‘immediate settlement‘ (Se) occurs as a result of elastic deformation of the soil without a change in water content during the application of the loading.
The ‘consolidation settlement‘ (Sc) occurs when the volume of the soil is reduced due to the ejection of some pore water from the soil.
Creep‘ or ‘secondary settlement‘ (Ss) occurs over a very long period of years after completing the extrusion of excess pore water. It is caused by the soil particles’ viscous resistance to compression adjustment.

The ‘immediate’ and ‘consolidation’ settlements are of a small magnitude in the case of foundations on medium-dense to thick sands and gravels. By the time the foundations are fully loaded, a large amount of the whole settlement has been accomplished. Similarly, a large share of foundation settlement on loose sands occurs as the load is applied, whereas settlement on compressible clays is a mixture of immediate and long-term movements. The latter is more likely to account for the majority of the movement and could take many years to complete.

EC 7 defines immediate settlement as “settlement without drainage for fully saturated soil due to shear deformation at constant volume.” EC 7 emphasizes the importance of considering foundation settlement due to reasons other than normal soil compression and consolidation. Some of them are groundwater level variations, effects of animals and vegetation, earthquakes, subsidence, etc.

Settlement of foundations is not only limited to very massive and heavy constructions. Under light loadings, considerable settlement can occur in soft and compressible silts and clays. According to Tomlinson (2001), settlement and cracking happened in two-storey homes built on soft silty clay in Scotland. The foundation loading was probably not more than 32 kN/m run of wall in the dwellings, which were made of precast concrete blocks. Differential settlement and cracking of the blocks of houses were so severe in less than three years after completion that a number of the dwellings had to be evacuated. A relative displacement of 100 mm along the wall was observed in one block.

Settlement of Foundations

The amount of the differential or relative settlement between one portion of a structure and another is more important to the superstructure’s stability than the magnitude of the total settlement. Only in relation to adjacent works is the latter significant. A flood wall to a flyer, for example, might be built to a crest level at a set height above the maximum flood level. Excessive wall settlement over a lengthy period of time could result in the wall overtopping during flood events. There is no influence on the superstructure if the entire foundation area of a structure settles to the same degree.

If there is relative movement between distinct elements of the foundation, however, stresses in the structure are created. If the differential movements are extreme, serious cracking and even collapse of the structure may ensue.

References
Tomlinson M. J. (2001): Foundation Design and Construction (7th Edition). Pearson Education

Effect of Slope on Bearing Capacity

In some cases, the foundation of buildings may be founded on or very close to natural or man-made earth slopes. The bearing capacity of shallow foundations on slopes is reduced because the full formation of shear zones under ultimate loading conditions is not possible on the sides close to the slopes or edges. This is due to the fact that the zones of plastic flow in the soil on the slope side are smaller than those in a similar foundation on level ground, thereby resulting in a lower ultimate bearing capacity.

Meyerhof (1957) extended his bearing capacity theory to account for the effect of slope on the bearing capacity of foundations. Many other recent research works have been conducted on the effect of slope on bearing capacity using finite element modelling (Acharyya and Dey, 2017; Chakraboty and Kumar, 2013) and energy dissipation methods (Yang et al, 2007).

Effect of slope on bearing capacity
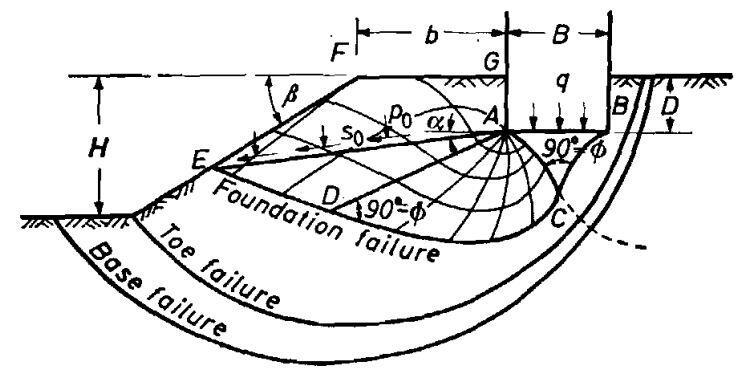
Figure 1: 4 Plastic zones and slip surfaces near rough strip foundation on top of slope (Meyerhof, 1957)

Figure 1 shows a section of a foundation with the failure surfaces under ultimate loading conditions. The distance b between the top edge of the slope and the foundation face determines the foundation’s stability. For a strip footing, the ultimate bearing capacity equation can be written as:

q = CNcq + 0.5γBNγq —– (1) (Meyerhof, 1957)

where γ = unit weight of soil, B = width of foundation, and Ncq and Nγq = resultant bearing capacity factors depending on the angle of inclination of the slope (β), angle of shearing resistance of the soil (ϕ), and the depth/width ratio D/B of the foundation.

The bearing capacity factors decrease with a greater inclination of the slope to a minimum for β = 90 degrees on purely cohesive material, and β = ϕ on cohesionless soil, when the slope becomes unstable. Because the bearing capacity of cohesionless soils is found to decrease approximately parabolically with an increase in slope angle, the decrease in bearing capacity is small in the case of clays but can be significant in the case of sands and gravels for inclinations of slopes used in practice (β < 30 degrees).

A solution of the slope stability has been obtained for a surcharge across the full horizontal top surface of a slope using dimensionless parameters called the stability number Ns, written as given in Equation (2);

Ns = c/γH —– (2)

Where c is the cohesion of the soil, γ is the unit weight of the soil, and H is the vertical height of the slope.

Eq. (3) represents the bearing capacity of a foundation on purely cohesive soil of great depth;

q = CNcq + γDf —— (3)

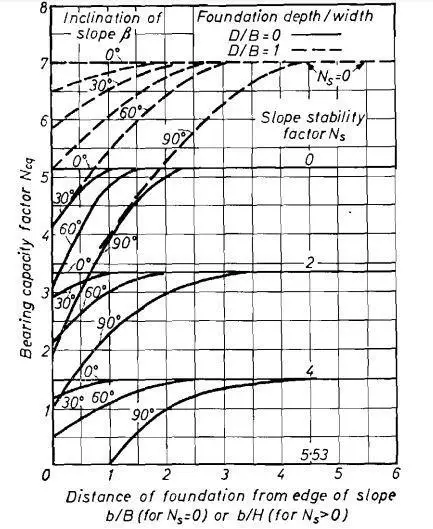
where the Ncq factor depends on b as well as β, and the stability number Ns. This bearing capacity factor decreases significantly with increasing height and to a lesser amount with increasing slope inclination, as shown in the lower regions of Figure 2. The bearing capacity factor increases with an increase in b for a given height and slope angle, and beyond a distance of about 2 to 4 times the height of the slope, the bearing capacity is independent of the slope angle.

These bearing capacity factors are given in Figures 2 and 3 for strip foundation in purely cohesive and cohesionless soils respectively.

S1
Figure 2: Bearing capacity factors for strip foundation on top of slope of purely cohesive material (Meyerhof, 1957)
s4
Figure 3: Bearing capacity factors for strip foundation on top of slope of cohesionless material (Meyerhof, 1957)

The bearing capacity factors increase with an increase in distance b. Beyond a distance of about 2 to 6 times the foundation width B, the bearing capacity is independent of the slope’s inclination and becomes the same as that of a foundation on a level surface.

References

[1] Acharyya R. and Dey A. (2017): Finite Element Investigation of the Bearing Capacity of Square Footings Resting on Sloping Ground. INAE Lett (2017) 2:97–105 DOI 10.1007/s41403-017-0028-6
[2] Debarghya Chakraborty & Jyant Kumar (2013) Bearing capacity of foundations on slopes, Geomechanics and Geoengineering, 8:4, 274-285, DOI: 10.1080/17486025.2013.770172
[3] Meyerhof G. G. (1957): The ultimate bearing capacity of foundations on slopes. The Proceedings of the Fourth International Conference on Soil Mechanics and Foundation Engineering, London, August 1957
[4] Yang, Xl., Wang, Zb., Zou, Jf. et al. (2007): Bearing capacity of foundation on slope determined by energy dissipation method and model experiments. J Cent. South Univ. Technol. 14, 125–128 (2007). https://doi.org/10.1007/s11771-007-0025-0

Cone Penetration Test (CPT) in Geotechnical Engineering

The cone penetration test (CPT), often called the Dutch cone penetration test, is a versatile sounding method for determining the materials in a soil profile and estimating their engineering properties. This test is also known as the static penetration test, and it can be performed without the use of boreholes. In the original form of the test, a 60° cone with a 10 cm2 base area is pushed into the ground at a steady rate of around 20 mm/sec, and the resistance to penetration (called the point resistance) was measured.

The test’s results from cone penetration test can also be used to determine the soil’s bearing capacity at various depths below ground level. This test can also be used to determine the skin friction values that are used to establish the needed pile lengths in a given condition, in addition to bearing capacity values.

The current cone penetrometers used in the field of geotechnical engineering measure;

(a) the cone resistance to penetration, qc, which is equal to the vertical force applied to the cone divided by its horizontally projected area; and
(b) the frictional resistance, fc, which is measured by a sleeve located above the cone with the local soil surrounding it. The frictional resistance is calculated by dividing the vertical force applied to the sleeve by the surface area of the sleeve—in other words, the sum of friction and adhesion.
(c) Pore water pressure

To measure qc and fc, two types of penetrometers are commonly used:

(a) Mechanical friction-cone penetrometer
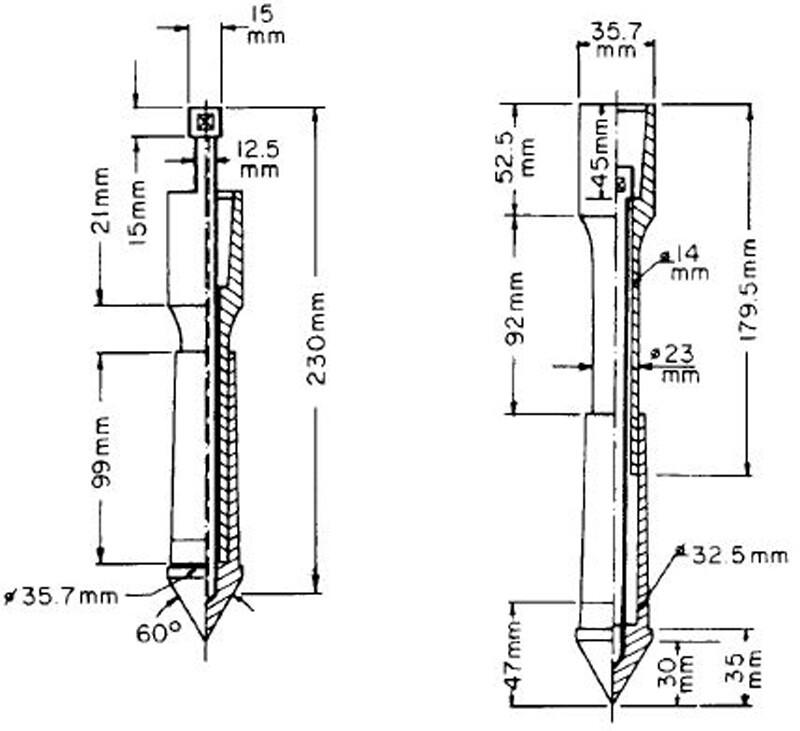
The penetrometer tip is attached to an inner set of rods in this case as shown in Figure 1. The tip is advanced into the soil to a depth of about 40 mm at first, providing cone resistance. The tip engages the friction sleeve with more thrusting. The rod force is the sum of the vertical forces on the cone and sleeve as the inner rod advances. The side resistance is calculated by subtracting the force on the cone.

mechanical cone penetrometer
Figure 1: Begemann friction-cone mechanical type penetrometer (Murthy, 2002)

(b) Electric friction-cone penetrometer
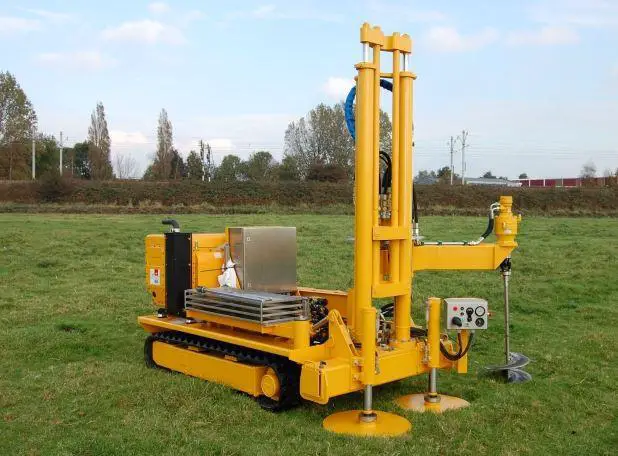
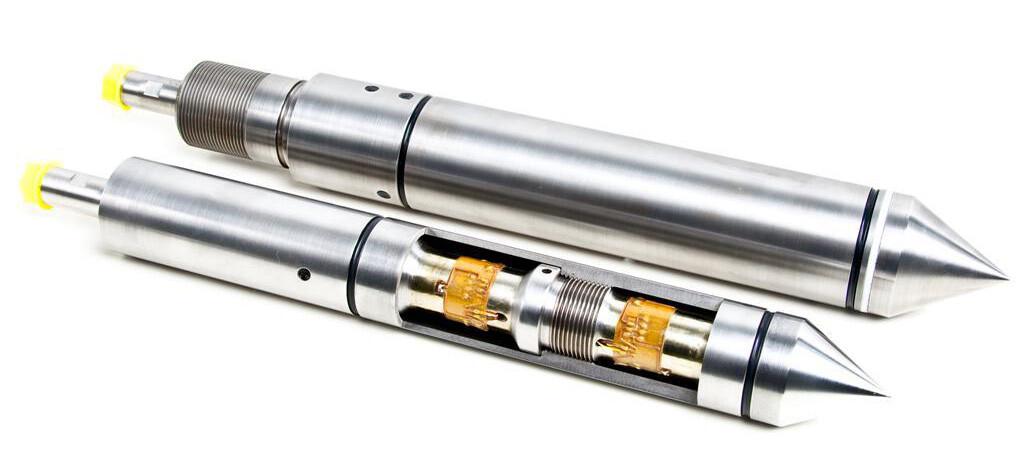
The tip is fastened to a string of steel rods in this case as shown in Figure 2. At a rate of 20 mm/sec, the tip is pushed into the soil. Wires from the transducers are threaded through the center of the rods and continuously give the cone and side resistances.

electrical cptu
Figure 2: Electric friction cone penetrometer

The static cone penetration test works best in soft or loose soils like silty sands, loose sands, layered deposits of sands, silts, and clays, as well as clayey deposits. Static cone penetration tests can be used to avoid the usage of test piles and loading tests in regions where some knowledge about the foundation strata is already available.

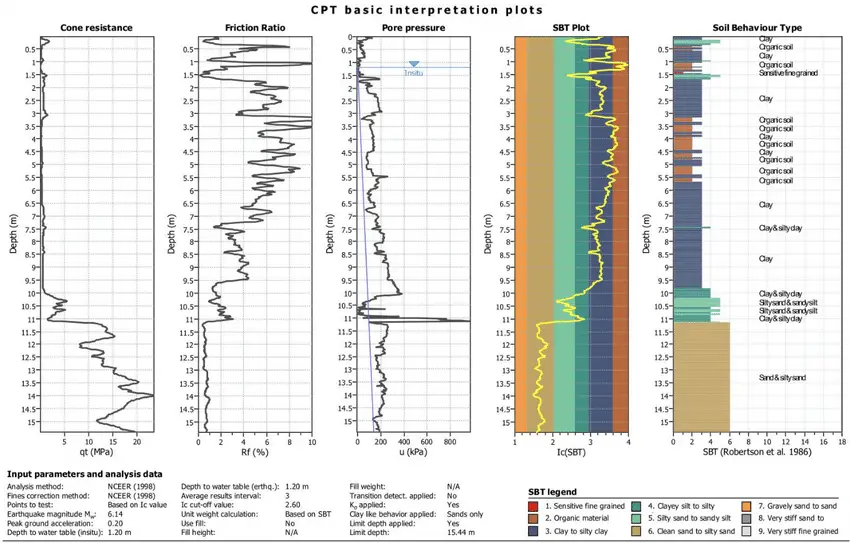
The results from a typical static cone penetration test are given in Figure 3;

Typical cone penetration test result
Figure 3: Typical Cone Penetration Test Result (Cavallaro et al, 2018)

For the cone resistance, qc, and the friction ratio, Fr, obtained from cone penetration tests, several correlations have been developed that are useful in evaluating the properties of soils encountered during an exploratory program. Fr stands for friction ratio and is defined as;

Fr = frictional resistance/cone resistance = fc/qc

In a more recent study on several soils in Greece, Anagnostopoulos et al. (2003) expressed Fr as;

Fr(%) = 1.45 – 1.36 logD50 (electric cone)
and
Fr(%) = 0.7811 – 1.611 logD50 (mechanical cone)

where D50 is size through which 50% of soil will pass through (mm). The D50 for soils on which the equations are based have been developed ranged from 0.001 mm to about 10 mm.

Soil classification based on friction ratio Fr was proposed by Sanglerat, (1972) and shown in the Table below;

Fr (%)Soil classification
0 – 0.5Loose gravel fill
0.5 – 2.0 Sands or gravels
2 – 5Clay sand mixtures and silts
> 5Clays, peats etc.

Correlation of Cone Penetration Test Result with Engineering Properties of Soil

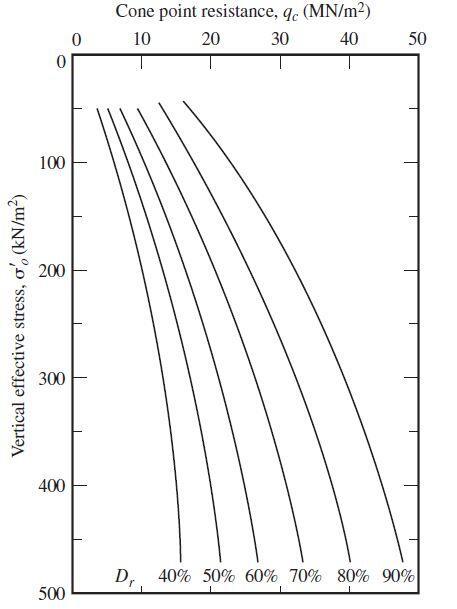
The relative density of normally consolidated sand, Dr, and qc can be correlated according to the formula;
Dr (%) = 68[log(qc/√Poσ’o) – 1]

where;
Po = atmospheric pressure
σ’o = vertical effective stress

The variation of Dr, σ’o, qc for normally consolidated quartz sand is shown in Figure 4;

Variation
Figure 4: Relationship between relative density Dr and penetration resistance qc for uncemented quartz sands (Robertson and Campanella, 1983)

Correlation between qc and Drained Friction Angle (ϕ’) for Sand
On the basis of experimental results, Robertson and Campanella (1983) suggested the variation of qc, ϕ’, and σ’o for normally consolidated quartz sand. This relationship was expressed in (Kulhawy and Mayne, 1990);

ϕ’ = tan-1[0.1 + 0.38 log(qc/σ’o)]

Based on the cone penetration tests on the soils in the Venice Lagoon (Italy), Ricceri et al. (2002) proposed a similar relationship for soil with classifications of ML and SP-SM as;

ϕ’ = tan-1[0.38 + 0.27 log(qc/σ’o)]

In a more recent study, Lee et al. (2004) developed a correlation between ϕ’, qc, and the horizontal effective stress (σ’h) in the form;

ϕ’ = 15.575(qc/σ’h)0.1714

Correlation between qc and Undrained Shear Strength (Cu) for Clays

The undrained shear strength, cu, can be expressed as;

cu = (qc – σ’o)/NK

where
σ’o = total vertical stress
NK = bearing capacity factor

The bearing capacity factor, NK, may vary from 11 to 19 for normally consolidated clays and may approach 25 for overconsolidated clay. According to Mayne and Kemper (1988);

NK = 15 (for electric cone)
and
NK = 20 (for mechanical cone)

Based on tests in Greece, Anagnostopoulos et al. (2003) determined;

NK = 17.2 (for electric cone)
and
NK = 18.9 (for mechanical cone)

These field tests also showed that;
cu = fc/1.26 (for mechanical cones) and
cu = fc (for electrical cones)

Correlation between qc and Ultimate Bearing Capacity

To estimate the allowable bearing capacity from cone penetration tests, a set of empirical equations developed by Schmertmann (1978) and listed below are used;

For cohesionless soils:
Strip footing: qult = 28 – 0.0052 (300 – qc)1.5 (kg/cm2)
Square footing: qult = 48 – 0.009 (300 – qc)1.5 (kg/cm2)

For clay:
Strip footing: qult = 2 + 0.28qc (kg/cm2)
Square footing: qult = 5 + 0.34qc (kg/cm2)

where:
qult = ultimate bearing capacity
qc = cone friction averaged over the depth interval from about B/2 to 1.1B below the footing base with B is the foundation’s width.

References

[1] Anagnostopoulos, A., Koukis, G., Sabatakakis, N. et al. (2003): Empirical correlations of soil parameters based on Cone Penetration Tests (CPT) for Greek soils. Geotechnical and Geological Engineering 21, 377–387 (2003). https://doi.org/10.1023/B:GEGE.0000006064.47819.1a
[2] Cavallaro, A.; Capilleri, P.P.; Grasso, S. (2018): Site Characterization by Dynamic In Situ and Laboratory Tests for Liquefaction Potential Evaluation during Emilia Romagna Earthquake. Geosciences 2018, 8, 242. https://doi.org/10.3390/geosciences8070242
[3] Kulhawy, F. H., and Mayne, P. W. (1990). Manual on Estimating Soil Properties for Foundation Design, Electric Power Research Institute, Palo Alto, CA.
[4] Lee, J., Salgado, R., and Carraro, A. H. (2004). “Stiffness Degradation and Shear Strength of Silty Sand,” Canadian Geotechnical Journal, Vol. 41, No. 5, 831–843.
[5] Mayne, P. W., and Kemper J. B. (1988). “Profiling OCR in Stiff Clays by CPT and SPT,” Geotechnical Testing Journal, ASTM, Vol. 11, No. 2, 139–147.
[6] Murthy, V.N.S. (2002). Principles and Practices of Soil Mechanics and Foundation Engineering. CRC Press, Florida
[7] Ricceri, G., Simonin, P., and Cola, S. (2002). “Applicability of Piezocone and Dilatometer to Characterize the Soils of the Venice Lagoon” Geotechnical and Geological Engineering, Vol. 20, No. 2, 89–121.
[8] Robertson, P. K., and Campanella, R. G. (1983). “Interpretation of Cone Penetration Tests. Part I: Sand,” Canadian Geotechnical Journal, Vol. 20, No. 4, 718–733.
[9] Sanglerat, G. (1972). The Penetrometer and Soil Exploration. Elsevier Publishing Co., Amsterdam
[10] Schmertmann, J.H. (1978). Guidelines for Cone Penetration Test: Performance and Design. U.S. Dept. of Transportation, Washington, D.C.


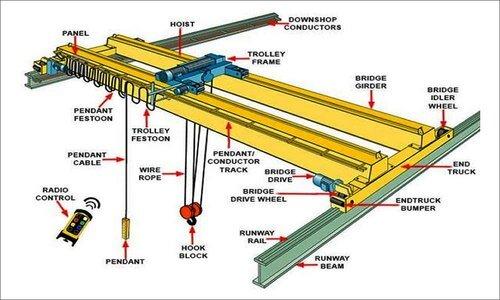
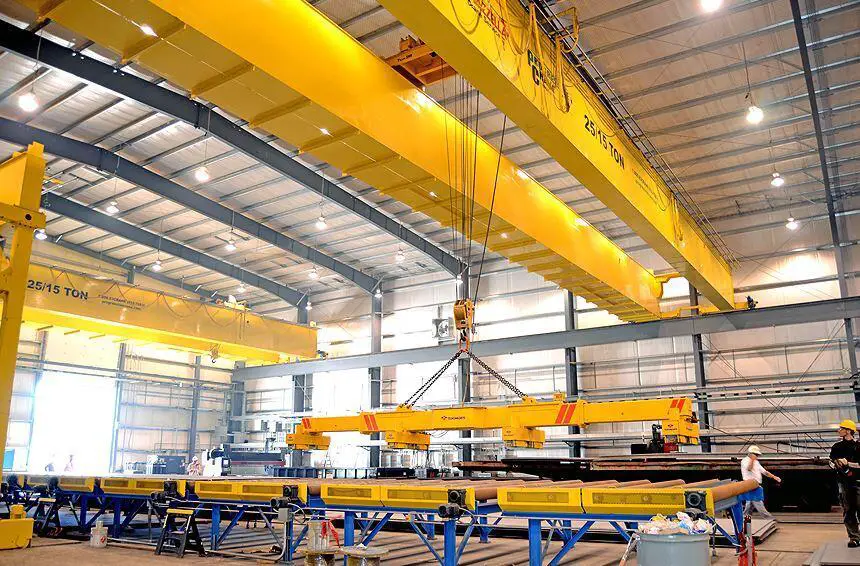
Moving Wheel Loads from Overhead Electric Travelling Cranes

When an overhead electric travelling crane is operating in a workshop or warehouse, a dynamic effect on the wheels is created as a result of a sudden drop of a full load, a slide of the sling, or a sudden braking action during the trip of a fully-loaded crane (where the load includes the crane’s self-weight). This consequently increases the static wheel load of the crane.

This effect is determined by multiplying the static wheel load by an impact factor to obtain the dynamic wheel load. Thus, maximum dynamic vertical wheel load = static wheel load × dynamic factor (ϕ).

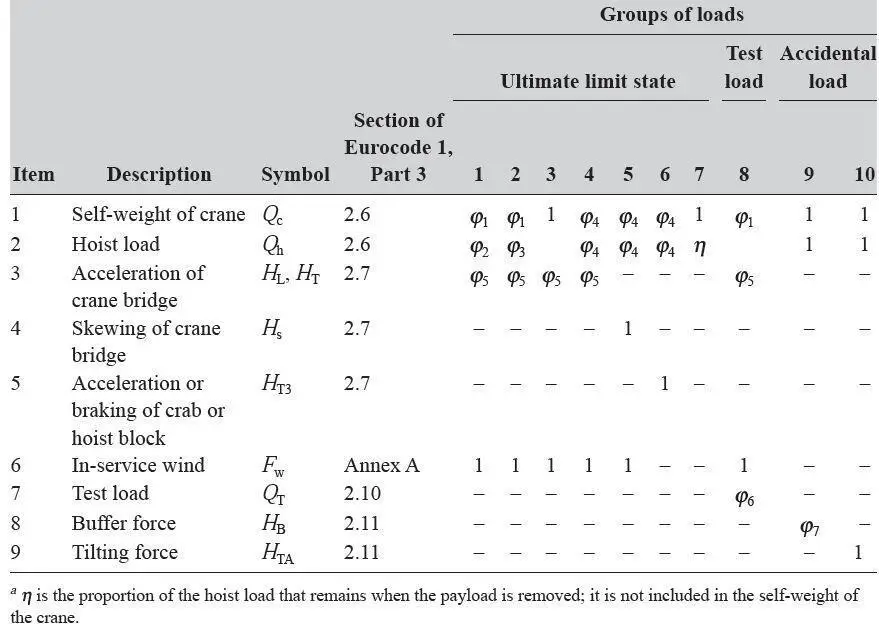
The dynamic factor varies according to the crane’s duty class (loading class). The various loading classes are listed in Table 1. Table 2 lists the loads and dynamic parameters that should be addressed as part of a single crane motion. The values of the dynamic factors ϕi should be calculated using the formulae presented in Table 3.

Table 1: Recommendations for loading classes (based on Table B.1 in Eurocode 1, Part 3)a

ItemType of craneHoisting ClassS-Class
1Hand-operated cranesHC1S0, S1
2Assembly cranesHC1, HC2S0, S1
3Powerhouse cranesHC1S1, S2
4Storage cranes with intermittent operationHC2S4
5Storage cranes and spreader bar cranes, with continuous operationHC3, HC4S6, S7
6Workshop cranesH2, H3S3, S4
7Overhead travelling cranes and ram cranes, |with grab and magnet operationHC3, HC4S6, S7
8Casting cranesHC2, HC3S6, S7
9Soaking-pit cranesHC3, HC4S7, S8
10Stripper cranes, charging cranesHC4S8, S9
11Forging cranesHC4S6, S7

Table 2: Groups of loads and dynamic factors to be considered as one characteristic crane
action (based on Table 2.2 of Eurocode 1, Part 3)a

CRANE LOADING

Table 3: Dynamic factors ϕi for vertical loads (based on Table 2.4 of Eurocode 1, Part 3)

Dynamic factor ϕiValue of dynamic factor
ϕ10.9 < ϕ1 < 1.1 The two values 1.1 and 0.9 reflect the upper and lower values of vibrational pulses
ϕ2ϕ2 = ϕ2,min + β2vh, where vh = steady hoisting speed in m/s For ϕ2,min and β2, see Table 4
ϕ3ϕ3 = 1 − △m (1 + β3)/m, where △m = released or dropped part of the hoisting mass, m = total hoisting mass, β3 = 0.5 for cranes equipped with grabs or similar slow-release devices, and β3 = 1.0 for cranes equipped with magnets or similar rapid-release devices.
ϕ4ϕ4 = 1.0 provided that the tolerances for rail tracks as specified in EN 1993-6 are observed

Table 4: Values of β2 and ϕ2,min (based on Table 2.5 of Eurocode 1, Part 3)

Hoisting class of applianceβ2ϕ2,min
HC10.171.05
HC20.341.10
HC30.511.15
HC40.681.2

Example
The vertical dynamic factors can be evaluated as follows.
For hoisting classes HC1and HC2, for example, referring to Table 3, we have the dynamic factor ϕ1 for vertical loads: 0.9 < ϕ1 < 1.1. Assume ϕ1 = 0.9, the lower value for vibrational pulses. We also have;

ϕ2 = ϕ2,min + β2vh

where ϕ2,min = 1.05 and β2 = 0.17 for hoisting class HC1, and ϕ2,min = 1.1 and β2 = 0.34 for hoisting class HC2 (see Table 2.4).
In addition, Vb = steady hoisting speed = 1.3 m/s (assumed).

Therefore
for class HC1: dynamic factor = ϕ2 = 1.05 + 0.17 × 1.3 = 1.27;
for class HC2: dynamic factor = ϕ2 = 1.1 + 0.34 × 1.3 = 1.54.

Thus, referring to Table 2.2 and assuming the group of loads 1, we have the following:

for class HC1: ϕ = ϕ1ϕ2 = 0.9 × 1.27 = 1.14;
for class HC2: ϕ = ϕ1ϕ2 = 0.9 × 1.54 = 1.38.

The following vertical dynamic factors may be used as guidance for various hoisting classes:

  1. For hoisting class HC1, light-duty hand-operated cranes, assembly cranes, powerhouse cranes, and intermittently used storage cranes: dynamic factor ϕ = 1.1 (minimum) to 1.25.
  2. For hoisting class HC2, medium-duty cranes (normally in factories, workshops, and warehouses, and for casting and in scrapyards with continuous operation): dynamic factor ϕ = 1.25 to 1.4.
  3. For hoisting class HC3, heavy-duty cranes (in foundries and for intermittent grab and magnet work, forging, charging etc.): dynamic factor ϕ = 1.4 (minimum).

Generally, the crane manufacturer will provide the dynamic factor along with the crane wheel loads when details of the duty (class), the span of the crane, and the lifting capacity are given to the manufacturer.

crane lifting load

Transverse Horizontal Force (surge) on a Crane Girder

The following elements contribute to the transverse horizontal surge:

Thrust caused by the crab motor’s brakes being applied suddenly, causing the crab and cargo to come to a halt while traversing the crab girders. The frictional force created between the crab wheels and crab girders resists this thrust, which is then transferred to the crane’s crosshead girders and lastly transferred as point loads through the crane’s main wheels into the top flange of the crane girders.

Weights are frequently dragged across the manufacturing floor by a crane. This pulling motion creates a transverse horizontal component of force (a point load) on the crane girders through the crane wheels if the weight is particularly heavy. The crane girders receive the transverse horizontal force created by either of the above reasons or a combination of both through the double-flanged crane wheels on the end carriages, and cranes are intended to avoid derailment. It is difficult to quantify the value of this force because there are unknown components in addition to the preceding facts. The horizontal transverse force on each gantry girder must equal 10% of the load lifted, according to American specifications.

The British code of practice BS 2573-1: 1983 (British Standards Institution, 1983) specifies the following:

Value of total transverse horizontal force = 1/10 × weight of (lift load + crab). Eurocode 1, Part 3 stipulates the same value. Therefore value of total transverse horizontal force = 1/10 × weight of (lift load + crab).

This force should be shared equally between the two gantry girders.

Longitudinal horizontal force

The rapid application of brakes during crane travel causes frictional resistance to the locked wheels sliding along a rail attached to the gantry girder. This frictional resistance provides a horizontal force down the length of the gantry girder, which then transmits to the gantry girder’s supporting columns. Assume that steel sliding on steel has a coefficient of friction of 0.2. Consider the gantry girder’s maximum vertical wheel load, which happens when the weight lifted is at the closest allowed point to the girder.

So, maximum wheel load on the nearest gantry girder = maximum reaction from crane (load lifted + half the dead weight of crane) = W = R.

For example, if the load lifted is W1, the self-weight of the crane is W2, the distance of the load lifted from the nearest gantry girder is l and the crane span (centre to centre of crosshead) is L, then;

Maximum on-wheel load = W1(L − 1)/L + W2/2 = W = R.

Therefore longitudinal horizontal force developed = Rμ = 0.2R.

The American code of practice specifies that the longitudinal force is equal to 10% of the maximum wheel load. The British code of practice BS 2573 specifies that the longitudinal force is equal to 5% of the maximum wheel load, assumed to be acting on one gantry girder nearest to the load lifted. Eurocode 1 stipulates that the longitudinal force applied to the gantry girder should be calculated as follows (the equation numbers given in this chapter refer to Eurocode 1, Part 3):

HL,i = ϕ5Ki/nr

where
nr = number of gantry girders = 2
K = driving force (the value should be provided by the crane supplier),
ϕ5 = dynamic factor (see Table 5),
i = integer to identify the gantry girder (i = 1, 2).

Table 5: Dynamic factor ϕ5 (based on Table 2.6 of Eurocode 1, Part 3)

Value of the dynamic factor ϕ5Specific use
ϕ5 = 1For centrifugal forces
1.0 ≤ ϕ5 ≤ 1.5For systems where forces change smoothly
1.5 ≤ ϕ5 ≤ 2.0For cases where sudden changes can occur
ϕ5 = 3.0For drives with considerable backlash

Design of Steel Columns for Biaxial Bending | Eurocode 3

When a column section is subjected to bending moment in the two axes in addition to a compressive axial force, the column is said to be biaxially loaded. The design of steel columns for biaxial bending involves the verification of the steel section’s capacity in bending, shear, compression, flexural buckling, and interaction of all these forces. Interaction formulas are available in EN 1993-1-1:2005 (Eurocode 3) for the design of members that are biaxially loaded.

Clause 6.2.9 of EN 1993-1-1:2005 describes the design of cross-sections subjected to combined bending and axial force (such as steel columns). Bending can occur along one or both major axes, with tensile or compressive axial forces (with no difference in treatment). Eurocode 3 provides several approaches for designing Class 1 and 2, Class 3, and Class 4 cross-sections in order to deal with the combined effects.

A basic linear interaction presented below and in equation (1) can be applied to all cross-sections (clause 6.2.1(7)). Although Class 4 cross-section resistances must be based on effective section properties. Furthermore, any additional moments arising from the resulting shift in neutral axis should be allowed for in class 4 sections. These extra moments necessitate the use of the expanded linear interaction expression.

NEd/NRd + My;Ed/My;Rd + Mz;Ed/Mz;Rd ≤ 1.0 ———— (1)

where NRd, My,Rd, and Mz,Rd are the design cross-sectional resistances, and any required reduction due to shear effects should be included (clause 6.2.8). The goal of equation (1) is to allow a designer to obtain a quick, approximate, and safe solution, possibly for initial member sizing, with the option to refine the calculations for final design.

Bi-axial bending with or without axial force (Class 1 and 2 sections)

EN 1993-1-1, like BS 5950: Part 1, treats bi-axial bending as a subset of the combined bending and axial force regulations. Clause 6.2.9.1 specifies the checks for Class 1 and 2 cross-sections subjected to bi-axial bending with or without axial forces (6). Although equation (1) shows a simple linear interaction expression, equation (2) represents a more sophisticated convex interaction expression that can result in large efficiency gains:

(My;Ed/MN;y;Rd)α + (Mz;Ed /MN;z;Rd)β ≤ 1.0 ———- (2)

in which α and β are constants, as defined below. Clause 6.2.9(6) allows α and β to be taken as unity, thus reverting to a conservative linear interaction.

For I- and H-sections:
α = 2 and β = 5n but β ≤ 1.0

For circular hollow sections:
α = 2 and β = 1

Rectangular hollow sections
α = β = 1.66/(1 – 1.13n2) but α = β ≤ 6.0

n = NEd / Nc,Rd

Worked Example

Verify the capacity of a 3500 mm tall column of UKC 254x254x89 in a commercial complex to withstand the following ultimate limit state actions;

Design of Steel Columns for Biaxial Bending

Axial load; NEd = 1500 kN; (Compression)
Major axis moment at end 1 – Bottom; My,Ed1 = 89.0 kNm
Major axis moment at end 2 – Top; My,Ed2 = 77.0 kNm
Minor axis moment at end 1 – Bottom; Mz,Ed1 = 7.9 kNm
Minor axis moment at end 2 – Top; Mz,Ed2 = 2.4 kNm
Major axis shear force; Vy,Ed = 56 kN
Minor axis shear force;Vz,Ed = 14 kN

Solution

Partial factors
Resistance of cross-sections; γM0 = 1
Resistance of members to instability; γM1 = 1
Resistance of cross-sections in tension to fracture;  γM2 = 1.1

Column details
Column section; UKC 254x254x89
Steel grade; S275
Yield strength; fy = 265 N/mm2
Ultimate strength;  fu = 410 N/mm2
Modulus of elasticity;  E = 210 kN/mm2
Poisson’s ratio;  υ = 0.3
Shear modulus; G = E / [2 × (1 + υ)] = 80.8 kN/mm2

Column geometry
System length for buckling – Major axis; Ly = 3500 mm
System length for buckling – Minor axis; Lz = 3500 mm

The column is part of a sway frame in the direction of the minor axis
The column is part of a sway frame in the direction of the major axis

Column loading
Axial load; NEd = 1500 kN; (Compression)
Major axis moment at end 1 – Bottom; My,Ed1 = 89.0 kNm
Major axis moment at end 2 – Top; My,Ed2 = 77.0 kNm

Minor axis moment at end 1 – Bottom; Mz,Ed1 = 7.9 kNm
Minor axis moment at end 2 – Top; Mz,Ed2 = 2.4 kNm
Major axis shear force; Vy,Ed = 56 kN
Minor axis shear force;Vz,Ed = 14 kN

Buckling length for flexural buckling – Major axis
End restraint factor; Ky = 1.000
Buckling length; Lcr_y = Ly × Ky = 3500 mm

Buckling length for flexural buckling – Minor axis
End restraint factor;  Kz = 1.000
Buckling length;  Lcr_z = Lz × Kz = 3500 mm

Web section classification (Table 5.2)
fy = 265 N/mm2
Coefficient depending on fy; ε = √(235/ fy) = 0.942
Depth between fillets; cw = h – 2 × (tf + r) = 200.3 mm
Ratio of c/t;  ratiow = cw / tw = 19.45
Length of web taken by axial load; lw = min(NEd / (fy × tw), cw) = 200.3 mm
For class 1 & 2 proportion in compression; α = (cw/2 + lw/2) / cw = 1.000

Limit for class 1 web;                                                     
Limit1w = (396 × e) / (13 × a – 1) = 31.08
The web is class 1

Flange section classification (Table 5.2)
Outstand length; cf = (b – tw) / 2 – r = 110.3; mm
Ratio of c/t; ratiof = cf / tf = 6.38

Conservatively assume uniform compression in flange

Limit for class 1 flange; Limit1f = 9 × e = 8.48
Limit for class 2 flange; Limit2f = 10 × e = 9.42
Limit for class 3 flange; Limit3f = 14 × e = 13.18

The section is class 1

Resistance of cross section (cl. 6.2)

Shear – Major axis (cl. 6.2.6)
Design shear force; Vy,Ed = 56.0 kN
Shear area; Avy = max((h – 2tf) × tw, A – 2 × b × tf + (tw + 2 × r) × tf) = 3081 mm2
fy = 265 N/mm2
Plastic shear resistance;  Vpl,y,Rd = Avy × (fy/√3)/ γM0 = 471.4 kN
Vy,Ed / Vpl,y,Rd = 0.119
PASS – Shear resistance exceeds the design shear force

Vy,Ed ≤ 0.5×Vpl,y,Rd – No reduction in fy required for bending/axial force

Shear – Minor axis (cl. 6.2.6)
Design shear force; Vz,Ed = 13.5 kN
Shear area; Avz = 2 × b × tf – (tw + 2 × r) × tf = 8250 mm2
Plastic shear resistance; Vpl,z,Rd = Avz × (fy /√3) / γM0 = 1262.3 kN
Vz,Ed / Vpl,z,Rd = 0.011
PASS – Shear resistance exceeds the design shear force
Vz,Ed ≤ 0.5×Vpl,z,Rd – No reduction in fy required for bending/axial force

Compression (cl. 6.2.4)
Design force; NEd = 1500 kN
Design resistance; Nc,Rd = Npl,Rd = A × fy / γM0 = 3003 kN
NEd / Nc,Rd = 0.5
PASS – The compression design resistance exceeds the design force

Bending – Major axis (cl. 6.2.5)
Design bending moment;  My,Ed = max(abs(My,Ed1), abs(My,Ed2)) = 89.0 kNm
Section modulus;  Wy = Wpl.y = 1223.9; cm3
Design resistance; Mc,y,Rd = Wy × fy / γM0 = 324.3 kNm
My,Ed / Mc,y,Rd = 0.274
PASS – The bending design resistance exceeds the design moment

Bending – Major axis(cl. 6.2.5)
Design bending moment; Mz,Ed = max(abs(Mz,Ed1), abs(Mz,Ed2)) = 7.9 kNm
Section modulus; Wz = Wpl.z = 575.3; cm3
Design resistance; Mc,z,Rd = Wz × fy / γM0 = 152.5 kNm
Mz,Ed / Mc,z,Rd = 0.052
PASS – The bending design resistance exceeds the design moment

Combined bending and axial force (cl. 6.2.9)
fy = 265 N/mm2;
Npl,Rd = A × fy / γM0 = 3003 kN
Ratio design axial to design plastic resistance; n = abs(NEd) / Npl,Rd = 0.500
Ratio web area to gross area; a = min(0.5, (A – 2 × b × tf) / A) = 0.217

Bending – Major axis (cl. 6.2.9.1)
Design bending moment; My,Ed = max(abs(My,Ed1), abs(My,Ed2)) = 89.0 kNm
Plastic design resistance; Mpl,y,Rd = Wpl.y × fy / γM0 = 324.3 kNm
Modified design resistance; MN,y,Rd = Mpl,y,Rd × min(1, (1 – n) / (1 – 0.5 × a)) = 182.1 kNm
My,Ed / MN,y,Rd = 0.489
PASS – Bending resistance in presence of axial load exceeds the design moment

Bending – Minor axis (cl. 6.2.9.1)
Design bending moment;Mz,Ed = max(abs(Mz,Ed1), abs(Mz,Ed2)) = 7.9 kNm
Plastic design resistance;  Mpl,z,Rd = Wpl.z × fy / γM0 = 152.5 kNm
Modified design resistance;MN,z,Rd = Mpl,z,Rd × [1 – ((n – a) / (1 – a))2] = 132.6; kNm
Mz,Ed / MN,z,Rd = 0.059
PASS – Bending resistance in presence of axial load exceeds the design moment

Biaxial bending
Exponent α; α = 2.00
Exponent β;  β = max(1, 5 × n) = 2.50

Section utilisation at end 1; URCS_1 = [abs(My,Ed1) / MN,y,Rd] α + [abs(Mz,Ed1) / MN,z,Rd] β = 0.240
Section utilisation at end 2; URCS_2 = [abs(My,Ed2) / MN,y,Rd] α + [abs(Mz,Ed2) / MN,z,Rd] β = 0.179
PASS – The cross-section resistance is adequate

Buckling resistance (cl. 6.3)
Yield strength for buckling resistance;  fy = 265 N/mm2

Flexural buckling – Major axis
Elastic critical buckling force; Ncr,y = π2 × E × Iy / Lcr_y2 = 24140 kN
Non-dimensional slenderness; λy = √(A × fy / Ncr,y) = 0.353
Buckling curve (Table 6.2);  b
Imperfection factor (Table 6.1); αy = 0.34
Parameter Φ;  Φy = 0.5 × [1 + αy × (λy – 0.2) + λy2] = 0.588
Reduction factor;  χy = min(1.0, 1 / [Φy + √(Φy 2 – λy2)]) = 0.944
Design buckling resistance; Nb,y,Rd = χy × A × fy  / γM1 = 2835.9 kN
NEd / Nb,y,Rd = 0.529
PASS – The flexural buckling resistance exceeds the design axial load

Flexural buckling – Minor axis
Elastic critical buckling force; Ncr,z = π2 × E × Iz / Lcr_z2 = 8219 kN
Non-dimensional slenderness; λz = √(A × fy / Ncr,z) = 0.604
Buckling curve (Table 6.2);  c
Imperfection factor (Table 6.1); αz = 0.49
Parameter Φ; Φz = 0.5 × [1 + αz × (λz – 0.2) + λz2] = 0.782
Reduction factor; χz = min(1.0, 1 / [Φz + √(Φz2 – λz2)]) = 0.783
Design buckling resistance; Nb,z,Rd = χz × A × fy  / γM1 = 2350.4 kN
NEd / Nb,z,Rd = 0.638
PASS – The flexural buckling resistance exceeds the design axial load

Torsional and torsional-flexural buckling (cl. 6.3.1.4)

Torsional buckling length factor; KT = 1.00
Effective buckling length; Lcr_T = KT × max(Ly, Lz) = 3500 mm
Distance from shear ctr to centroid along major axis;  y0 = 0.0 mm
z0 = 0 mm
Distance from shear ctr to centroid along minor axis; z0 = 0.0 mm

i0 = √(iy2 + iz2 + y02 + z02) = 129.9 mm
bT = 1 – (y0 / i0)2 = 1.000

Elastic critical torsional buckling force; Ncr,T = 1 / i02 × (G × It + π2 × E × Iw / Lcr_T2) = 12085 kN
Elastic critical torsional-flexural buckling force; Ncr,TF = Ncr,y/(2 × bT) × [1 + Ncr,T/Ncr,y – √[(1 – Ncr,T/Ncr,y)2 + 4 × (y0/i0)2 × Ncr,T/Ncr,y]]
Ncr,TF = 12085 kN

Non-dimensional slenderness; λT = √(A × fy / min(Ncr,T, Ncr,TF)) = 0.498
Buckling curve (Table 6.2); c
Imperfection factor (Table 6.1); αT = 0.49
Parameter Φ; ΦT = 0.5 × [1 + αT × (λT – 0.2) + λT2] = 0.697
Reduction factor; χT = min(1.0, 1 / [ΦT + √(ΦT 2 – λT2)]) = 0.844
Design buckling resistance; Nb,T,Rd = χT × A × fy  / γM1 = 2533.9 kN
NEd / Nb,T,Rd = 0.592
PASS – The torsional/torsional-flexural buckling resistance exceeds the design axial load

Minimum buckling resistance
Minimum buckling resistance; Nb,Rd = min(Nb,y,Rd, Nb,z,Rd, Nb,T,Rd) = 2350.4 kN
NEd / Nb,Rd = 0.638
PASS – The axial load buckling resistance exceeds the design axial load

Buckling resistance moment (cl.6.3.2.1)
Lateral torsional buckling length factor;  KLT = 1.00
Effective buckling length; Lcr_LT = KLT × Lz = 3500 mm
End moment factor; y = My,Ed2 / My,Ed1 = 0.865
Moment distribution correction factor (Table 6.6);  kc = 1 / (1.33 – 0.33 × y) = 0.957
C1 = 1 / kc2 = 1.091
Curvature factor;  g = √[1 – (Iz / Iy)] = 0.812
Poissons ratio;  υ = 0.3
Shear modulus;  G = E / [2 × (1 + υ)] = 80769 N/mm2

Elastic critical buckling moment; Mcr = C1 × π2 × E × Iz × √[Iw / Iz + Lcr_LT2 × G × It /(π2 × E × Iz)]/(Lcr_LT2 × g)
Mcr = 1739.3 kNm

Slenderness ratio for lateral torsional buckling; λLT = √[Wy × fy / Mcr] = 0.432
Limiting slenderness ratio; λLT,0 = 0.40
Correction factor for rolled sections; βr = 0.75
Buckling curve (Table 6.5); b
Imperfection factor (Table 6.1); αLT = 0.34

Parameter ΦLT;   ΦLT = 0.5 × [1 + αLT × (λLT – λLT,0) + βr × λLT2] = 0.575
Reduction factor; χLT = min(1.0, 1/λLT2, 1 / [ΦLT + √(ΦLT2 – βr × λLT2)]) = 0.988
Modification factor;   f = min(1 – 0.5 × (1 – kc) × [1 – 2 × (λLT – 0.8)2], 1) = 0.984
Modified LTB reduction factor – eq 6.58; χLT,mod = min(χLT / f, 1, 1/λLT2) = 1.000

Design buckling resistance moment; Mb,Rd = χLT,mod × Wy × fy / γM1 = 324.3 kNm
Design bending moment; My,Ed = max(abs(My,Ed1), abs(My,Ed2)) = 89.0 kNm
My,Ed / Mb,Rd = 0.274
PASS – The design buckling resistance moment exceeds the maximum design moment

Combined bending and axial compression (cl. 6.3.3)
Characteristic resistance to normal force;  NRk = A × fy = 3003 kN
Characteristic moment resistance – Major axis; My,Rk = Wpl.y × fy = 324.3 kNm
Characteristic moment resistance – Minor axis; Mz,Rk = Wpl.z × fy = 152.5 kNm

Moment factor – Major axis; Cmy = 0.9
Moment factor – Minor axis; Cmz = 0.9

Moment distribution factor for LTB;  yLT = My,Ed2 / My,Ed1 = 0.865
Moment factor for LTB;  CmLT = max(0.4, 0.6 + 0.4 × yLT) = 0.946

Interaction factor kyy; kyy = Cmy × [1 + min(0.8, λy – 0.2) × NEd / (χy × NRk / γM1)] = 0.973
Interaction factor kzy;  kzy = 1 – min(0.1, 0.1 × λz) × NEd / ((CmLT – 0.25) × (χz × NRkM1)) = 0.945
Interaction factor kzz; kzz = Cmz × [1 + min(1.4, 2 × λz – 0.6) × NEd / (χz × NRk / γM1)] = 1.250
Interaction factor kyz; kyz =  0.6 × kzz = 0.750

Section utilisation;                       
URB_1 = NEd / (χy × NRk / γM1) + kyy × My,Ed / (χLT × My,Rk / γM1) + kyz × Mz,Ed / (Mz,Rk / γM1)
URB_1 = 0.838

URB_2 = NEd / (χz × NRk / γM1) + kzy × My,Ed / (χLT × My,Rk / γM1) + kzz × Mz,Ed / (Mz,Rk / γM1)
URB_2 = 0.965

PASS – The buckling resistance is adequate

Alternatives to the Construction of Foundation of Duplexes on Good Soil

Simple duplex buildings that are founded on soil with an allowable bearing capacity of 100 kN/m2 and above can be safely and economically supported on pad foundations. This article is aimed at proposing an alternative to the method of construction of foundations of duplexes on good soil (say, safe bearing capacity of 100 kN/m2 and above) in Nigeria.

In Nigeria, the most popular approach to the construction of the foundation of duplexes is the combination of pad foundation and strip foundation. Pad foundations are used to support the columns of the building, while the strip foundation is used to support the block wall (sandcrete masonry units).

step down of column base
Fig 1: Combination of a pad and strip foundation for a duplex

Typically, the size of a pad foundation depends on the expected service load coming from the column, the safe bearing capacity of the soil, and the allowable settlement (whichever governs the design). The thickness of the foundation and the reinforcements required is determined from ultimate limit state considerations such as bending, one-way shear, and punching shear.

On the other hand, the width of strip footings in the foundation of duplexes is usually kept between 675mm – 700 mm. The thickness of the concrete ranges from 150 mm to 225 mm if 9 inches hollow blocks are used. When the depth of the water table is very low below the surface, the depth of the foundation is usually kept between 900 mm and 1200 mm.

Since the strips are usually unreinforced, the recommended thickness of the strip foundation for 9 inches blocks (225 mm blocks) is about 225 mm, such that the pressure dispersal (at 45 degrees) will hit the edges of the foundation without introducing any punching shear (see Figure 2). This recommended option can be economically challenging during the construction of strips for duplexes and the advice of a structural engineer should be sought before a decision is taken.

Unreinforced strip footing construction
Fig 2: Schematics of a strip foundation for a duplex

During the structural design of residential duplexes, it is usually assumed that masonry units (block walls) do not carry any load (framed structure) even though sometimes construction methodology may suggest otherwise. Therefore at the foundation, we expect the strip footing to carry at most the self-weight of the ground floor wall and finishes, which is usually about 10.5 kN/m for a 3m high wall. The ground floor slab load may be transmitted to the strip foundation too.

Generically, the total load transmitted to the strip footing depends on the structural scheme and the construction methodology. For instance, some designers/builders prefer to chain foundations at the damp-proof course (DPC) level. In this case, the entire block wall load of the ground floor is not expected to be transmitted to the strip foundation, but to the columns through the plinth beams.

The Conventional Process of Constructing the Foundation of Duplexes in Nigeria

(a) Setting out
When it has been determined that pad foundations can be used to support a duplex in an area of low water table, the first step in the construction of the foundation is the ‘setting out’. For a regular duplex building, setting out can be achieved using wooden pegs and 2″ x 3″ softwood as the profile board (See Figure 3).

setting out
Fig 3: Typical setting out of a building using the 3-4-5 rule

Using the 3-4-5 method, builders’ square, and lines, the building can be set out accurately. Where available, total stations and laser setting out/levelling equipment can be used to make the job faster. The width of excavation, building lines, and wall centrelines are all established on the profile board using nails as shown in Figure 4.

foundation marker
Fig 4: Typical markings on a profile board

It is important to keep the profile board in place until the ground floor slab is cast. Furthermore, it can also be helpful to transfer reference levels and at least two coordinates (building lines/axes in both directions) to a permanent place peradventure you will need them later after the removal of the profile board.

(b) Excavation
After setting out the building, the next step is to commence excavation. The width of excavation is transferred from the profile board, while the depth of the foundation is determined from the design drawings. Using the reference level, the depth of the foundation is established by the site engineer. If the ground is sloping, the foundation can be stepped with the approval of the design engineer.

It may be possible to excavate the column bases first before the strip or vice versa. But in each case, some portion of the excavated soil must be moved away in order to accommodate the other. From experience, it may be handier to excavate the strips first before excavating the column bases.

In order to have a flat surface for laying blocks, the column bases may have to go deeper than the strips. For instance, if the column base is 300 mm thick, and the strip 150 mm thick, the column base may be stepped down by 200 mm (an additional 50 mm for the blinding) so that when it is cast, it will flush with the level of the strip as shown in Figure 5. For the foundation layout being considered, the excavation works should cost about ₦130,400 using manual labour.

Strip foundation and column base
Fig 5: Schematics of pad and strip foundation construction

(c) Leveling and Compaction of the Excavated Trenches
After the excavation of the trenches, the foundation base should be properly compacted and levelled to receive concrete. The levelling should ensure that the thickness of the concrete is the same wherever required. Wooden pegs or short reinforcement offcuts can be used to establish the required levels. Range and spirit level or laser can be used to transfer the levels from one point to another. For shallow foundations in lateritic or cohesive soils, the excavation should be able to stand on its own without caving in within the 900 – 1200 mm depth. If the foundation is founded on sand, side supports for the excavation will be required.

(d) Blinding
The column base should be blinded using concrete of the same strength as the foundation. The thickness of the blinding should be about 50 mm thick and should be properly consolidated.

(e) Reinforcement Works
The column base reinforcements and the starter bars should be prepared according to the structural drawing. Using the profile board and lines, the starter bars should be mounted in their correct position to avoid cranking of reinforcement later. The site engineer should ensure that the column starter bars are plumb and properly braced to prevent movement during concreting.

typical alignment of columns in duplex construction
Fig 6: Typical alignment of columns in duplex construction

The design engineer and the consulting architect should sign off the placement of the reinforcements after the iron benders are done. While the architect should check setting out and positioning, the structural engineer should check out the following;

(1) The blinding was properly done
(2) The correct bar size, yield strength, and spacing were used for the reinforcements. The Consulting Engineer should request the reinforcement tensile strength test result.
(3) Adequate concrete cover (50 mm) has been provided under the column base reinforcement, away from the blinding.
(4) The column starter bars are centrally positioned on the basket (or according to the drawings) to avoid eccentric loading on the foundation.
(5) The foundation has been pegged and excavated such that the thickness of the concrete when poured will meet the design specifications.

If the reinforcement placement is found satisfactory, approval should be given for concreting.

(f) Concreting
The strip foundation and the column bases should be poured to the specified thickness using the recommended concrete grade. The concrete should be properly vibrated to ensure that minimal voids exist in the concrete mass. An experienced mason should dress the surface and ensure that the established casting levels are properly followed.

(g) Blockwork
After the concreting, the blockwork should be done according to the drawings from the foundation up to the DPC level. The site engineer should ensure that the edges of the block adjacent to the column maintain a concrete cover of about 35 mm. Furthermore, the size of the column obtained should be consistent with the design specifications, since the blocks act as part of the permanent formwork for the column. The edges of the block close to the column should be perfectly aligned and plumb. Some engineers recommend filling the hollow sandcrete blocks with weak concrete.

block work in a foundation
Fig 7: Typical blockwork in the foundation of a duplex

(h) Casting of the column stubs
After the blockwork is complete, the column stubs should be cast. Before this is done, it is important to clean up all the soil that must have entered the base of the column preferably using a high-pressure water jet. This must be done before the carpenter places the formwork. The formwork for the column stubs must be properly braced to avoid bursting during the concrete pouring. The recommended concrete mix should be used, and be properly vibrated to avoid honeycombs.

(i) Backfilling and Compaction
The foundation is usually backfilled using the material excavated from the foundation. To make up level up to the DPC, high-quality lateritic materials or sand should be imported, placed, and compacted up to the required level. The earth material to be used should be non-expansive or problematic. After this process, the damp proof membrane should be installed, and hardcore/BRC wire mesh installed as recommended in the design specification.

(j) Casting of the ground-floor slab
Carpenters should prepare the edge formwork of the building and ensure that it is perfectly level. Levels should also be established internally so that the final surface of the ground floor slab will be flat. After this, the ground floor concrete is poured and finished as appropriate.

The casting of the ground-floor slab process completes the substructure works.

We can see that the process can be quite lengthy, and normally takes about one week to complete if there are no unnecessary delays and if an adequate workforce is used. A schematic representation of the final output is shown in Figure 8.

Conventional Duplex Foundation Construction Schematics
Fig 8: Schematics of complete substructure works in a building using strip foundation

Alternative Approach to Duplex Foundation Construction

If we theoretically assume that block walls do not carry any load, why do we go through the lengthy process of excavating the strips, casting the strip, and forming block walls from the foundation up to the DPC level? The new approach to be recommended in this section intends to boycott this process and probably save cost, and make the construction process faster. This approach may already be in practice somewhere else. The new approach is outlined below;

(1) Setting out
The setting out process is the same as outlined above, but the excavation lines for the width of the strip may be omitted.

(2) Excavation and blinding
At this stage, only the column bases will be excavated to the required depth, and the concrete for blinding poured as technically specified.

(3) Reinforcement Works
The reinforcement works for the column base and column starter bars should be prepared and installed as described in the approach above.

(4) Casting of the column base and stubs
The column base concrete should be poured first and the following day, 75mm thick kickers that depicts the dimensions and orientation of the columns should be formed. The column stub formwork should be installed and properly braced before the concreting of the column stub is done. The height of the column should be up to the grade level or as technically recommended.

(5) Casting of plinth beams
Reinforced concrete plinth beams should be cast near the ground level surface to receive the block walls that will go up to the required ground floor level. The ground to receive the plinth beams should be well prepared, levelled, and made firm to receive the blinding before the beam is cast. The plinth beams should run from column to column and to areas where blockwork is expected. The width of the beam should be the same width as the block to be used or larger. The depth can be determined by the structural engineer but is not expected to exceed 300 mm.

(6) Blockwork
Blockwork is laid from the plinth beam to the required DPC level. After which the filling, compaction, and casting of the ground floor are done. A schematic representation of the final output is shown in Figure 8.

Alternative to duplex construction
Fig 9: Schematics of complete substructure works in a building using plinth beams

Cost Comparison of both Alternatives

Let us now compare the cost of adopting both approaches in the construction of a duplex with the foundation layout shown in Figure 10.

foundation layout
Fig 10: Foundation layout of a typical duplex building

Constructing a plinth beam and ignoring strip foundation for the substructure layout shown in Figure 10 will incur the following costs;

(1) Cost of minor excavation and leveling of ground (say) = ₦20,000
(2) Concrete required = 6m3 × ₦42,500 = ₦255,000
(3) Y12 mm reinforcement required = 405 kg × ₦450 = ₦182,250
(4) Y8 mm required as links = 162 kg × ₦450 = ₦72,900
(5) Binding wire (say) = ₦13,000
(6) Formwork required 58 m2 of 1″ x 12″ planks = 58 m2 × ₦1905 = ₦110,490
(7) Bracing required 20 pcs pf 2″ x 3″ wood = 20 × ₦400 = ₦8000
(8) Total Labour and supervision cost = ₦120,000
Total cost of construction = ₦781,640

Alternatively, when the strip foundation is used, the likely costs are as follows;
(1) Excavation of strip foundation = ₦100,000
(2) Concrete required for the strip = 13.5 m3 × ₦42,500 = ₦573,750
(3) Blockwork to the ground level = 103 m2 × ₦3,700 = ₦381,100
(4) Backfilling of strip foundation (say) = ₦10,000
(5) Total Labour cost (concrete and block work) = ₦149,900
(6) Supervision cost (say) = ₦50,000
Total cost of construction = ₦1,264,750

Therefore using grade supported plinth beams to support blockwork instead of strip foundation in the substructure of a duplex can lead to savings in the cost of the substructure by about 38%.