8.7 C
New York
Friday, September 20, 2024
Home Blog Page 31

Top Open Access Civil Engineering Research Articles | January 2021

Innovations, developments, and advancements in the civil engineering industry are primarily driven by research. Researches from scholars in different academic institutions, research institutes, and the industry are subjected to rigorous peer review before they are accepted and published in high ranking reputable journals. They are usually published as open access or closed access (standard subscription) journals.
Open access journals are journals that are publicly accessible to anyone. At Structville Integrated Services, we are interested in advancing civil engineering knowledge, and keeping civil engineers abreast of the latest industry standards, developments, and discoveries. Therefore, we have compiled a list of open access research articles by reputable journals for the month of January 2021. The list is not exhaustive and can never be. However, you can visit the website of the journals listed for more articles.

Read Also…
List of Reputable Journals in Geotechnical Engineering

Any of the topics below that is of interest to you can be downloaded from the journal’s server by following the hyperlink provided on the title of the paper.

Open Access Civil Engineering Research Articles

Title: The post-installed screw pull-out test: Development of a method for assessing in-situ concrete compressive strength
Authors: Salam Al-Sabah, Shah Nur Alam Sourav, Ciaran McNally
Publisher: Elsevier – Journal of Building Engineering, Volume 33, 2021, 101658

Title: Durability characteristics of high and ultra-high performance concretes
Authors: Muazzam Ghous Sohail, Ramazan Kahraman, Nasser Al Nuaimi, Bora Gencturk, Wael Alnahhal
Publisher: Elsevier – Journal of Building Engineering, Volume 33, 2021, 101669

Title: A detailed view on the rebar–to–concrete interaction based on refined measurement techniques
Authors: Raffaele Cantone, Miguel Fernández Ruiz, Aurelio Muttoni
Publisher: Elsevier – Engineering Structures, Volume 226, 2021, 111332

Title: Parametric analyses and feasibility study of moment-resisting timber frames under service load
Authors: Aivars Vilguts, Haris Stamatopoulos, Kjell Arne Malo
Publisher: Elsevier – Engineering Structures, Volume 228, 2021, 111583

Title: Incorporation of pre-existing cracks in finite element analyses of reinforced concrete beams without transverse reinforcement
Authors: Mattias Blomfors, Carlos G. Berrocal, Karin Lundgren, Kamyab Zandi
Publisher: Elsevier – Engineering Structures, Volume 229, 2021, 111601

Title: Experimental Study on Mechanical Properties of Reinforced Soil Interface under Dry-Wet Cycle
Authors: Liang Huang, Wenbo Ma, Yujie Hou, Bo Wang, and Jiahua Zhu
Publisher: Hindawi – Advances in Civil Engineering, Volume 2021 |Article ID 8874655 

Title: Research on Corrosion Damage and Bearing Characteristics of Bridge Pile Foundation Concrete under a Dry-Wet-Freeze-Thaw Cycle
Authors: Zhongju Feng, Jianwei Huo, Haibo Hu, Ruixin Zhao, Fuchun Wang, Guan Jiang, Xianhua Yao, Tie Li, Zhenyu Song
Publisher: Hindawi – Advances in Civil Engineering, Volume 2021, Article ID 8884396

Title: Intelligent Vehicle Automatic Stop-and-Go Task Based on Humanized Learning Control Model
Authors: Tianjun Sun, Zhenhai Gao, Fei Gao, Tianyao Zhang, Di Ji, Siyan Chen
Publisher: Hindawi- Advances in Civil Engineering, Volume 2021, Article ID 8867091

Title: An Accurate Numerical Model Simulating Hysteretic Behavior of Reinforced Concrete Columns Irrespective of Types of Loading Protocols.
Authors: Lee, C.S., Han, S.W.
Publisher: Springer – International Journal of Concrete Structures and Materials  Volume 15, Article No 5 (2021)

Title: Toward Structural Health Monitoring of Civil Structures Based on Self-Sensing Concrete Nanocomposites: A Validation in a Reinforced-Concrete Beam.
Authors: Castañeda-Saldarriaga, D.L., Alvarez-Montoya, J., Martínez-Tejada, V. et al.
Publisher: Springer – International Journal of Concrete Structures and Materials  Volume 15, Article No 3 (2021)

Title: Offshore Wind Turbine Foundations
Authors: Amin Barari, Britta Bienen, Domenico Lombardi, Shinji Sassa
Publisher: Elsevier – Soils and Foundation, 2021 https://doi.org/10.1016/j.sandf.2020.12.004

Title: Study on the ultimate bearing capacity of a strip footing influenced by an irregular underlying cavity in karst areas
Authors: Lianheng Zhao, Shan Huang, Zhonglin Zeng, Rui Zhang, Gaopeng Tang, Shi Zuo,
Publisher: Elsevier – Soils and Foundations, 2021, https://doi.org/10.1016/j.sandf.2020.09.011

Title: Reliability-based design for earth-fill dams against severe natural disaster events
Authors: Shin-ichi Nishimura, Toshifumi Shibata, Takayuki Shuku,
Publisher: Elsevier – Soils and Foundations, 2021 https://doi.org/10.1016/j.sandf.2020.09.004

Title: Numerical analysis of static behavior of caisson-type quay wall deepened by grouting rubble-mound
Authors: Nguyen, AD., Kim, YS., Kang, GO. et al.
Publisher: Springer – International Journal of Geo-Engineering 12, 1 (2021). https://doi.org/10.1186/s40703-020-00130-3

Title: Application and Analysis of Machine Learning Algorithms for Design of Concrete Mix with Plasticizer and without Plasticizer
Authors: Pandey Shivam, Kumar Veerendra, Kumar Pawan
Publisher: Journal of Soft Computing in Civil Engineering, Volume 5, Issue 1, 2021

Title: Optimizing Reinforced Concrete Cantilever Retaining Walls Using Gases Brownian Motion Algorithm (GBMOA)
Authors: Mehdi Shalchi Tousi, Mahmoud Ghazavi, Samane Laali  
Publisher: Journal of Soft Computing in Civil Engineering, Volume 5, Issue 1, 2021

Title: Bifurcation analysis of shear band in sand under true triaxial conditions with hypoplasticity
Authors: Wei Zhang, Shun Wang, Yang Wu, Wei Wu
Publisher: John Wiley and Sons Ltd – International Journal for Numerical and Analytical Methods in Geomechanics (2021)https://doi.org/10.1002/nag.3185

Title: An innovative approach for high-performance road pavement monitoring using black box
Authors: Monica Meocci, Valentina Branzi, Andrea Sangiovanni 
Publisher: Springer – Journal of Civil Structural Health Monitoring (2021) https://doi.org/10.1007/s13349-020-00463-8

Title: A Qualitative Study on Providing Alternative Solutions for Handling the HSR Passenger’s Luggage
Authors: Lok Pan Lo, Marin Marinov, Bernhard Rüger 
Publisher: Springer – Urban Rail Transit (2021) https://doi.org/10.1007/s40864-020-00139-y

Title: Effects of Plastic Waste Materials on Geotechnical Properties of Clayey Soil
Authors: Hussein Jalal Aswad Hassan, Jabar Rasul, Maleaha Samin 
Publisher: Springer – Transportation Infrastructure Geotechnology (2021) https://doi.org/10.1007/s40515-020-00145-4

Title: Glass-paper-laminates: Examination of manufacturing methods, properties and discussion of potentials
Authors: Robert Götzinger, Maximillian Hill, Samuel Schabel, Jens Schneider 
Publisher: Springer – Glass Structures & Engineering (2021) https://doi.org/10.1007/s40940-020-00144-4

Title: An Optimization Algorithm for Exponential Curve Model of Single Pile Bearing Capacity
Authors: Hongmei Ma, Cheng Peng, Jinying Gan, Yonghong Deng 
Publisher: Springer – Geotechnical and Geological Engineering (2021) https://doi.org/10.1007/s10706-020-01663-1

Title: Analysis of the Behaviour of Very Slender Piles: Focus on the Ultimate Load
Authors: Michele Placido, Antonio Gatto, Lorella Montrasio 
Publisher: Springer – International Journal of Civil Engineering Volume 19:145–153 (2021)

Title: Numerical stability analysis of arch-supported membrane roofs
Authors: Dezső Hegyi
Publisher: Elsevier – Structures Volume 29 (2021): 785-795

Title: Partial factor for local buckling of welded box sections
Authors: B. Somodi, B. Kövesdi, T. Hornyák
Publisher: Elsevier – Structures Volume 30 (2021): 440-454

Title: Accelerated Construction of Urban Intersections with Portland Cement Concrete Pavement (PCCP)
Authors: Kamran M.Nemati, Jeff S.Uhlmeyer
Publisher: Elsevier – Case studies in Construction materials (2021) https://doi.org/10.1016/j.cscm.2021.e00499

Title: Repair of corroded self-compacted reinforced concrete columns loaded eccentrically using carbon fiber reinforced polymer
Authors: Nabil Al-Akhras, Mohammed Al-Mashraqi
Publisher: Elsevier – Case studies in Construction materials (2021) Volume 14

Title: Reliability analysis and formula adjustment for shear capacity of concrete shear walls
Authors: Xiaolong Tong, Fumin Chen, DeguoZeng
Publisher: Elsevier – Case studies in Construction materials (2021) Volume 14 https://doi.org/10.1016/j.cscm.2020.e00484

Title: Factors influencing the performance of rebound hammer used for non-destructive testing of concrete members: A review
Authors: Hemraj R.Kumavat, Narayan R.Chandak, Ishwar T.Patil
Publisher: Elsevier – Case studies in Construction materials (2021) Volume 14 https://doi.org/10.1016/j.cscm.2021.e00491

Title: Built environment and early infection of COVID-19 in urban districts: A case study of Huangzhou
Authors: Bo Li, You Peng, He He, Mingshu Wang, Tao Feng
Publisher: Elsevier – Sustainable Cities and Society, Volume 66, 2021, 102685

Title: On the sustainability of electric vehicles: What about their impacts on land use?
Author: Francesco Orsi
Publisher: Elsevier – Sustainable Cities and Society, Volume 66, 2021, 102680

Title: Prediction of the autogenous shrinkage and microcracking of alkali-activated slag and fly ash concrete
Authors: Zhenming Li, Tianshi Lu, Yun Chen, Bei Wu, Guang Ye
Publisher: Elsevier – Cement and Concrete Composites, Volume 117, 2021, 103913

Title: Seismic design of non-dissipative embedded column base connections
Authors: Hiroyuki Inamasu, Amit M. Kanvinde, Dimitrios G. Lignos,
Publisher: Elsevier – Journal of Constructional Steel Research, Volume 177, 2021, 106417

Title: A framework to automate the design of digitally-fabricated timber plate structures
Authors: Aryan Rezaei Rad, Henry Burton, Nicolas Rogeau, Petras Vestartas, Yves Weinand
Publisher: Elsevier – Computers & Structures, Volume 244, 2021, 106456

Title: Numerical limit analysis-based modelling of masonry structures subjected to large displacements
Authors: A. Iannuzzo, A. Dell’Endice, T. Van Mele, P. Block
Publisher: Elsevier – Computers & Structures, Volume 242, 2021, 106372


Self-Compacting Concrete (SCC)

Self-compacting concrete (SCC) is a special type of concrete that has the ability to consolidate under gravity, fill up all required spaces, and produce dense and smoothly finished concrete when placed in formwork without the need for any external vibration. This special property of self-compacting concrete is due to the excellent workability it possesses in its fresh state, and the ability of the concrete to remain cohesive without segregation and bleeding when placed.

Self-compacting concrete was developed in Japan in the 1980s, and has found wide applications in the construction industry due to its numerous advantages. As a result of its highly flowable nature, SCC can settle into formworks and fill up heavily reinforced, congested, narrow, and deep sections by means of its own weight. Unlike conventional concrete, SCC does not require compaction using external force from mechanical equipment such as immersion vibrators.

concrete vibrator
Vibration is not required in self-compacting concrete

The common advantages of self-compacting concrete (SCC) are as follows;

  1. Less labour is required for the vibration and compaction of concrete on site
  2. Formwork congested with reinforcement can be cast with more ease
  3. Narrow and/or deep forms can be cast without the formation of honeycombs
  4. There is no risk of formwork damage due to vibration as commonly encountered in conventional concrete placement
  5. There are reduced health and safety concerns on site
  6. The working environment is improved due to little or no noise from concrete vibrating equipment

In many cases, self-compacting concrete is usually associated with high-strength concrete, hence the term ‘high-performance self-compacting concrete’ (HPSCC). High-performance self-compacting concrete can have compressive strength between 60 – 100 MPa. Ultra high-performance concrete can have compressive strength up to 150 MPa. High-performance concrete is expected to possess the following qualities;

  1. High strength
  2. High durability
  3. Low shrinkage and creep
  4. Easy to place and consolidate
  5. Cost-effective

When compared with ordinary concrete, SCC is usually produced using a large amount of cement/fillers, superplasticizer, and/or other viscosity modifying admixtures. The supplemented binder content is associated with other cement replacement materials (CRMs) such as fly ash (FA), ground granulated blast furnace slag (GGBFS), silica fume (SF), rice husk ash (RHA), etc. The incorporation of CRMs is usually to improve the workability of the concrete, and the properties of the hardened concrete. There are limits to the size of aggregates also, with a recommended maximum aggregate size of 25 mm.

Therefore, for SCC, the following properties are required;

  • At the fresh state: Good workability without segregation
  • At the early state: No initial defects or honeycombs
  • At the hardened state: Good strength and resistance to external attacks

Tests for Self-Compacting Concrete

According to the European guidelines for self-compacting concrete, none of the test methods in the current EN 12350 series ‘Testing fresh concrete’ are suitable for the assessment of the key properties of fresh SCC. The filling ability and stability of self-compacting concrete in the fresh state can be defined by four key characteristics. Each characteristic can be addressed by one or more test methods as shown in the table below;

CharacteristicsPreferred test
FlowabilitySlump-flow test
Viscosity (assessed by rate of flow)T500 Slump-flow test or V-funnel test
Passing abilityL-box test
SegregationSegregation resistance (sieve) test
[Source: The European Guidelines for Self Compacting Concrete]

There are other appropriate tests that can be done on fresh SCC. Tests such as Orimet and O-funnel test can be used to assess the viscosity of SCC. U-box and J-ring tests can also be used to determine the passing ability of fresh SCC, while penetration and settlement column tests can also be used to determine the segregation resistance.

Slump-flow value describes the flowability of a fresh mix in unconfined conditions. It is a sensitive test that will normally be specified for all SCC, as the primary check that the consistence of the fresh concrete meets the specification. The slump flow value is usually obtained from the slup test.

slump flow test
Slump flow test

The viscosity of SCC can be assessed by the T500 time during the slump-flow test or assessed by the V-funnel flow time. The time value obtained does not measure the viscosity of SCC but is related to it by describing the rate of flow. Concrete with low viscosity will have a very quick initial flow and then stop. Concrete with high viscosity may continue to creep forward over an extended time.

v funnel test
V-funnel test

Passing ability describes the capacity of the fresh mix to flow through confined spaces and narrow openings such as areas of congested reinforcement without segregation, loss of uniformity, or causing blocking. In defining the passing ability, it is necessary to consider the geometry and density of the reinforcement, the flowability/filling ability, and the maximum aggregate size. This can be evaluated using the L-box test.

L-box test for self-compacting concrete
L-box test

Segregation resistance is fundamental for SCC in-situ homogeneity and quality. SCC can suffer from segregation during placing and also after placing but before stiffening. Segregation which occurs after placing will be most detrimental in tall elements but even in thin slabs, it can lead to surface defects such as cracking or a weak surface.

Segregation resistance becomes an important parameter with higher slump-flow classes and/or the lower viscosity class, or if placing conditions promote segregation. If none of these apply, it is usually not necessary to specify a segregation resistance class.

sieve segregation test

Consistency Requirements of Self-Compacting Concrete

Slump Flow

The European Guidelines for Self Compacting Concrete classifies the slump flow of SCC into;

  • SF1 (550 – 650 mm)
  • SF2 (660 – 750 mm), and
  • SF3 (760 – 850 mm).

SF1 (550 – 650 mm) is appropriate for unreinforced or slightly reinforced concrete structures that are cast from the top with free displacement from the delivery point (e.g. housing slabs), casting by a pump injection system (e.g. tunnel linings), and sections that are small enough to prevent long horizontal flow (e.g. piles and some deep foundations).

SF2 (660 – 750 mm) is suitable for many normal applications (e.g. walls, columns)

SF3 (760 – 850 mm) is typically produced with a small maximum size of aggregates (less than 16 mm) and is used for vertical applications in very congested structures, structures with complex shapes, or for filling under formwork. SF3 will often give a better surface finish than SF2 for normal vertical applications but segregation resistance is more difficult to control.

Viscosity

The viscosity of SCC is classified into:

  • VS1 (V-funnel time ≤ 8 seconds), and
  • VS2 (V-funnel time between 9 -25 seconds)

VS1/VF1 has good filling ability even with congested reinforcement. It is capable of self-levelling and generally has the best surface finish. However, it is more likely to suffer from bleeding and segregation.

VS2/VF2 has no upper class limit but with increasing flow time it is more likely to exhibit thixotropic effects, which may be helpful in limiting the formwork pressure or improving segregation resistance. Negative effects may be experienced regarding surface finish (blow holes) and sensitivity to stoppages or delays between successive lifts.

Passing Ability

It is important to define the confinement gap when specifying SCC. The defining dimension is the smallest gap (confinement gap) through which SCC has to continuously flow to fill the formwork. This gap is usually but not always related to the reinforcement spacing. Unless the reinforcement is very congested, the space between reinforcement and formwork cover is not normally taken into account as SCC can surround the bars and does not need to continuously flow through these spaces.

Examples of passing ability specifications are given below:

  • PA 1 structures with a gap of 80 mm to 100 mm, (e.g. housing, vertical structures)
  • PA 2 structures with a gap of 60 mm to 80 mm, (e.g. civil engineering structures)

With L-box test;

PA1 (≥ 0.80 with 2 rebars)
PA2 (≥ 0.80 with 3 rebars)

For thin slabs where the gap is greater than 80 mm and other structures where the gap is greater than 100 mm no specified passing ability is required. For complex structures with a gap less than 60 mm, specific mock-up trials may be necessary.

Segregation Resistance

Segregation resistance of SCC is classified into;

  • SR1 (segregation resistance ≤ 20%), and
  • SR2 (segregation resistance ≤ 15%).

SR1 is generally applicable for thin slabs and for vertical applications with a flow distance of less than 5 metres and a confinement gap greater than 80 mm.

SR2 is preferred in vertical applications if the flow distance is more than 5 metres with a confinement gap greater than 80 mm in order to take care of segregation during flow. SR2 may also be used for tall vertical applications with a confinement gap of less than 80 mm if the flow distance is less than 5 metres but if the flow is more than 5 metres a target SR value of less than 10% is recommended.

Mix Design Approach for Self-Compacting Concrete

Laboratory trials should be used to verify the properties of the initial mix composition with respect to the specified characteristics and classes. If necessary, adjustments to the mix composition should then be made. Once all requirements are fulfilled, the mix should be tested at full scale in the concrete plant and if necessary at the site to verify both the fresh and hardened properties.

Mix design principles

To achieve the required combination of properties in fresh SCC mixes:

  1. The fluidity and viscosity of the paste is adjusted and balanced by careful selection and proportioning of the cement and additions, by limiting the water/powder ratio and then by adding a superplasticiser and (optionally) a viscosity modifying admixture. Correctly controlling these components of SCC, their compatibility and interaction is the key to achieving good filling ability, passing ability and resistance to segregation.
  2. In order to control temperature rise and thermal shrinkage cracking as well as strength, the fine powder content may contain a significant proportion of type l or ll additions to keep the cement content at an acceptable level.
  3. The paste is the vehicle for the transport of the aggregate; therefore the volume of the paste must be greater than the void volume in the aggregate so that all individual aggregate particles are fully coated and lubricated by a layer of paste. This increases fluidity and reduces aggregate friction.
  4. The coarse to fine aggregate ratio in the mix is reduced so that individual coarse aggregate particles are fully surrounded by a layer of mortar. This reduces aggregate interlock and bridging when the concrete passes through narrow openings or gaps between reinforcement and increases the passing ability of the SCC.

The mix design is generally based on the approach outlined below:

  1. Evaluate the water demand and optimise the flow and stability of the paste
  2. Determine the proportion of sand and the dose of admixture to give the required robustness
  3. Test the sensitivity for small variations in quantities (the robustness)
  4. Add an appropriate amount of coarse aggregate
  5. Produce the fresh SCC in the laboratory mixer, perform the required tests
  6. Test the properties of the SCC in the hardened state
  7. Produce trial mixes in the plant mixer.

Primary Source of Information:
SCC European Project Group (2005): The European Guidelines for Self-Compacting Concrete (Specification, Production and Use). https://www.theconcreteinitiative.eu/images/ECP_Documents/EuropeanGuidelinesSelfCompactingConcrete.pdf

Modelling and Analysis of Bridge Pile Cap Using Staad Pro

Bridge pile caps are substructure elements that are used for transferring bridge superstructure load to the pile foundation. Pile caps for bridges are used for supporting the piers and/or the abutments of a bridge and are usually subjected to axial compression, shear (lateral force), and bending moment from the bridge pier or abutment.

These actions are usually resulting from the self-weight and superimposed dead loads on the bridge (permanent actions), vertical traffic live loads, horizontal actions due to wind, bridge deck contraction, impact/collision, braking, and skidding loads, etc.

Pile caps behave like thick plates and traditionally can be analysed using strut-and-tie or bending analogy method. Alternatively, finite element analysis can be used for the analysis of pile caps with or without the effects of soil-structure interaction.

It is possible to model pile caps using plates and beams on elements on Staad Pro software and obtain accurate results. Ubani has demonstrated the application of Staad Pro in the modelling of triangular pile caps (3 piles) and rectangular pile caps (2 piles) and compared the results with solutions from classical analysis methods. The results were found to be satisfactory for design purposes. The aim of this article is to extend the analysis of pile caps using Staad Pro to bridges and other complex structures (see the previous articles below).

Comparative analysis of triangular pile cap using Staad Pro and bending theory
Structural design of pile caps using strut-and-tie method

In order to achieve this, the pile cap should be modelled using plate elements, while the piers (columns) and piles should be modelled using beam elements. In the case of pile caps supporting abutments, the abutment walls should be modelled using plate elements. It is very typical to model the piers/columns as stubs, and the actions applied to them as appropriate. The piles should be modelled as short columns that are supported with fixed supports. Furthermore, it is very important to ensure that all the nodes in the model are interconnected and rigid.

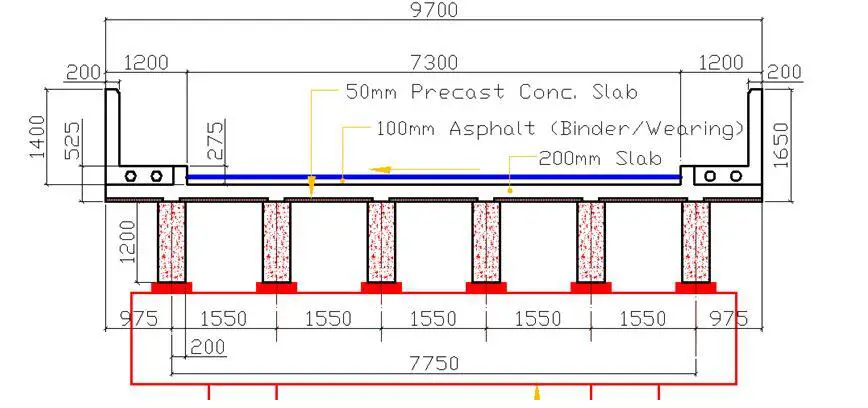
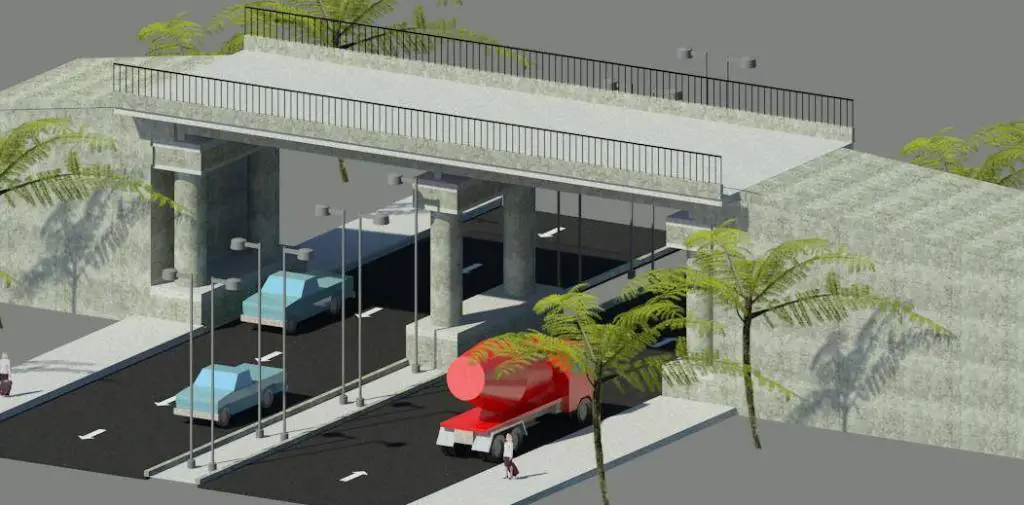
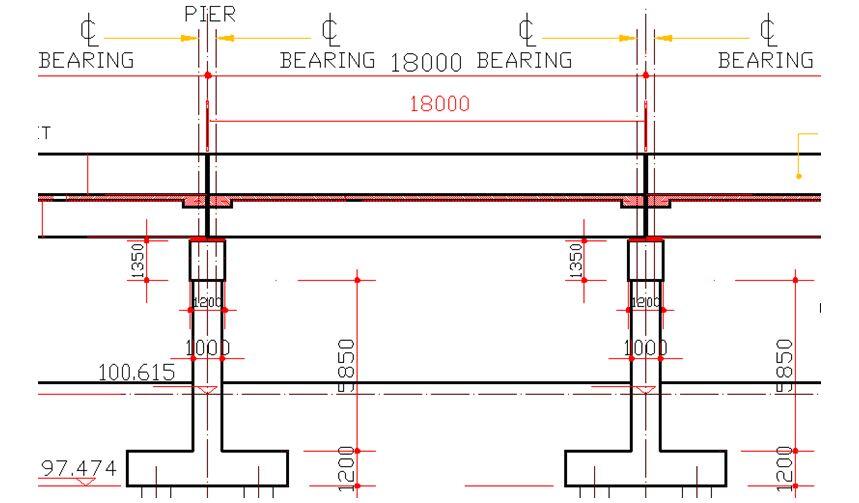
To demonstrate how this can be done, let us consider the pile cap of a bridge pier shown below. Note that the arrangement of the piles and pile caps should be consistent with the standard practice of ensuring that the maximum spacing of piles (for friction piles) should not less 3 times the diameter of the piles. The selection of the size and number of piles should be based on the geotechnical soil test report and the summation of the service loads from the superstructure.

model of bridge pile cap
bridge pile cap section

For the bridge substructure shown above, the actions on each leg of the pier are as follows;

Load Combinations
Vertical actions
(ULS) = 1.35Gk + 1.35Qk = 4560 kN
(SLS) = 1.0Gk + 1.15Qk = 3378 kN

Horizontal Loads
For road bridges, wind load need not be combined with braking/acceleration forces. Furthermore, accidental actions (collision) need not be considered with wind loads.
(ULS) = 620 kN
(SLS) = 496 kN

Bending moment;
(ULS) = 2412 kNm
(SLS) = 1647 kNm

The modelling of the pile cap on Staad Pro is shown below;

pile cap model
bridge pile cap

The reactions on the piles at SLS are shown below;

pile reactions

From the result above, the engineer should ensure that safe load bearing capacity of the each pile is not less than the maximum reaction on the pile (which is 1187.945 kN).

The bending moment on the pile cap at ultimate limit state is shown below;

Pile cap bending moment
pile cap bending moment my

The maximum reactions on the piles at ULS (for the sake of punching shear verification) is shown below;

pile support reaction

The maximum reaction is 1624.341 kN and can be used for shear verification.

Design of Timber Joists to EN 1995-1-1:2004

Timber joists are flexural horizontal timber members that are used for framing an open space in a building in order to support a floor or sheathing. They are usually closely spaced (usually between 400 – 800 mm) with the plane of maximum strength positioned vertically.

The spans of the joists are usually supported or intercepted by blockings which may be linear or skewed (staggered). Timber joists transfer the load of the floor to the vertical compression members (such as timber columns) and can be made of solid timber, glulam, or other engineered wood products.

As flexural structural members, the design of timber joists is expected to satisfy the following requirements;

  1. Bending
  2. Shear
  3. Bearing
  4. Lateral buckling
  5. Deflection, and
  6. Vibration

Design Example of Timber Joists

In this article, let us design the timber floor joists for a domestic dwelling using timber of strength class C24 to support a medium-term permanent action of 0.75 kN/m2 and a variable (live) load of 1.5 kN/m2 given that the:

Loading on the floor joist of a building

a) floor width, b, is 3.6 m and floor span, l, is 3.0 m
b) joists are spaced at 600 mm centres
c) the bearing length is 100 mm

continuous timber floor joist loading

Self weight of timber = 3.4335 kN/m3 x 0.15m x 0.05m = 0.0257 kN/m
Chaaracteristic permaent action on each joist = 0.75 kN/m2 x 0.6m = 0.45 kN/m
Total characteristic permanent action gk = 0.476 kN/m

Total characteristic variable action qk = 1.5 kN/m2 x 0.6 m = 0.9 kN/m

At ultimate state; pEd = 1.35gk + 1.5qk = 1.9926 kN/m
At serviceability limit state pEd = 1.0gk + 1.0qk = 1.376 kN/m

Structural Analysis

design shear and bending moment
deflection

Structural Design
Member – Span 1
The partial factor for material properties and resistances
Partial factor for material properties (Table 2.3 of EN 1995-1-1:2004); γM = 1.300

Member details
Load duration (cl.2.3.1.2 of EC5); Medium-term
Service class – (cl.2.3.1.3 of EC5); 2

Timber section details
Number of timber sections in member; N = 1
Breadth of sections; b = 50 mm
Depth of sections; h = 150 mm
Timber strength class – EN 338:2016 Table 1; C24

timber section

Properties of 50 x 150 mm timber section
Cross-sectional area, A = 7500 mm2
Section modulus, Wy = 187500 mm3
Section modulus, Wz = 62500 mm3
Second moment of area, Iy = 14062500 mm4
Second moment of area, Iz = 1562500 mm4
Radius of gyration, iy = 43.3 mm
Radius of gyration, iz = 14.4 mm

Timber strength class C24
Characteristic bending strength, fm.k = 24 N/mm2
Characteristic shear strength, fv.k = 4 N/mm2
Characteristic compression strength parallel to grain, fc.0.k = 21 N/mm2
Characteristic compression strength perpendicular to grain, fc.90.k = 2.5 N/mm2
Characteristic tension strength parallel to grain, ft.0.k = 14.5 N/mm2
Mean modulus of elasticity, E0.mean = 11000 N/mm2
Fifth percentile modulus of elasticity, E0.05 = 7400 N/mm2
Shear modulus of elasticity, Gmean = 690 N/mm2
Characteristic density, rk = 350 kg/m3
Mean density, rmean = 420 kg/m3

Consider Combination 1 – 1.35Gk + 1.5Qk (Strength)

Typical arrangement and design of timber joists

Modification factors
Duration of load and moisture content – Table 3.1; kmod = 0.8
Deformation factor – Table 3.2; kdef = 0.8
Bending stress re-distribution factor – cl.6.1.6(2); km = 0.7
Crack factor for shear resistance – cl.6.1.7(2); kcr = 0.67
Load configuration factor – cl.6.1.5(4); kc,90 = 1.5
System strength factor – cl.6.6;  ksys = 1.1

At the start of span

Check compression perpendicular to the grain (cl.6.1.5 of EC5)
Design perpendicular compression – major axis; Fc,y,90,d = 2.394 kN
Effective contact length; Lb,ef = Lb = 100 mm

Design perpendicular compressive stress – exp.6.4; sc,y,90,d = Fc,y,90,d / (b × Lb,ef) = 0.479 N/mm2
Design perpendicular compressive strength; fc,y,90,d = kmod × ksys × fc.90.k / γM = 1.692 N/mm2
sc,y,90,d / (kc,90 × fc,y,90,d) = 0.189

PASSDesign perpendicular compression strength exceeds design perpendicular compression stress

Check shear force (Section 6.1.7 of EC5)
Design shear force;  Fy,d = 2.394 kN

Design shear stress – exp.6.60; ty,d = 1.5 × Fy,d / (kcr × b × h) = 0.714 N/mm2
Design shear strength;  fv,y,d = kmod × ksys × fv.k / γM = 2.708 N/mm2

ty,d / fv,y,d = 0.264
PASS – Design shear strength exceeds design shear stress

At the end of span

Check compression perpendicular to the grain – cl.6.1.5
Design perpendicular compression – major axis; Fc,y,90,d = 6.572 kN
Effective contact length; Lb,ef = Lb = 100 mm

Design perpendicular compressive stress – exp.6.4;
sc,y,90,d = Fc,y,90,d / (b × Lb,ef) = 1.314 N/mm2
Design perpendicular compressive strength;
fc,y,90,d = kmod × ksys × fc.90.k / γM = 1.692 N/mm2

sc,y,90,d / (kc,90 fc,y,90,d) = 0.518
PASSDesign perpendicular compression strength exceeds design perpendicular compression stress

Check shear force – Section 6.1.7
Design shear force; Fy,d = 3.583 kN
Design shear stress – exp.6.60; ty,d = 1.5 × Fy,d / (kcr × b × h) = 1.070 N/mm2
Design shear strength; fv,y,d = kmod × ksys × fv.k / γM = 2.708 N/mm2
ty,d / fv,y,d = 0.395
PASS – Design shear strength exceeds design shear stress

Check bending moment – Section 6.1.6
Design bending moment; My,d = 1.784 kNm
Design bending stress; sm,y,d = My,d / Wy = 9.517 N/mm2
Design bending strength; fm,y,d = kmod × ksys × fm.k / γM = 16.246 N/mm2
sm,y,d / fm,y,d = 0.586
PASS Design bending strength exceeds design bending stress

Serviceability Limit State

Consider Combination 2 – 1.0Gk + 1.0Qk (Service)
Check y-y axis deflection – Section 7.2
Instantaneous deflection;  dy = 5.3 mm

Quasi-permanent variable load factor; y2 = 0.3
Final deflection with creep; dy,Final = 0.5 × dy × (1 + kdef) + 0.5 × dy × (1 + y2 × kdef) = 8.1 mm

Allowable deflection; dy,Allowable = L / 250 = 12 mm                
dy,Final / dy,Allowable = 0.676

Therefore, the final deflection is acceptable.

It is also typical to check the floor for vibration, but this was not considered in this design.

Question of the day | 23-01-2021

For the structure loaded as shown above, answer the following questions given below. Note that the use of calculators is discouraged. The aim of this question is to improve our ability to predict the expected behaviour of a structure by just glancing at them. Good luck to you.

[1] What is the maximum bending moment in member DE?
(A) 0.5 kNm
(B) 1.0 kNm
(C) 2.0 kNm
(D) 4.0 kNm

[2] What is the value of the shear force at point G, just to the right?
(A) -1.5 kN
(B) +3 kN
(C) -3 kN
(D) +1.5 kNm

[3] What is the value of the bending moment at point C, just to the right?
(A) -3 kNm
(B) 1.5 kNm
(C) +3 kNm
(D) -1 kNm

[4] What is the value of the bending moment, at point F?
(A) -1 kNm
(B) -2 kNm
(c) -3 kNm
(D) -4 kNm

Worked Example | Design of RC beams for Torsion (EN 1992-1:2004)

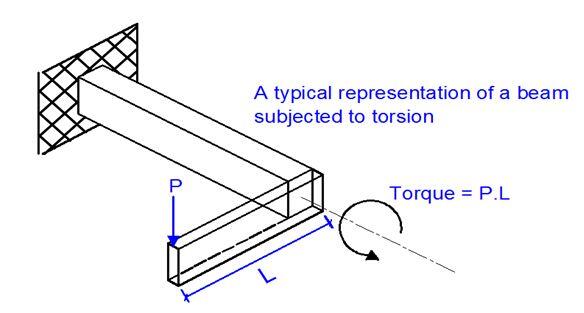
A full torsional design covering the ultimate and serviceability limit states is required when the equilibrium of a structure is dependent on the torsional resistance of the member. Reinforced concrete (RC) beams are subjected to torsion when the point of application of loads does not coincide with the shear centre of the beams. This can be due to the arrangement of the beams or the loading pattern as can be found in circular or canopy beams.

Typical examples of beams subjected to torsion
Fig 1: Typical examples of beams subjected to torsion

According to clause 6.3.1(3) of EN 1992-1:2004, the torsional resistance of a section may be calculated on the basis of a thin-walled closed section, in which equilibrium is satisfied by a closed shear flow. Solid sections may be modelled by equivalent thin-walled sections. Complex shapes, such as T-sections, may be divided into a series of sub-sections, each of which is modelled as an equivalent thin-walled section, and the total torsional resistance taken as the sum of the capacities of the individual elements.

NOTATTIONS AND DEFINITIONS FOR TORSION IN EUROCODE 2
Fig 2: Notations and definitions for torsion in Eurocode 2 [Source: Figure 6.11, EN 1992-1-1:2004]

In Eurocode 2, the shear stress in a wall of a section subject to a pure torsional moment may be calculated from:

τt,itef,i = TEd/2Ak

The shear force VEd,i in a wall i due to torsion is given by:

VEd,i = τt,itef,izi

where;
TEd is the applied design torsion
Ak is the area enclosed by the centre-lines of the connecting walls, including inner hollow areas.
τt,i is the torsional shear stress in wall i
tef,i is the effective wall thickness. It may be taken as A/u, but should not be taken as less than twice the distance between edge and centre of the longitudinal reinforcement. For hollow sections the real thickness is an upper limit
A is the total area of the cross-section within the outer circumference, including inner hollow areas
u is the outer circumference of the cross-section
zi is the side length of wall i defined by the distance between the intersection points with the adjacent walls

The required cross-sectional area of the longitudinal reinforcement for torsion ΣAsl may be calculated from Expression (6.28) of EC2:

ΣAsl/fyd = TEdcotθ/2Ak

where;
uk is the perimeter of the area Ak
fyd is the design yield stress of the longitudinal reinforcement Asl
θ is the angle of compression struts

According to clause 6.3.2(4) of EC2, the maximum resistance of a member subjected to torsion and shear is limited by the capacity of the concrete struts. In order not to exceed this resistance the following condition should be satisfied:

TEd/TRd,max + VEd/VRd,max ≤ 1.0 (Equation 6.29, EC2)

where:
TEd is the design torsional moment
VEd is the design transverse force
TRd,max is the design torsional resistance moment = TRd,max = 2ναcwfcdAktef,isinθcosθ
VRd,max is the maximum design shear resistance according to Expressions (6.9) of EC2

Worked Example

Carry out a full torsional design of a rectangular reinforced concrete (RC) beam subjected to an ultimate torsional moment of 55 kNm, and shear force of 225 kN. The section is 600 x 400 mm, and reinforcement of 4H25 (As,prov = 1964 mm2) has been provided to resist the bending moment. (fck = 28 N/mm2; fyk = 500 N/mm2)

Solution

Concrete strength class; C28/35 ×γα
Characteristic compressive cylinder strength;fck = 28 N/mm2
Partial factor for concrete -Table 2.1N; γC = 1.50
Compression chord stress coefficient – cl.6.2.3(3); αcw = 1.00
Compressive strength coefficient – cl.3.1.6(1); αcc = 0.85
Design compressive concrete strength – exp.3.15;   fcd = αcc × fckC = 15.9 N/mm2
Compressive strength coefficient – cl.3.1.6(1); αccw = 1.00
Design compressive concrete strength – exp.3.15;   fcwd = αccw × fckC = 18.7 N/mm2
Tensile strength coefficient – cl.3.1.6(2); αct = 1.00
Mean value of axial strength of conc. – cl.3.1.6(2);    fctm = 0.3 N/mm2 × (fck)2/3 = 2.77 N/mm2

Characteristic axial strength of conc. (5% factile);    fctk,0.05 = 0.7 × fctm = 1.94 N/mm2
Design axial strength of concrete; fct,d = act × fctk,0.05C = 1.29 N/mm2

Reinforcement details
Characteristic yield strength of reinforcement; fyk = 500 N/mm2
Partial factor for reinforcing steel – Table 2.1N; γS = 1.15
Design yield strength of reinforcement;  fyd = fykS = 435 N/mm2

Beam dimensions
Section width; b = 400 mm
Section depth; h = 600 mm

Design forces
Maximum design torsional moment; TEd,max = 55.0 kNm
Maximum design shear force; VEd,max = 225.0 kN
Area of design longitudinal reinforcement; Asl = 1964 mm2
Effective depth to outer layer; d = 450 mm

equivalent thin walled section for torsion
Fig 3: Equivalent thin-walled section

Torsional resistance (Section 6.3, EC2)

Effective thickness of walls – cl.6.3.2(1); tef,i = (b × h) / (2 × (b + h)) = 120 mm
Area enclosed by centre lines of walls – cl.6.3.2(1);  Ak = (b – tef,i) × (h – tef,i) = 134400 mm2
Perimeter – cl.6.3.2(3); Uk = 2 × ((b – tef,i) + (h – tef,i)) = 1520 mm

Strength reduction factor;  v1 = 0.6 × (1 – fck / 250 N/mm2) = 0.533

Design shear stress; vt,Ed = VEd,max / (b × d) = 1.250 N/mm2

Torsional shear stress in wall – exp.6.26;  tt,Ed = TEd,max / (2 × Ak × tef,i) = 1.705 N/mm2

Concrete strut angle;qt = min[45°, max(0.5 × Asin(min(2 × (vt,Ed / 0.9 + tt,Ed) / (αcw × fcwd × v1), 1)), 21.8°)] = 21.8°

Max design value of torsional resist. mnt – exp 6.30; TRd,max = 2 × v1 × αcw × fcd × Ak × tef,i × sin(qt) × cos(qt) = 94.0 kNm

Max design shear force – exp.6.9; VRdt,max = acw × b × 0.9 × d × v1 × fcwd / (cot(qt) + tan(qt)) = 555.6 kN

Interaction formulae – exp.6.29; TEd,max / TRd,max + VEd,max / VRdt,max = 0.990

PASSconcrete section is adequate

Torsional and shear resistance of the concrete alone

Maximum torsional resist moment with no shear reinf. – cl.6.3.2(5);  TRd,c = 2 × Ak × fct,d × tef,i = 41.6 kNm
Shear resistance constant – cl.6.2.2; CRd,c = 0.18/γC = 0.120
Reinforcement ratio – cl.6.2.2; rl = min(Asl/(d × b), 0.02) = 0.011
Effective depth factor – cl.6.2.2; kv = min(1 + √(200mm/d), 2) = 1.667

Minimum shear stress; vmin = 0.035 N/mm2 × kv3/2 × (fck / 1N/mm2)0.5 = 0.4 N/mm2

Design value for shear resistance – exp.6.2.a;   VRd,c = max(CRd,c × kv × 1N/mm2 × (100 × rl × fck/1N/mm2)1/3 × b × d, vmin × b × d) = 112.5 kN

Interaction formulae – exp.6.31; TEd,max / TRd,c + VEd,max / VRd,c = 3.320
Therefore, additional reinforcement required

Required torsional reinforcement
Required area of add. long. reinf. for torsion (6.28); Asl,req = TEd,max × Uk × cot(qt) / (2 × Ak × fyd) = 1788 mm2
Provide 10Y16 side bars (5 on each face) for torsion (Asprov = 2010 mm2)

The longitudinal bars should be arranged so there is at least one bar at each corner with the other spaced around the periphery of the links at a spacing of 350mm or less (cl.9.2.3(4))

Required shear reinforcement for torsion (one leg); Asw,req = TEd,max / (2 × Ak × fyd × cot(qt)) = 188 mm2/m
Maximum spacing for torsion shear reinforcement;  sw,max = min(Uk/8, b, h) = 190 mm

Provide 2 legs H10@175 c/c as torsion/shear reinforcement

[Featured Image Credit] Chai H.K., Majeed A.A., Allawi A.A (2015): Torsional Analysis of Multicell Concrete Box Girders Strengthened with CFRP Using a Modified Softened Truss Model. ASCE Journal of Bridge Engineering, 20(8) https://doi.org/10.1061/(ASCE)BE.1943-5592.0000621

To download this article in PDF format, click HERE

Worked Example | Analysis and Design of Steel Sheet Pile Wall (EN 1997-1)

This article contains a solved example of the analysis and design of steel sheet pile walls in accordance with BS EN1997-1:2004 – Code of Practice for Geotechnical design and the UK National Annex.

sheet pile wall

Geometry
Total length of sheet pile provided Hpile = 14500 mm
Number of different types of soil Ns = 2
Retained height of soil dret = 3500 mm
Depth of unplanned excavation dex = 500 mm
Total retained height ds = 4000 mm
Angle of retained slope β = 0.0 deg
Depth from ground level to top of water table retained side dw = 1500 mm
Depth from ground level to top of water table retaining side;  dwp = 4000 mm

Loading
Variable surcharge po,Q = 10.0 kN/m2

Soil layer 1
Characteristic shearing resistance angle ϕ’k,s1 = 30.0 deg
Characteristic wall friction angle  δk,s1 = 20.0 deg
Moist density of soil γm,s1 = 15.0 kN/m3
Characteristic saturated density of retained soil γs,s1 = 17.0 kN/m3
Height of soil 1  h1 = 8500 mm

Soil layer 2
Characteristic shearing resistance angle f’k,s2 = 27.0 deg
Characteristic wall friction angle dk,s2 = 16.0 deg
Moist density of soil γm,s2 = 16.0 kN/m3
Characteristic saturated density of retained soil γs,s2 = 19.0 kN/m3
Height of soil 2 h2 = 7000 mm

Partial factors on actions – Section A.3.1 – Combination 1
Permanent unfavourable action γG = 1.35
Permanent favourable action γG,f = 1.00
Variable unfavourable action γQ = 1.50
Angle of shearing resistance γϕ’ = 1.00
Weight density γg = 1.00

Design soil properties – soil 1
Design effective shearing resistance angle ϕ’d = tan-1[tan(ϕ’k)/γϕ’] = 30.0 deg
Design wall friction angle  δd = tan-1[tan(ϕk)/γϕ’] = 20.0 deg
Design moist density of retained soil γm.d1 = γmγ = 15.0 kN/m3
Design saturated density of retained soil γs.d1 = γsγ = 17.0 kN/m3
Design buoyant density of retained soil γd.d1 = γs.d1 – γw = 7.2 kN/m3

Active pressure using Coulomb theory Ka1 = sin(α + ϕ’d)2 / (sin(α)2 × sin(α – δd) × (1 + √(sin(ϕ’d + δd) × sin(ϕ’d – β)/(sin(α – δd) × sin(α + β))))2) = 0.297

Passive pressure using Coulomb theory Kp1 = sin(90 – ϕ’d)2 / (sin(90 + δd) × [1 – √[sin(ϕ’d + δd) × sin(ϕ’d) / (sin(90 + δd))]]2) = 6.105

Design soil properties – soil 2
Design effective shearing resistance angle ϕ’d = tan-1(tan(ϕ’k) /γϕ’) = 27.0 deg
Design wall friction angle  δd = tan-1(tan(δk)/γϕ’) = 16.0 deg
Design moist density of retained soil γm.d2 = γmγ = 16.0 kN/m3
Design saturated density of retained soil γs.d2 = γsγ = 19.0 kN/m3
Design buoyant density of retained soil γd.d2 = γs.d2 – γw = 9.2 kN/m3

Active pressure using Coulomb theory Ka2 = sin(α + ϕ’d)2 / (sin(α)2 × sin(α – δd) × (1 + √(sin(ϕ’d + δd) × sin(ϕ’d – β) / (sin(α – δd) × sin(α + β))))2) = 0.336

Passive pressure using Coulomb theory Kp2 = sin(90 – ϕ’d)2 / (sin(90 + δd) × [1 – √[sin(ϕ’d + δd) × sin(ϕ’d) / (sin(90 + δd))]]2) = 4.416

balanced pressure diagram of sheet pile wall

Overburden on the active side
Overburden at 0 mm below GL in soil 1; OB’a11 = po,Q × γQ = 15.0 kN/m2
Overburden at 1500 mm below GL in soil 1; OB’a21 = γG × γm.d1 × ha1 + OB’a11 = 45.4 kN/m2
Overburden at 4000 mm below GL in soil 1; OB’a31 = γG × γd.d1 × ha2 + OB’a21 = 69.6 kN/m2
Overburden at 8500 mm below GL in soil 1; OB’a41 = γG × γd.d1 × ha3 + OB’a31 = 113.3 kN/m2
Overburden at 8500 mm below GL in soil 2; OB’a42 = γG × γd.d1 × ha3 + OB’a31 = 113.3 kN/m2
Overburden at 11544 mm below GL in soil 2; OB’a51 = γG × γd.d2 × ha4 + OB’a42 = 151.1 kN/m2

Overburden on the passive side
Overburden at 4000 mm below GL in soil 1; OB’p31 = 0 kN/m2 = 0.0 kN/m2
Overburden at 8500 mm below GL in soil 1; OB’p41 = γG,f × γd.d1 × hp3 + OB’p31 = 32.4 kN/m2
Overburden at 8500 mm below GL in soil 2; OB’p42 = γG,f × γd.d1 × hp3 + OB’p31 = 32.4 kN/m2
Overburden at 11544 mm below GL in soil 2; OB’p51 = γG,f × γd.d2 × hp4 + OB’p42 = 60.3 kN/m2

Pressure on the active side
Active at 0 mm below GL in soil 1; p’a11 = Ka1 × OB’a11 = 4.5 kN/m2
Active at 1500 mm below GL in soil 1; p’a21 = Ka1 × OB’a21 = 13.5 kN/m2
Active at 4000 mm below GL in soil 1; p’a31 = Ka1 × OB’a31 + γγ × γw × (dL3 – dw) = 53.8 kN/m2
Active at 8500 mm below GL in soil 1; p’a41 = Ka1 × OB’a41 + γγ × γw × (dL4 – dw) = 126.4 kN/m2
Active at 8500 mm below GL in soil 2; p’a42 = Ka2 × OB’a42 + γγ × γw × (dL4 – dw) = 130.8 kN/m2
Active at 11544 mm below GL in soil 2; p’a51 = Ka2 × OB’a51 + γγ × γw × (dL5 – dw) = 183.8 kN/m2

Pressure on the passive side
Passive at 4000 mm below GL in soil 1; p’p31 = Kp1 × OB’p31 + γG,f × γw × (dL3 – max(ds, dw)) = 0.0 kN/m2
Passive at 8500 mm below GL in soil 1; p’p41 = Kp1 × OB’p41 + γG,f × γw × (dL4 – max(ds, dw)) = 241.7 kN/m2
Passive at 8500 mm below GL in soil 2; p’p42 = Kp2 × OB’p42 + γG,f × γw × (dL4 – max(ds, dw)) = 187.0 kN/m2
Passive at 11544 mm below GL in soil 2; p’p51 = Kp2 × OB’p51 + γG,f × γw × (dL5 – max(ds, dw)) = 340.4 kN/m2

By iteration the depth at which the active moments equal the passive moments has been determined as 11544 mm as follows:-

Active moment about 11544 mm

Moment level 1;Ma11 = 0.5 × p’a11 × ha1 × ((H – dL2) + 2/3 × ha1) = 36.9 kNm/m
Moment level 1; Ma12 = 0.5 × p’a21 × ha1 × ((H – dL2) + 1/3 × ha1) = 106.7 kNm/m
Moment level 2; Ma21 = 0.5 × p’a21 × ha2 × ((H – dL3) + 2/3 × ha2) = 155.3 kNm/m
Moment level 2; Ma22 = 0.5 × p’a31 × ha2 × ((H – dL3) + 1/3 × ha2) = 563.5 kNm/m
Moment level 3; Ma31 = 0.5 × p’a31 × ha3 × ((H – dL4) + 2/3 × ha3) = 731.8 kNm/m
Moment level 3; Ma32 = 0.5 × p’a41 × ha3 × ((H – dL4) + 1/3 × ha3) = 1292.3 kNm/m
Moment level 4; Ma41 = 0.5 × p’a42 × ha4 × ((H – dL5) + 2/3 × ha4) = 404.0 kNm/m
Moment level 4; Ma42 = 0.5 × p’a51 × ha4 × ((H – dL5) + 1/3 × ha4) = 283.8 kNm/m

Passive moment about 11544 mm

Moment level 3; Mp31 = 0.5 × p’p31 × hp3 × ((H – dL4) + 2/3 × hp3) = 0.0 kNm/m
Moment level 3; Mp32 = 0.5 × p’p41 × hp3 × ((H – dL4) + 1/3 × hp3) = 2471.0 kNm/m
Moment level 4; Mp41 = 0.5 × p’p42 × hp4 × ((H – dL5) + 2/3 × hp4) = 577.6 kNm/m
Moment level 4; Mp42 = 0.5 × p’p51 × hp4 × ((H – dL5) + 1/3 × hp4) = 525.7 kNm/m

Total moments about 11544 mm

Total active moment; SMa = 3574.5 kNm/m
Total passive moment; SMp = 3574.5 kNm/m

Required pile length
Length of pile required to balance moments; H = 11544 mm

Depth of equal pressure; dcontra = 5432 mm
Add 20% below this point; de_add = 1.2 × (H – dcontra) = 7334 mm

Minimum required pile length; Htotal = dcontra + de_add = 12766 mm

PassProvided length of sheet pile greater than the minimum required length of the pile

Pile capacity (EN1993-5)
Maximum moment in pile (from analysis); Mpile = max(abs(Mmin), abs(Mmax)) / 1m = 547.0 kNm/m
Maximum shear force in pile (from analysis); Vpile = 364.7 kN/m
Nominal yield strength of pile; fy_pile = 355 N/mm2
Name of sheet pile;  Arcelor PU(18)
Classification of pile; 2
Plastic modulus of pile; Wpl.y = 2134 cm3/m

steel sheet pile wall section and tables

Shear buckling of web (cl.5.2.2(6))
Width of section; c = h / sin(αpile) = 510 mm
Thickness of web;  tw = s = 9.0 mm
ε = √(235/fy_pile) = 0.814
c/tw = 56.6 = 69.6ε < 72ε
PASS – Shear buckling of web within limits

Bending 2
Interlock reduction factor (cl.5.2.2); βB = 1
Design bending resistance (eqn.5.2);                         
Mc,Rd = Wpl.y × fy_pile × βB / γM0 = 757.6 kNm/m
PASSMoment capacity exceeds moment in pile

Shear
Projected shear area of web (eqn.5.6); Av = s × (h – t) = 3769 mm2
Design shear resistance (eqn.5.5); Vpl,Rd = Av × fy_pile / (√(3) × γM0) / b = 1287.6 kN/m
PASSShear capacity exceeds shear in pile

Partial factors on actions – Section A.3.1 – Combination 2

Permanent unfavourable action;  γG = 1.00
Permanent favourable action; γG,f = 1.00
Variable unfavourable action; γQ = 1.30
Angle of shearing resistance; γϕ’ = 1.25
Weight density; γγ = 1.00

Design soil properties – soil 1
Design effective shearing resistance angle; ϕ’d = tan-1(tan(ϕ’k)/γϕ’) = 24.8 deg
Design wall friction angle;  δd = tan-1(tan(δk)/γϕ’) = 16.2 deg
Design moist density of retained soil; γm.d1 = γmγ = 15.0 kN/m3
Design saturated density of retained soil; γs.d1 = γsγ = 17.0 kN/m3
Design buoyant density of retained soil; γd.d1 = γs.d1 – γw = 7.2 kN/m3

Active pressure using Coulomb theory; Ka1 = sin(α + ϕ’d)2 / (sin(α)2 × sin(α – δd) × (1 + √(sin(ϕ’d + δd) × sin(ϕ’d – β)/(sin(α – δd) ´ sin(α + β))))2) = 0.364

Passive pressure using Coulomb theory; Kp1 = sin(90 – ϕ’d)2 / (sin(90 + δd) × [1 – √[sin(ϕ’d + δd) × sin(ϕ’d) / (sin(90 + δd))]]2) = 3.977

Design soil properties – soil 2

Design effective shearing resistance angle; ϕ’d2 = tan-1(tan(ϕ’k)/γϕ’) = 22.2 deg
Design wall friction angle; δd2 = tan-1(tan(δk)/γϕ’) = 12.9 deg
Design moist density of retained soil; γm.d2 = γmγ = 16.0 kN/m3
Design saturated density of retained soil; γs.d2 = γsγ = 19.0 kN/m3
Design buoyant density of retained soil; γd.d2 = γs.d2 – γw = 9.2 kN/m3

Active pressure using Coulomb theory; Ka2 = sin(α + ϕ’d)2 / (sin(α)2 × sin(α – δd) × (1 + √(sin(ϕ’d + δd) × sin(ϕ’d – β) / (sin(α – δd) × sin(α + β))))2) = 0.406

Passive pressure using Coulomb theory; Kp2 = sin(90 – ϕ’d)2 / (sin(90 + δd) × [1 – √[sin(ϕ’d + δd) × sin(f’d) / (sin(90 + δd))]]2) = 3.154

pressure diagram of sheet pile wall

Overburden on the active side
Overburden at 0 mm below GL in soil 1; OB’a11 = po,Q × γQ = 13.0 kN/m2
Overburden at 1500 mm below GL in soil 1;  OB’a21 = γG × γm.d1 × ha1 + OB’a11 = 35.5 kN/m2
Overburden at 4000 mm below GL in soil 1; OB’a31 = γG × γd.d1 × ha2 + OB’a21 = 53.5 kN/m2
Overburden at 8500 mm below GL in soil 1; OB’a41 = γG × γd.d1 × ha3 + OB’a31 = 85.8 kN/m2
Overburden at 8500 mm below GL in soil 2; OB’a42 = γG × γd.d1 × ha3 + OB’a31 = 85.8 kN/m2
Overburden at 12532 mm below GL in soil 2;OB’a51 = γG × γd.d2 × ha4 + OB’a42 = 122.9 kN/m2

Overburden on the passive side
Overburden at 4000 mm below GL in soil 1; OB’p31 = 0 kN/m2 = 0.0 kN/m2
Overburden at 8500 mm below GL in soil 1; OB’p41 = γG,f × γd.d1 × hp3 + OB’p31 = 32.4 kN/m2
Overburden at 8500 mm below GL in soil 2; OB’p42 = γG,f × γd.d1 × hp3 + OB’p31 = 32.4 kN/m2
Overburden at 12532 mm below GL in soil 2;OB’p51 = γG,f × γd.d2 × hp4 + OB’p42 = 69.4 kN/m2

Pressure on the active side

Active at 0 mm below GL in soil 1; p’a11 = Ka1 × OB’a11 = 4.7 kN/m2
Active at 1500 mm below GL in soil 1; p’a21 = Ka1 × OB’a21 = 12.9 kN/m2
Active at 4000 mm below GL in soil 1; p’a31 = Ka1 × OB’a31 + γG × γw × (dL3 – dw) = 44.0 kN/m2
Active at 8500 mm below GL in soil 1; p’a41 = Ka1 × OB’a41 + γG × γw × (dL4 – dw) = 99.9 kN/m2
Active at 8500 mm below GL in soil 2; p’a42 = Ka2 × OB’a42 + γG × γw × (dL4 – dw) = 103.5 kN/m2
Active at 12532 mm below GL in soil 2; p’a51 = Ka2 × OB’a51 + γG × γw × (dL5 – dw) = 158.1 kN/m2

Pressure on the passive side

Passive at 4000 mm below GL in soil 1; p’p31 = Kp1 × OB’p31 + γG,f × γw × (dL3 – max(ds, dw)) = 0.0 kN/m2
Passive at 8500 mm below GL in soil 1; p’p41 = Kp1 × OB’p41 + γG,f × γw × (dL4 – max(ds, dw)) = 172.8 kN/m2
Passive at 8500 mm below GL in soil 2;p’p42 = Kp2 × OB’p42 + γG,f × γw × (dL4 – max(ds, dw)) = 146.2 kN/m2
Passive at 12532 mm below GL in soil 2; p’p51 = Kp2 × OB’p51 + γG,f × γw × (dL5 – max(ds, dw)) = 302.7 kN/m2

By iteration the depth at which the active moments equal the passive moments has been determined as 12533 mm as follows:-

Active moment about 12533 mm

Moment level 1; Ma11 = 0.5 × p’a11 × ha1 × ((H – dL2) + 2/3 × ha1) = 42.7 kNm/m
Moment level 1; Ma12 = 0.5 × p’a21 × ha1 × ((H – dL2) + 1/3 × ha1) = 111.8 kNm/m
Moment level 2; Ma21 = 0.5 × p’a21 × ha2 × ((H – dL3) + 2/3 × ha2) = 164.8 kNm/m
Moment level 2; Ma22 = 0.5 × p’a31 × ha2 × ((H – dL3) + 1/3 × ha2) = 515.1 kNm/m
Moment level 3; Ma31 = 0.5 × p’a31 × ha3 × ((H – dL4) + 2/3 × ha3) = 696.2 kNm/m
Moment level 3; Ma32 = 0.5 × p’a41 × ha3 × ((H – dL4) + 1/3 × ha3) = 1244.0 kNm/m
Moment level 4; Ma41 = 0.5 × p’a42 × ha4 × ((H – dL5) + 2/3 × ha4) = 561.3 kNm/m
Moment level 4; Ma42 = 0.5 × p’a51 × ha4 × ((H – dL5) + 1/3 × ha4) = 428.7 kNm/m

Passive moment about 12533 mm

Moment level 3; Mp31 = 0.5 × p’p31 × hp3 × ((H – dL4) + 2/3 × hp3) = 0.0 kNm/m
Moment level 3; Mp32 = 0.5 × p’p41 × hp3 × ((H – dL4) + 1/3 × hp3) = 2151.5 kNm/m
Moment level 4; Mp41 = 0.5 × p’p42 × hp4 × ((H – dL5) + 2/3 × hp4) = 792.7 kNm/m
Moment level 4; Mp42 = 0.5 × p’p51 × hp4 × ((H – dL5) + 1/3 × hp4) = 820.5 kNm/m

Total moments about 12533 mm

Total active moment; SMa = 3763.9 kNm/m
Total passive moment; SMp = 3763.7 kNm/m

Required pile length
Length of pile required to balance moments; H = 12533 mm

Depth of equal pressure; dcontra = 5694 mm
Add 20% below this point; de_add = 1.2 × (H – dcontra) = 8207 mm
Minimum required pile length; Htotal = dcontra + de_add = 13901 mm

PASS – Provided length of sheet pile greater than the minimum required length of pile

Pile capacity (EN1993-5)

Maximum moment in pile (from analysis); Mpile = max(abs(Mmin), abs(Mmax)) / 1m = 549.1 kNm/m
Maximum shear force in pile (from analysis); Vpile = 358.1 kN/m
Nominal yield strength of pile; fy_pile = 355 N/mm2
Name of pile;  Arcelor PU(18)
Classification of pile; 2
Plastic modulus of pile; Wpl.y = 2134 cm3/m

Shear buckling of web (cl.5.2.2(6))

Width of section; c = h / sin(apile) = 510 mm
Thickness of web; tw = s = 9.0 mm
ε = √(235/fy_pile)= 0.814
c / tw = 56.6 = 69.6ε < 72ε

PASSShear buckling of web within limits

Bending
Interlock reduction factor (cl.5.2.2); βB = 1
Design bending resistance (eqn.5.2);Mc,Rd = Wpl.y × fy_pile × βB / γM0 = 757.6 kNm/m

PASSMoment capacity exceeds moment in pile

Shear
Projected shear area of web (eqn.5.6); Av = s × (h – t) = 3769 mm2
Design shear resistance (eqn.5.5); Vpl,Rd = Av × fy_pile / (√(3) × γM0) / b = 1287.6 kN/m

PASSShear capacity exceeds shear in the pile

To obtain this article in PDF format, click HERE (premium, but very affordable).

Cement Replacement Materials (CRM) in Concrete

Cement replacement materials (CRM) are materials that can be used for substituting cement in the production of concrete or other cementitious products. For a material to be used as a cement replacement material, it must possess pozzolanic properties. In the recent wake of the need to produce sustainable concrete, conserve the environment, reduce greenhouse effects in construction, and modify the properties of concrete, the use of industrial and agricultural wastes have found wide applications as cement replacement materials.

Some basic examples of cement replacement materials are;

  1. Fly ash (Pulverised Fuel Ash)
  2. Ground Granulated Blast-furnace Slag (GGBS)
  3. Silica fume
  4. Limestone fines
  5. Rice husk ash
  6. Palm oil fuel ash
  7. Sugarcane bagasse ash

It is important to note that while fly ash, GGBS, silica fume, and limestone fines are industrial wastes, rice husk ash, palm oil fuel ash, and sugarcane bagasse ash are agricultural wastes. The use of so many other agro-wastes has also been investigated by researchers. The utilisation of these wastes in the production of concrete can reduce the carbon footprint associated with the construction industry, and at the same time help to solve the problems of waste disposal.

To varying degrees, these substitutes can be used in the partial replacement of cement due to the fact they can hydrate and cure like portland cement. Furthermore, they are “pozzolans,” which provide silica that reacts with hydrated lime, an unwanted by-product of concrete curing. While industrial byproducts are directly used as substitutes of cement, the agricultural wastes are usually burned in a controlled environment/temperature and ground finely before the ash can be used as a pozzolan.

If the silica, aluminum, and iron oxides obtained after burning the agricultural wastes are not up to 70%, the material will not function properly as a cement substitute. These are some of the drawbacks of using agricultural wastes. Furthermore, it is usually challenging to obtain a large quantity of agricultural wastes that can be used to execute a large-scale project when compared with industrials wastes.

Having said that, let us look at the properties of these cement replacement materials and how they influence the properties of concrete.

Fly Ash

Fly ash is a fine powder derived by burning pulverised coal with or without other combustion materials. It contains pozzolanic properties and consists mainly of aluminum oxide (Al203) and silicon oxide (SiO2). Typically, it is obtained as a byproduct of the combustion of coal from power stations. The ‘ash’ is recovered from the gases and used, amongst other functions, as a cement substitute. Fly ash can only be used as a partial replacement for cement because it relies on the water and lime from the cement to hydrate as part of the overall chemical reaction.

fly ash as a cement replacement materials
Fig 1: Fly ash

The use of fly ash offers beneficial properties to fresh and hardened concrete. It improves the workability of fresh concrete, the strength, and durability of hardened concrete. Furthermore, it is cost-effective and reduces the quantity of cement required for construction.  Typically, 15 percent to 30 percent of the portland cement is replaced with fly ash, with even higher percentages used for mass concrete placements. To achieve this, an equivalent or greater weight of fly ash is substituted for the cement removed.

In a 2017 study published in India, the following are the results of partial replacement of cement with fly ash;

S/No% of fly ashfck (7 days)fck (14 days)fck – 28 days
1026.736.740.2
21027.438.2541.9
32028.339.543.23
43030.2541.445.28
54027.7537.7442.00
65025.537.0339.15

As can be seen from the research, the replacement of cement with 20 – 30% fly ash gave better 28-days compressive strength than normal concrete. According to a 2010 study published in Poland, the concrete specimens containing 20 % of fly ash, related to cement mass, gained a compressive strength about 25% higher than normal concrete after 180 days of curing.

Ground Granulated Blast-furnace Slag (GGBS)

Ground-granulated blast-furnace slag (GGBS) is obtained by quenching molten iron slag (a by-product of iron and steel-making) from a blast furnace in water or steam, to produce a glassy, granular product that is then dried and ground into a fine powder. GGBS has off-white or near-white color and it exhibits excellent cementitious property when finely ground and combined with Portland cement.

GGBS
Fig 2: Ground-granulated blast-furnace slag (GGBS)

Essentially, GGBS comprises silicates and alumina silicates of calcium and other bases that are manufactured in a blast furnace under molten conditions simultaneously with the iron. The chemical composition of oxides in GGBS is similar to that of Portland cement, but the proportion varies.

The fineness of GGBS is a very important parameter when it is to be used in concrete production. This is measured by the specific surface area, and it controls the reactivity of GGBS with cement. Generally, increased fineness of GGBS results in better strength development, but in practice, fineness is limited by economic and performance considerations and factors such as setting times and shrinkage.

In a study carried out in the UK in the year 2017 on the strength development of concrete produced with GGBS, three environmental curing conditions were simulated in the laboratory;

C1 – Summer curing environment
C2 – Winter curing environment
C3 -Normal water curing environment

From the study, the 28-day compressive strength of concrete produced with GGBS are given below;

S/No% of GGBS28-day fck for C128-day fck for C2 28-day fck C3
1056.055.057.5
23056.549.058.5
34057.048.058.0
45053.047.554.0


As can be seen from the research result, the maximum 28-day compressive strength was obtained at 30% partial replacement of cement with GGBS under normal temperature curing conditions. In another study carried out by Vinayak and Nagendra (2014), the maximum compressive strength of grade 20 concrete was achieved at 30% of GGBS replacement of cement.

However, the negative effect of GGBS replacement on mechanical strength has been observed very noticeably for 60 % and 80 % replacement. For all days, the compressive strength of cement mortar was observed to decrease severely at early ages with the increased replacement levels of GGBS in cement.

Silica Fume

Silica fume is an ultrafine powder collected as a by-product of silicon and ferrosilicon alloy production. The raw materials are coal, quartz, and woodchips. It is basically an amorphous (non-crystalline) polymorph of silicon dioxide, silica.

Silica fumes consist of spherical particles with an average particle diameter of 150 nm. The surface area of silica fume particles is about six times that of cement because they are finer than cement. As a pozzolan and filler material, it can improve the strength and durability of hardened concrete. Due to the high surface area and high content of amorphous silica in silica fume, this highly active pozzolana reacts more quickly than ordinary pozzolans.

silica fume powder
Fig 3: Silica fume

Many experiments have shown that the addition of silica fume to concrete increases the compressive strength of concrete by between 30% and 100% depending on the type of cement, type of mix, use of plasticizers, amount of silica fume, aggregates type, and curing regimes.

In a 2012 study carried out in India, the effects of silica fume on the 7-days and 28-days compressive strength of concrete are shown in the table below;

S/No% of silica fumefck – 7 daysfck – 28 days
1025.2138.30
2529.3341.29
31034.1246.76
41538.3047.30
52035.9044.27

As can be seen from the study, the optimum partial replacement of cement with silica fume for maximum compressive strength of concrete occurred at 15%. Sakr (2006) reported that at 15% silica fume content, the compressive strength of concrete increased by 23.33% at 7 days, 21.34% at 28 days, 16.50% at 56 days, and 18.00% at 90 days.

Due to economic considerations, the use of silica fume is generally limited to high strength concretes or concretes in aggressive environmental conditions. The most commonly used proportion of silica fume in the UK – produced combinations is 10% by mass of total cementitious content.

Limestone Fines

Limestone fines is a powder that is obtained from the processing of limestone in quarries. According to concrete.org.uk, there is uncertainty over whether limestone fines should be classified as a Type I (nearly inert as a filler aggregate) or Type II addition (with pozzolanic or latent hydraulic properties, for example, materials like fly ash and GGBS).

Limestone is less reactive than either fly ash or GGBS, but research shows that it can have slight reactivity as well as beneficial physical effects conferred by virtue of its fine particle size.

BS 7979:2016 gives guidance on the use of limestone fines with Portland Cement.

According to Lomboy et al (2016), there are two methods by which limestone fines are incorporated into cementitious systems. The first is by addition, whereby limestone fines are to replace a percentage of cementitious materials or as filler, which is added during the mixing process. The other method is by co-grinding with Portland cement clinker, making the limestone a component of Portland cement.

In the study of Lomboy et al (2016), the effect of limestone fines replacement of cement is shown below.

Effect of limestone fines on compressive strength of concrete
Fig 4: Type I cement with limestone fines mortar compressive strength (Lomboy et al, 2016)
type 1p cement
Fig 5: Type IP cement with limestone fines mortar compressive strength (Lomboy et al, 2016)

Limestone fines used to replace Type IP (with 25% fly ash) cement slightly improved (e.g., 5% to 10%) concrete compressive strength. However, the replacement for Type I (normal portland) cement decreased the compressive strength. This is likely due to the size of the limestone fines being complementary to the combination of cement and fly ash to improve packing on Type IP. In addition, there may be a chemical interaction between the fly ash in Type IP and limestone fines, which also facilitates concrete strength gain.

Rice Husk Ash

Rice husk ash (RHA) is one of the promising pozzolanic materials that can be blended with Portland cement for the production of durable concrete. Under controlled burning, and if sufficiently ground, the ash that is produced can be used as a cement replacement material in concrete.

In a 2009 study carried out in Nigeria, the effects of partial replacement of concrete with RHA is shown below;

S/No% of RHAfck – 7 daysfck – 28 days
1028.032.3
21022.128.5
32018.624.3
43016.322.4
54014.418.2
6509.211.5

It can be seen from the table that the addition of RHA reduced the compressive strength of concrete. It always recommended that the optimum dosage of rice husk ash in concrete should be 10%, unless other effects apart from compressive strength are desired.

Palm Oil Fuel Ash

Palm oil fuel ash (POFA) is a by-product obtained during the burning of waste materials such as palm kernel shell, palm oil fiber, and palm oil husk. They are usually generated from biomass power plants, where palm oil residues such as fibers, shells, and empty fruit bunches are burned to generate electricity. The ash can be utilized to partially replace cement in a concrete mix due to its pozzolanic properties.

In a 2017 study carried out in Thailand, the effects of POFA on the compressive strength of concrete using water/binder ratio of 0.4 is shown the table below;

S/No% of POFAfck – 28 daysfck – 90 days
1050.255.9
21546.252.8
32543.350.9
43540.045.8

From the study, it can be seen that the replacement of POFA in OPC at 15 and 35% by weight of binder had strengths of 94–80% of the control concrete at 28 and 90 days. In addition, the use of ground POFA in the concrete required slightly higher amounts of superplasticizer than those required by the control concrete.

Sugarcane Bagasse Ash

Sugarcane bagasse is an agricultural waste that can be transformed to a pozzolan by burning it in a controlled environment and grinding it finely into a cement replacement material for various cementing purposes.

Ina 2017 study carried out in Malaysia, the effect of sugarcane bagasse ash on the compressive strength of concrete is given in the table below;

S/No% of SCBAfck – 7 daysfck – 14 daysfck – 28 days
1017.1620.3325.525
2520.9225.1128.5
31019.22521.0926.4

From the research result it can be seen that the optimum replace of cement with sugarcane bagasse ash in concrete is 5%.

Unlinked References
[1] Vinayak A., and Nagendra M. V (2014): Analysis of Strength Characteristics of GGBS Concrete, Int J Adv Engg Tech, Vol. 5, No. 2, pp. 82–84,
[2] Sakr K. (2006): Effects of Silica Fume and Rice Husk Ash on the Properties of Heavy Weight Concrete. ASCE Journal of Materials in Civil Engineering Vol. 18, Issue 3 https://doi.org/10.1061/(ASCE)0899-1561(2006)18:3(367)

To download this article in PDF format, click HERE.

The Problems of Using Timber in Building Construction

In the late 19th and early 20th century, timber was used extensively in building construction, till the development of concrete and steel, which saw their use reduced. However, improvements in engineered wood products have resuscitated the use of timber in building construction.

Furthermore, environmental concerns, coupled with modern manufacturing technologies and prefabrication in timber that are able to produce building components that far exceed their old-growth ancestors, have enabled engineers to design and build larger and taller timber buildings than ever before [1].

However, the use of timber in building construction is not without problems and challenges. This is basically because timber is a natural and very complex material. Researchers from the Institute of Structural Engineering (IBK), Swiss Federal Institute of Technology (ETH) have highlighted some of the challenges of using timber in building construction. This was published in volume 227 of Elsevier- Engineering Structures journal.

According to the researchers, despite the numerous beneficial properties and benefits of timber buildings, there are some important challenges that must be highlighted, particularly for tall timber buildings. These are;

(1) Sensitivity to moisture: Timber is a natural grown, hygroscopic material which degrades significantly when it remains wet for a long time. From light swelling to complete loss of structural strength due to fungi attack, it is very important to design timber to remain protected from high moisture in its structural lifetime, particularly for highly loaded components.

decaying timber

(2) Light weight: The timber used in construction is approximately 5 times less dense than reinforced concrete and 15 times less dense than structural steel. The direct advantage of a lighter building with smaller foundations has the pitfall of being much more sensitive to critical lateral loads as the height of the building increases.

(3) Orthotropic: As a natural grown material, the properties of timber are not the same in every direction. Timber is strong along the fibres, but very weak across them. Failing to address this can have catastrophic consequences.

(4) Low stiffness: The timber used in construction is approximately 3 times less stiff than reinforced concrete and 20 times less stiff than structural steel. At increasing heights this can have a severe impact on deflections, accelerations, and occupant comfort. Furthermore, and combined with the orthotropic behaviour, it becomes challenging to construct stiff, moment resisting connections.

(5) Brittleness: Any timber member under tension, bending and shear is brittle in failure, although with careful design ductility can be achieved, in particular in connections with steel fasteners. Brittle behaviour is particularly unwelcome when a structure is called to redistribute loads, for example in the case of an accidental event requiring robustness.

(6) System effects: Although this applies to all materials, the way loads are distributed in a system is less clear, particularly for heterogeneous timber components. In the case of large timber structures subject to abnormal loads and potential damage, better knowledge of system behaviour is important.

(7) Size effects: A significant overall strength reduction is possible in the case of a large structural element. This applies to all materials, however the size effects in very large timber elements are still rather unknown, with preliminary indications that they can be significant.

(8) Time effects: Timber creeps with time, which can be critical in heavily loaded structures like tall timber buildings. Differential settlement in hybrid buildings including loadbearing timber elements is even more challenging.

The above properties make the design of a timber building everything but straightforward, particularly at larger scales.

[Source] Voulpiotis K., Jochen K., Jockwer R., Frangi A. (2021): A holistic framework for designing for structural robustness in tall timber buildings, Engineering Structures, Volume 227 https://doi.org/10.1016/j.engstruct.2020.111432 (http://www.sciencedirect.com/science/article/pii/S0141029620340335)

Question of the day | 07-01-2020

For the frame loaded as shown above, answer the following question;

(1) What is the horizontal reaction at point D?
[A] 0.5 kN
[B] 1.0 kN
[C] 2.0 kN
[D] 4.0 kN

(2) What is vertical support reaction at point A?
[A] -0.5 kN
[B] 0.5 kN
[C] -1.0 kN
[D] 1.0 kN

(3) What is the most likely bending moment diagram of the structure?

A
B
C

Have you registered for Structville’s first webinar of the year on bridge design? See the flyer below for more.

bridge design webinar

Click HERE to register. There will be free design materials and video tutorials for all the participants.

bridge design 1

To learn more about this webinar, click HERE. Thank you for supporting Structville.