The management of public projects includes making good decisions, and these decisions usually involve choosing between alternatives. Therefore, every decision-maker needs to answer questions like what public projects to implement, how to begin, how many project units are required, and where and when to execute these projects. Economic analysis helps the decision-maker to determine answers to these questions.
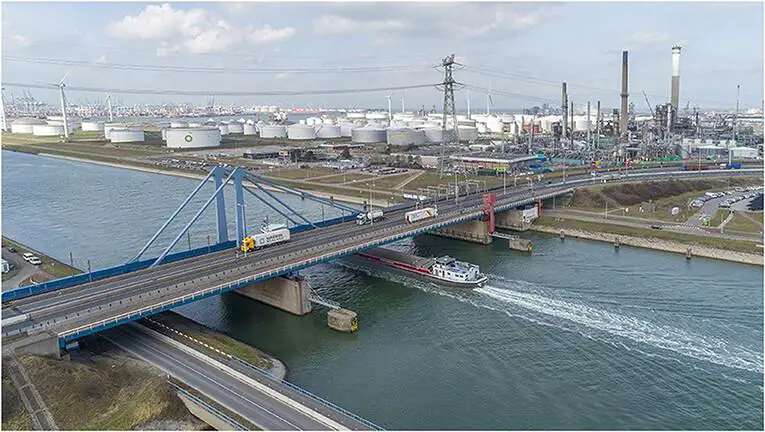
For every public project conceived, there must be very clear goals, benefits, and expectations from the project during and when it is completed. Complying with these objectives with minimum cost and maximum benefits is crucial because public projects are usually executed using public funds and tax revenues. Therefore, executing public projects involves many choices among physically feasible alternatives. Some examples of public projects are roads, bridges, hospitals, dams, leisure centres, etc
Furthermore, each choice among alternatives should be made on an economic basis. In addition, each alternative should be expressed in terms of money units before making the final choice. Money units can only measure the cost and benefits of different project alternatives.
Public parks are good examples of public projects
Public vs Private Projects
The economic analysis of public projects uses a different approach for evaluation compared to private projects. The focus is usually on benefits instead of profits, as in the case of private projects. In addition, the scope is the society; that is, it covers the interest of the owner and the society. Therefore, benefits becomes the performance criterion instead of profitability.
Economic Analysis of Public Projects
The best project is the one which gives the highest benefit-cost (B/C) ratios as it would give the maximum return on investment (ROI). On the contrary, public projects are usually executed to achieve maximum benefits and not maximum B/C ratios. However, projects should be economically viable and give some minimum return rate (RoR).
It has been observed in most public projects that benefit increase with the size of the project. However, project cost also increases with the increase in project size. Furthermore, a stage is reached beyond which an increase in project size may not yield minimum attractive returns. Therefore, the size of the project is fixed at this stage.
Key Test
It has always been easy to determine costs but determining full benefits remains challenging. Therefore, before economic analysis can proceed, efforts must be made to list possible benefits and estimated values. A decision-maker should accept projects as viable (economically acceptable) if benefits outweigh costs. In addition, the projects should be implemented, subject to the availability of funds.
Benefit-Cost Ratio
The benefit-cost ratio (B/C) compares the present value of all benefits to the present value of all costs. The ratio is merely used to see if a unit of costs (say, #1) will return at least the same unit (#1) in benefits. B/C ratios do not themselves provide enough information to make an economic choice. Therefore, additional calculations are necessary to use B/C ratios as a sound basis for project formulation.
Conditions for Viability
Accept projects as viable (economically acceptable) if benefits outweighs cost, that is, B/C > 1.0
Reject project if B/C < 1.0
Steps in Checking the Viability of Projects
Carryout incremental analysis on the projects, that is, arrange projects in increasing order of costs.
Put the projects in a portfolio from best to worst, noting cumulative cost values.
Stop when funding limit is reached.
Fund only the acceptable projects within limits.
If there is any extra fund, invest in some other venture or keep money in bank.
Worked Example
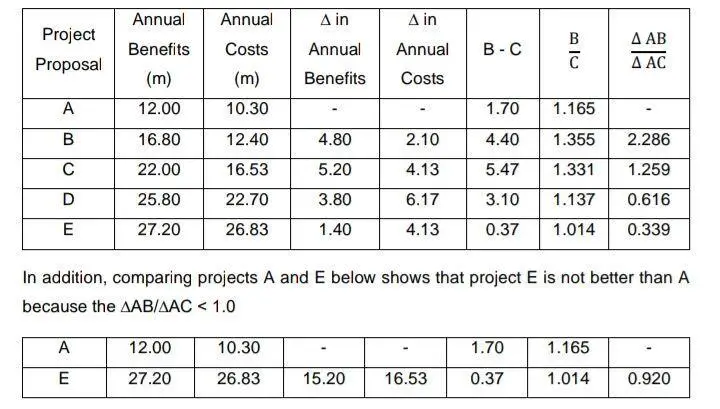
The information about 5 proposed public projects are given below.
Project Proposal
Annual Benefits (millions)
Annual Cost (Million)
A
12.00
10.30
B
16.80
12.40
C
22.00
16.53
D
25.80
22.70
E
27.20
26.83
a) Determine the projects that are viable.
b) Determine the best project.
c) If there is a budget of 40 million, determine the projects to adopt for execution.
Solution
a) All the projects are viable because their B/C > 1.0
b) The best project is B because it has the highest ∆AB/∆AC value of 2.286
c) With a budget of 40 million, projects A, B and C with overall cost of 39.23 million should be adopted for execution
Conclusion
The main purpose of economic analysis is to help select projects that contribute to the welfare of the people. Therefore, economic analysis is most useful when used early in the project cycle to catch bad projects and bad project components. However, if used at the end of the project cycle, economic analysis can only help decide whether or not to proceed with a project.
One of the most important steps in project evaluation is the consideration of alternatives throughout the project cycle, from identification through appraisal. Many important choices are made early when alternatives are rejected or retained for a more detailed study. Comparing mutually exclusive options is one of the principal reasons for applying economic analysis from the early stages of the project cycle.
Finally, an economical design is that project which gives the greatest excess benefits over cost. Moreover, a project should be evaluated in terms of RoR. The RoR (net gain or loss over a specified period) on investment may be estimated by calculating the cost and benefits of the project. Projects may also be ranked in the merit of RoR. Thus, the decision to go ahead can be made based on the minimum RoR and B/C ratio.
Reference
[1] Belli, P., Anderson, J., Barnum, H., Dixon, J. and Tan, J-P (1997), Handbook of Economic Analysis of Investment Operations, Operations Policy Department: Learning and Leadership Center. https://www.unisdr.org
Machine learning and deep learning techniques have been widely applied in the design of civil engineering structures in recent years. This is mainly due to the development of advanced computational capacity of computers in handling big data. Researchers from Ryerson University, Toronto, Canada have applied the concept of genetic algorithm to the design of pile foundations using Standard Penetration Test (SPT) data. The findings were published in the journal, Soils and Foundations.
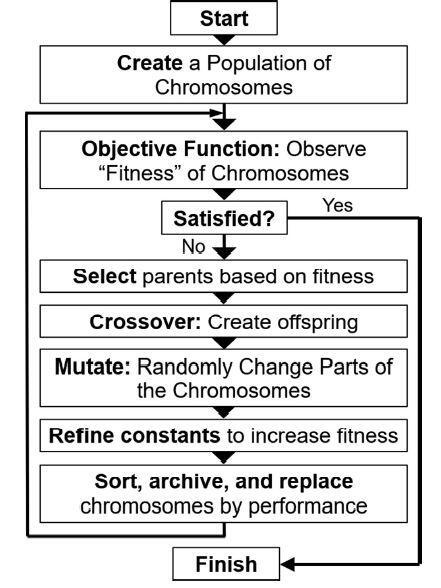
Genetic Algorithm (GA) is a method of optimization based on Darwin’s theory of evolution. In nature, chromosomes give an organism its characteristics, and organisms can adapt and evolve to survive and thrive in their environments through reproduction. A GA represents the problem domain as a string or matrix termed a chromosome, then evolves the chromosome through reproduction mechanisms to find a solution.
Fig. 1. Procedures of Implementing the Developed Genetic Algorithm (Jesswein and Lui, 2022)
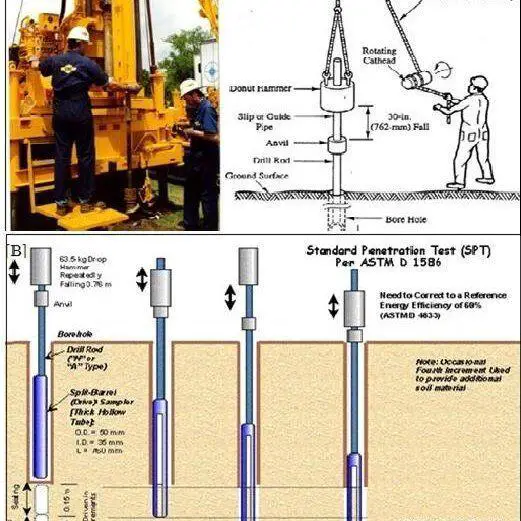
One of the oldest geotechnical investigation procedures, the standard penetration test (SPT), is still widely utilised around the world. SPT is also used to empirically test the ultimate load-carrying capacity (Qu) for the design of pile foundations, despite its significant shortcomings. There are two types of SPT-based design methods: direct and indirect.
Indirect approaches use SPT blow counts (N-values) to determine the shear strength of soils, such as the frictional angle (ϕ) or undrained shear strength (Cu), and then apply these parameters to the design. Unfortunately, correlating ϕ and Cu with SPT N-values is difficult. Some relationships between ϕ and N-values for sands have been proposed from various parts of the world.
According to the authors (Jesswein and Lui, 2022), it may be preferable to directly correlate SPT N-values to pile shaft (Qs) and tip resistance (Qp) given the uncertainties and additional inaccuracies caused by indirect correlations. However, many direct approaches may produce biased Qu forecasts. This is mainly because they were based on simple linear regressions or trial-and-error procedures with the N-value as the only input, and they likely ignore or misrepresent several factors that influence pile-soil interaction, such as effective stress, excess pore pressure, repacking of soil grains during pile driving, and pile load-transfer response.
Fig. 2. Standard penetration test
This inspired the authors to consider machine learning (ML) approach. ML algorithms are more efficient at regressing huge datasets and capturing nonlinear interactions between numerous variables than standard regression approaches. Furthermore, because the systems evaluate alternative solutions based on a set of criteria, which typically includes an objective or fitness function, they do not require prior knowledge of the problem domain. This eliminates the need to assume a relationship between variables while performing regression.
Due to its “blackbox” nature, the most popular ML method, artificial neural networks (ANN), does not allow the relationships to be stated in a practical formula. As a result, a genetic algorithm (GA) may be a better ML technique since it may provide useful, easy-to-understand functions that represent generic trends.
A total of 72 axial compression tests on driven steel piles were gathered from the literature and the Ministry of Transportation of Ontario (MTO) for the study. The 72 piles selected were divided into two groups based on their measurements.
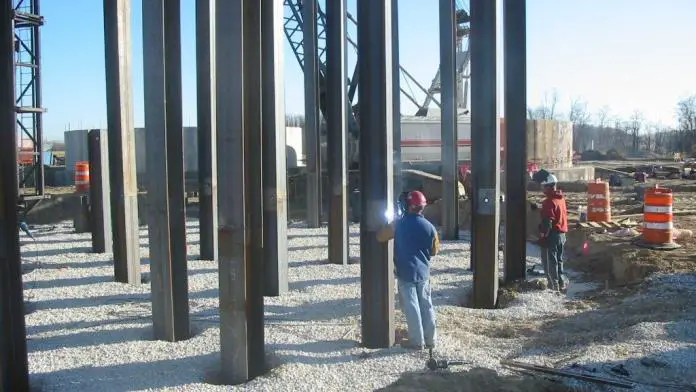
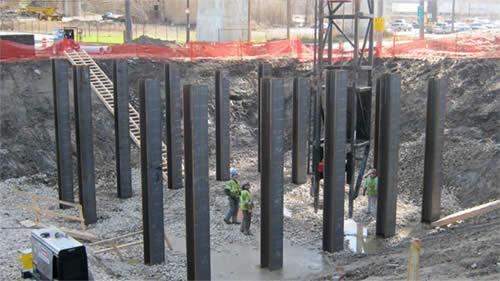
Fig. 3. Typical driven steel piles
The load-transfer distribution data were used to extract both the unit shaft and tip resistances in the first group. The GA developed the design approach by correlating these unit resistances with soil data and pile parameters. The new design approach was validated and compared to three existing SPT-based design methods in the second group, where only total capacity measurements were provided. In the study both N60 and (N1)60 are represented by Ncr.
The piles that were researched were chosen based on the following criteria:
Sufficient information was available on the subsurface ground conditions, particularly the soil classifications and SPT N-values, at the test site;
Non-organic soils were found along the pile length;
The pile types were either open-ended pipe (OEP), closed-ended pipe (CEP), and H piles;
The pile width or diameter and embedment length were available; and
The load–displacement curves were reported.
Based on a total of 72 full-scale static load tests reported in the study, the new SPT-based formula provides an unbiased prediction with a higher level of accuracy. The proposed design formulas are summarized below:
Where; L = Length of pile σ’ = Effective overburden pressure at the depth considered Ncr = Corrected SPT Number qs = shaft resistance qp = Tip resistance
According to the authors, Equations (1) and (2) can consider the changing ground conditions by using the characteristic values for Ncr and σ’ within a soil layer.
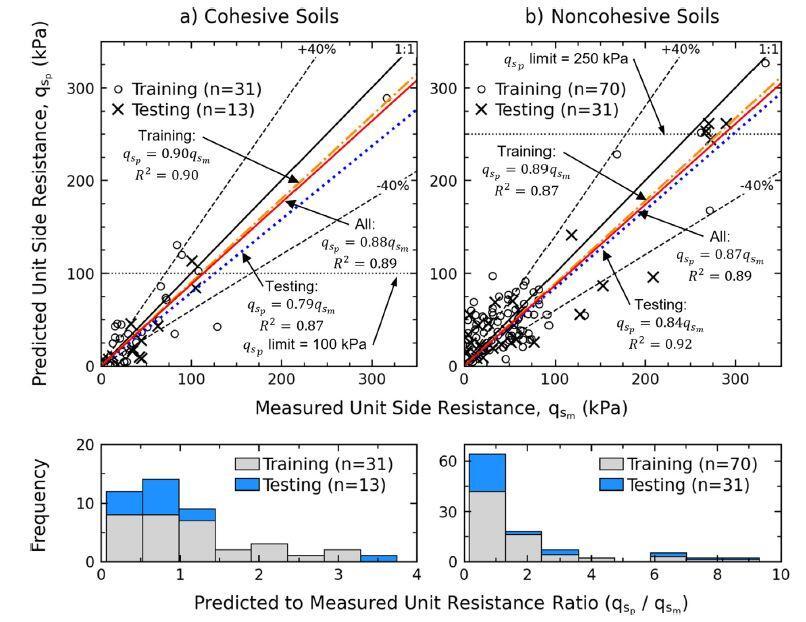
Fig. 4. Comparison between Measured and Predicted Unit Side Resistance by Functions from the GA.(Jesswein and Lui, 2022)
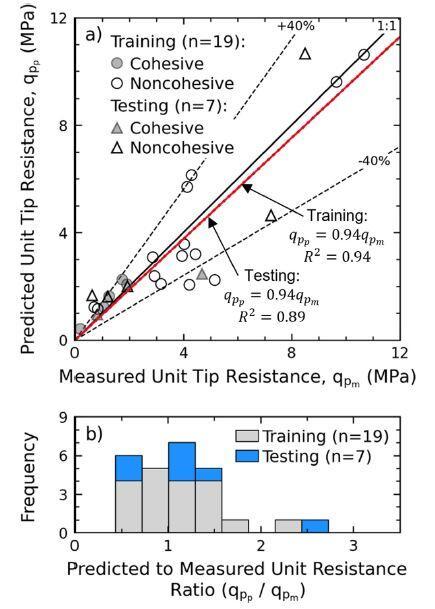
Fig. 5. Comparison between Measured and Predicted Unit Tip Resistance from the GA (Jesswein and Lui, 2022)
Although the proposed formulas provide better predictions than existing design methods, the authors insist that engineering judgement and knowledge of local ground conditions are critical components in correctly designing a pile. The quality of the produced model is dependent on the correctness of the input variables, particularly Ncr, because GA regressions are data driven. Because regressed models may not perform well under extrapolation, the range of the examined variables should be addressed while applying the provided formulas. The proposed approach can be used on a wide range of cohesive and cohesionless soils, but organic soils and soft clays are not recommended.
Article Source: Jesswein M. and Liu J. (2022): Using a genetic algorithm to develop a pile design method. Soils and Foundations 62(2022)101175. https://doi.org/10.1016/j.sandf.2022.101175
Deck slabs of bridges are likely to be among the elements that are influenced by fatigue verification calculations the most. This is due to the high live load to dead load ratio that these slabs have. Tests, on the other hand, have shown that the actual stress ranges in the reinforcement in these are significantly lower than what is suggested by the standard elastic calculations. As a result of this, the NA to BS EN 1992-2 identifies situations in which fatigue assessment is not necessary and gives regulations that are on the safe side.
The failure of a structure due to repeated loadings that are smaller than a single static force that exceeds the material’s strength is known as Fatigue. Fatigue occurs when a material fails due to direct tension or compression, torsion, bending, or a combination of these actions.
Since reinforced concrete is a composite material, it can fail due to fatigue in a variety of ways. Failure is frequently the result of a variety of reasons, and failure types can vary quite significantly. The concrete, the reinforcement, and the bond between the materials might all fail locally.
Compressive fatigue failure in reinforced concrete is referred to as ductile because cracks might appear in the concrete long before the structure falls. Because the crack propagation rate in the reinforcement at the end is rather fast, tensile fatigue failure in reinforced concrete has a more brittle behaviour.
According to clause 6.8.1 of BS EN 1992-2, a fatigue verification is generally not necessary for the following structures and structural elements:
Footbridges, with the exception of structural components very sensitive to wind action.
Buried arch and frame structures with a minimum earth cover of 1 m and 1.5 m for road and railway bridges.
Foundations.
Piers and columns which are not rigidly connected to superstructures.
Retaining walls of embankments for roads and railways.
Abutments of road and railway bridges which are not rigidly connected to superstructures, except the slabs of hollow abutments.
Prestressing and reinforcing steel, in regions where, under the frequent load combination of actions and Pk only compressive stresses occur at the extreme concrete fibres.
Furthermore, in the case of road bridges, fatigue verification is not required for the local effects of wheel loads given directly to a slab that spans across beams or webs, provided that the following conditions are met:
The slab does not contain welded reinforcement or reinforcement couplers.
The clear span to overall depth ratio of the slab does not exceed 18.
The slab acts compositely with its supporting beams or webs.
Either:
the slab also acts compositely with transverse diaphragms; or
the width of the slab perpendicular to its span exceeds three times its clear span.
In Eurocode there are two alternative methods by which fatigue verification can be calculated for bridges;
the λ-Coefficient Method and
the Cumulative Damage Method.
Both approaches take into account the loading during the course of a structure’s lifetime. The λ-Coefficient Method is a simplified method that uses a single load model amplified by several coefficients. The Cumulative Damage Method is a complicated model that takes into account the load history in greater detail. The λ-Coefficient Method simply evaluates if the building meets the code’s requirements, whereas the Cumulative Damage Method derives a fatigue damage factor that indicates the structure’s actual damage in relation to the design fatigue life.
Internal Forces and Stresses for Fatigue Verification
According to clause 6.8.2 of BS EN 1992-2, the calculation of stress for fatigue verification must be based on the assumption of cracked cross-sections, which must be done while ignoring the tensile strength of the concrete and satisfying compatibility of strains. The influence of the varied bond behaviour of prestressing steel and reinforcing steel must be taken into account by increasing the stress range in the reinforcing steel computed under the assumption of a perfect bond by the factor, η, which is given by:
η = (As + Ap)/[(As + Ap) × √ξ(ϕs/ϕp)]
where: As = area of reinforcing steel Ap = area of prestressing tendon or tendons ϕs = largest diameter of reinforcement ϕp = diameter or equivalent diameter of prestressing steel = 1.6 √Ap for bundles = 1.75 ϕwire for single 7-wire strands where ϕwire is the wire diameter = 1.20 ϕwire for single 3-wire strands where ϕwire is the wire diameter ξ = ratio of bond strength between bonded tendons and ribbed steel in concrete. The value is subject to the relevant European Technical Approval. In the absence of this the values given in Table 1 may be used.
Prestressing steel
ξ (pre-tensioned)
ξ (Bonded, post-tensioned) ≤ C50/60
ξ (Bonded, post-tensioned) ≥ C70/85
Smooth bars and wires
Not Applicable
0.3
0.15
Strands
0.6
0.5
0.25
Indented wires
0.7
0.6
0.30
Ribbed bars
0.8
0.7
0.50
Table 1: Ratio of bond strength, ξ, between tendons and reinforcing steel (Source: Table 6.2 BS EN 1992-1-1)
For intermediate values between C50/60 and C70/85, interpolation may be used.
Verification of Concrete under Compression or Shear
According to clause 7.6.2 of PD 6687-2, it is doubtful that National Authorities will have the S–N curves that are necessary to carry out a fatigue verification of concrete while it is being subjected to compression or shear. In the absence of such data, the simplified technique that is outlined in BS EN 1992-2, Annex NN may be utilised for railway bridges; however, there is no equivalent alternative available for highway bridges.
σc,max/fcd,fat≤ 0.5 + 0.45(σc,min/fcd,fat)
where; σc,max = maximum compressive stress at a fibre under the frequent load combination (compression measured positive) σc,min = minimum compressive stress at the same fibre where σc,max occurs. If σc,min is a tensile stress, then σc,min should be taken as zero fcd,fat = design fatigue strength of concrete = 0.85 βcc(t0) fcd (1 – fck/250) fcd = fck / 1.5 βcc(t0) = coefficient for concrete strength at first load application = exp{s[1 – (28/t0)0.5]}
where; t0 = time of the start of the cyclic loading on concrete in days s = 0.2 for cement of strength Classes CEM 42.5R, CEM 52.5N and CEM 52.5R (Class R) = 0.25 for cement of strength Classes CEM 32.5R, CEM 42.5 (Class N) = 0.38 for cement of strength Class CEM 32.5 (Class S)
The maximum value for the ratio σc,max / fcd,fat is given in Table 2.
Concrete Strength
σc,max / fcd,fat
fck ≤ 50 MPa
≤ 0.9
fck > 50 MPa
≤ 0.8
Table 2: Values for σc,max / fcd,fat
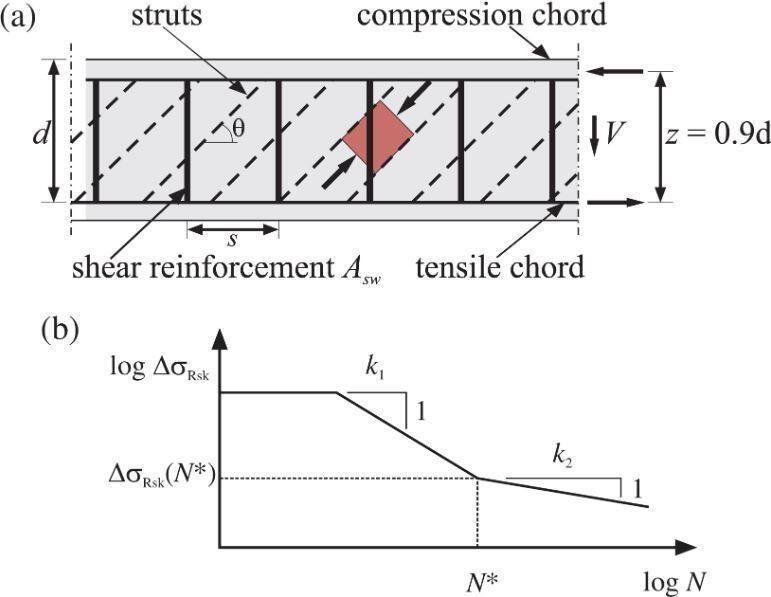
(a) Truss model for beams with shear reinforcement and (b) characteristic S-N curve for reinforcing steel
For members not requiring design shear reinforcement for the ultimate limit state it may be assumed that the concrete resists fatigue due to shear effects where the following apply:
for VEd,min/VEd,max ≥ 0: |VEd,max|/|VRd,c| ≤ 0.5 + 0.45|VEd,min|/|VRd,c| ≤ 0.9 up to C50/60 ≤ 0.8 greater than C55/67
for VEd,min/VEd,max < 0: |VEd,max|/|VRd,c| ≤ 0.5 |VEd,min|/|VRd,c|
where; VEd,max = design value of the maximum applied shear force under frequent load combination VEd,min = is the design value of the minimum applied shear force under frequent load combination in the cross-section where VEd,max occurs VRd,c = design value for shear resistance
Limiting Stress Range for Reinforcement under Tension
Adequate fatigue resistance may be assumed for reinforcing bars under tension if the stress range under the frequent cyclic load combined with the basic combination does not exceed 70 MPa for unwelded bars and 35 MPa for welded bars.
For UK highway bridges, the values in Tables 12.3 and 12.4 may be used for straight reinforcement. These are based on bars conforming to BS 4449. For bars not conforming to BS 4449, the rules for bars > 16 mm diameter should be used for all sizes unless the ranges for bars ≤ 16 mm diameter can be justified.
Span (m)
Adjacent spans loaded (Bars ≤ 16 mm)
Adjacent spans loaded (Bars > 16 mm)
Alternate spans loaded (Bars ≤ 16 mm)
Alternate spans loaded (Bars > 16 mm)
≤ 3.5
150
115
210
160
5
125
95
175
135
10
110
85
175
135
20
110
85
140
110
30 -50
90
70
110
85
100
115
90
135
105
≥ 200
190
145
200
155
Table 3: Limiting stress ranges – longitudinal bending for unwelded reinforcing bars in road bridges, MPa
For Tables 3 and 4, intermediate values can be interpolated.
Span (m)
(Bars ≤ 16 mm)
(Bars > 16 mm)
≤ 3.5
210
160
5
120
90
≥ 10
70
55
Table 4: Limiting stress ranges – transverse bending for unwelded reinforcing bars in road bridges, MPa
Full fatigue checks are to be carried out using the ‘damage equivalent stress range’ approach, following the instructions given in Annex NN of BS EN 1992-2, if the stress range limitations exceed the values specified in Tables 3 and 4 (e.g. for reinforcement over the pier). The stress ranges are derived using the ‘Fatigue Load Model 3’, which simulates a four-axle vehicle weighing 48 tonnes total. This weight is increased to 84 tonnes for intermediate supports and 67 tonnes for other locations in Annex NN.
The immediate or elastic settlement of pile groups, denoted by ρiand the long-term consolidation settlement, denoted by ρc, both contribute to the total settling of a pile group in clay. Equation (1) can be used as a general rule to calculate the elastic settlement for a flexible foundation at the level of the ground surface;
ρi = qn × 2B × (1 – v2)/Eu × Ip ——– (1)
where ρiis the settlement at the centre of the flexible loaded area, qn is the net foundation pressure, B is the width of an equivalent foundation flexible raft, v is the undrained Poisson’s ratio for clay (generally taken as equal to 0.5), Ipis an influence factor, and Eu is the deformation modulus for the undrained loading conditions.
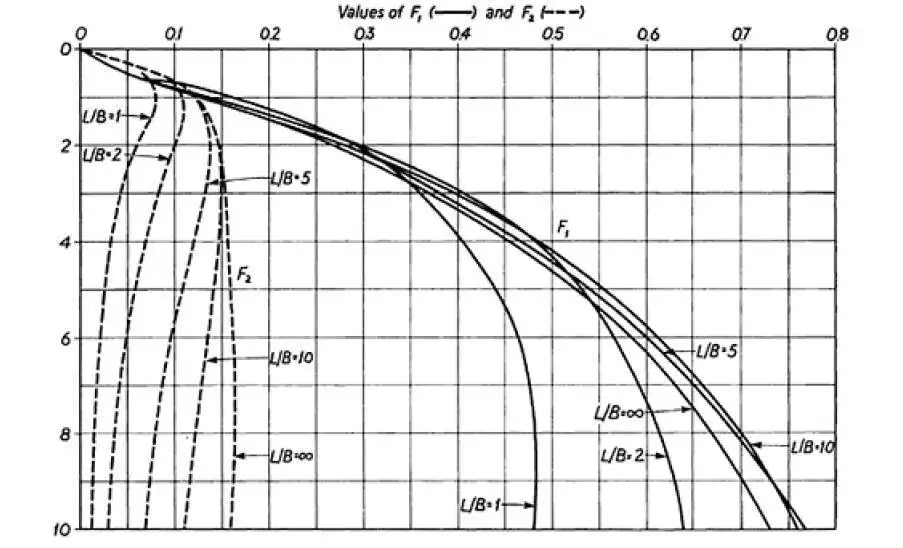
The values of Ip are dependent on the ratio H/B of the depth of the compressible soil layer to the width of the pile group, as well as the ratio L/B of the length of the group to its width. The values of Ip and, consequently, the immediate settlement of a surface foundation can be obtained through the use of curves that were established by Steinbrenner and published by Terzaghi (1943).
These curves can be found in Figure 1 of this article. To calculate the elastic settlement of pile groups, the use of Fox’s correction curves (1948) is required in order to obtain the immediate settlement of a raft foundation that is equivalent to the pile group.
Figure 1: Values of Steinbrenner’s influence factor Ip (for v of 0.5)
To obtain the average immediate settlement of a foundation at a depth D below the surface where the deformation modulus is reasonably constant with depth, it will be found to be more convenient to use the influence factors of Christian and Carrier (1978). In general, this will be the case where the deformation modulus is reasonably constant with depth.
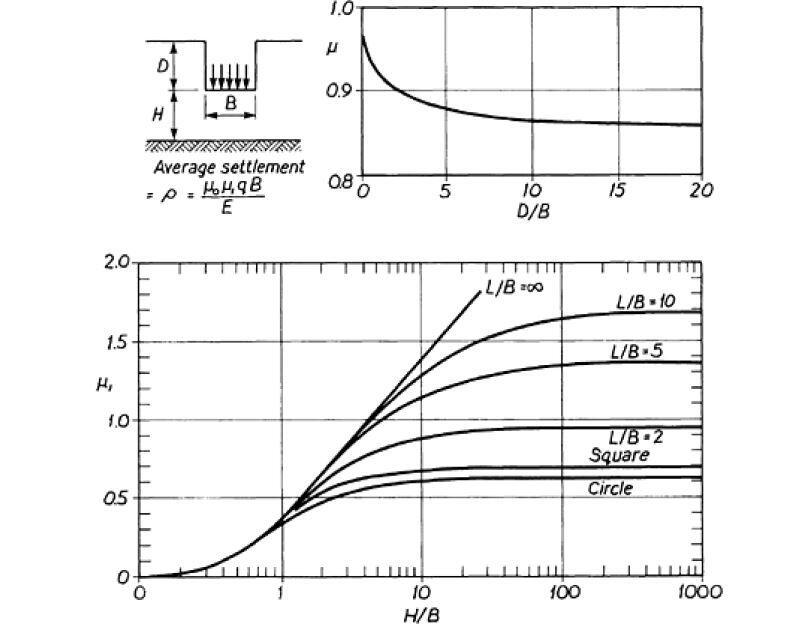
Average settlement ρi = μiμ0qnB/Eu ——– (2)
In the equation (2), it was assumed that Poisson’s ratio was equal to 0.5. Figure 2 shows the factors μi and μ0, both of which are associated with the depth of the equivalent raft, the thickness of the compressible soil layer, and the length/width ratio of the equivalent raft foundation.
Figure 2: Influence factors for calculating immediate settlements of flexible foundations of width B at depth D below ground surface (after Christian and Carrier(5.5)).
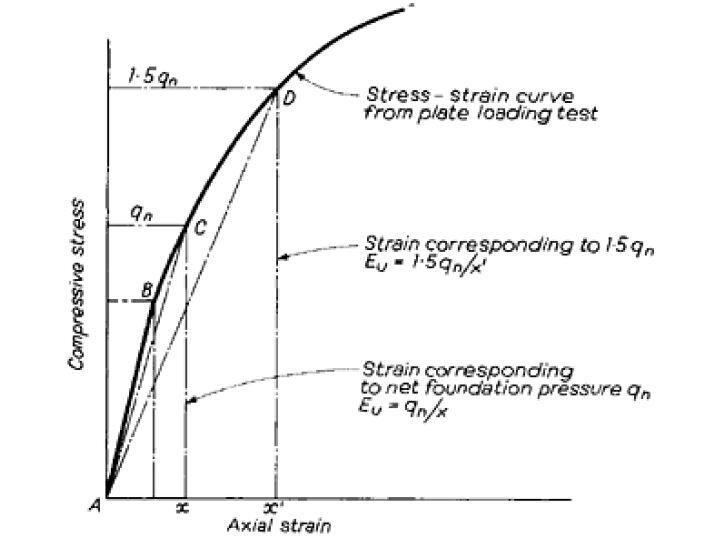
The value of the deformation modulus Eucan be determined by analysing the stress-strain curve that is produced when compressive loading is applied to the soil while the conditions are undrained. Only when the stress level is relatively low (shown by the line AB in Figure 3) does a curve of this type show purely elastic behaviour, which requires the use of a modulus of elasticity.
It is possible that the immediate settlement will be underestimated due to the fact that (Young’s modulus) corresponds to the straight-line portion. The standard procedure is to draw a secant AC to the stress-strain curve that corresponds to a compressive stress that is equal to the net foundation pressure at the base of the equivalent block foundation.
The secant AD can be drawn at a compressive stress of 1.5 or any other suitable multiple of the foundation pressure for a more conservative approach. Following this, one can calculate the deformation modulus Eu, as shown in Figure 3.
Figure 3: Determining deformation modulus Eu from stress-strain curve
As a result of sample disturbance, unreasonably low modulus values are obtained from stress-strain curves produced from conventional unconfined or triaxial compression tests in the laboratory. These results are not representative of the material’s true behaviour. Plate bearing tests carried out in boreholes or trial pits, as well as field testing carried out with a pressuremeter or Camkometer, provide the most reliable data for calculating modulus values.
Another possibility is that Eu is connected to the clay’s undrained shearing strength cu. According to Butler (1975), the relationship Eu = 400cu for London clay is a reasonable compromise between divergent data representing, on the one hand, the relationship established from laboratory testing, and on the other hand, the observations of the settlement of full-scale structures.
Recent years have seen the development of apparatus for obtaining piston-driven tube samples of stiff clays, as well as improvements in methods for coring weak rocks. Therefore, samples that have been subjected to a relatively minor disturbance can be provided for laboratory testing to obtain modulus values. There is apparatus available that can measure very small strains during uniaxial or triaxial compression tests, which can then be utilised to derive small strain modulus values.
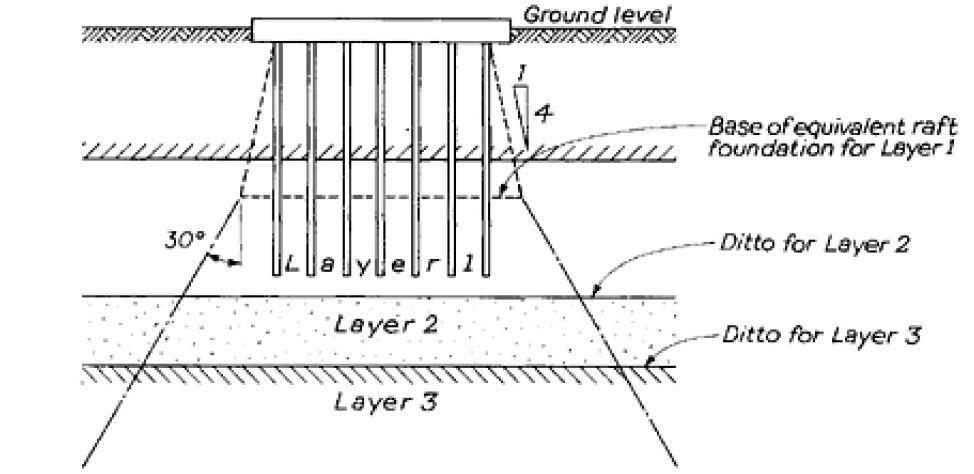
In layered soils with different values of the deformation modulus Euin each layer or in soils which show a progressively increasing modulus with increases in depth, the strata below the base of the equivalent raft are divided into a number of representative horizontal layers, and an average value of Eu is assigned to each layer.
This ensures that the values of the deformation modulus Eu are consistent across the entire profile of the soil. The values for the dimensions L and B in Figure 2 are derived from the hypothesis that the load is distributed across the surface of each layer at an angle of thirty degrees with respect to the edges of the equivalent raft (Figure 4). After that, the total settlement of the piled foundation can be calculated as the sum of the average settlements for each soil layer that were determined using Equation 2.
Figure 4: Load distribution beneath pile group in layered soil formation
The assumption that the deformation modulus remains the same with depth is the basis for the influence values presented in Figure 1. Calculations that are based on a constant modulus, on the other hand, give inflated estimates of the amount of settlement that will occur.
This is because the modulus increases with depth in the majority of natural soil and rock formations. Butler (1974) developed a method for settlement calculations for the conditions of a deformation modulus increasing linearly with depth within a layer of finite thickness. This method was used for determining the amount that a layer would settle. The following equation will give you the value of the modulus at a depth z below the level of the foundation:
Eu = Ef(1 + kz/B) ——– (3)
and
ρi = qnBI’p/Eu ——– (4)
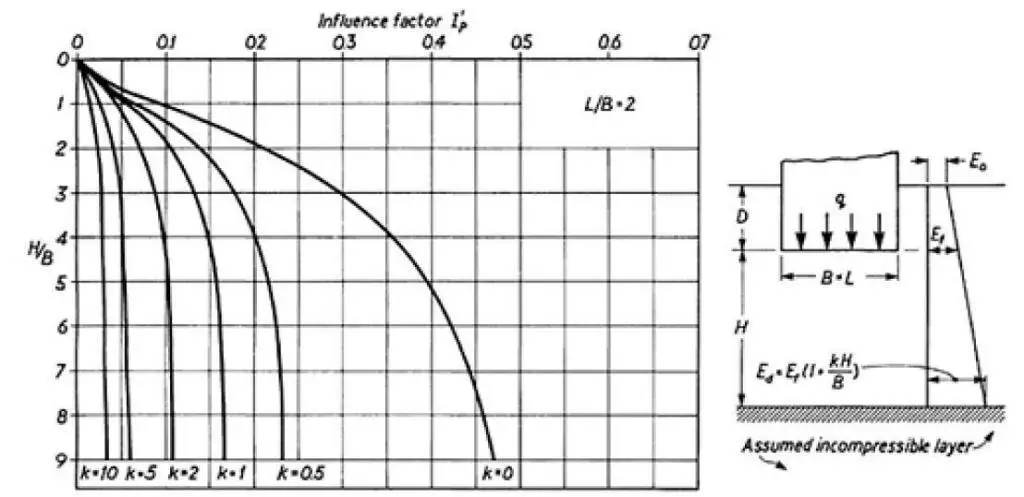
where Efrepresents the modulus of deformation at foundation level (the base of the equivalent raft), and ρi represents the settlement at the corner of the loaded area in the equation. In order to calculate the value of k, first plot the measured values of Eu against depth, and then draw a straight line through the points that are plotted. This will give you the values you need to substitute into equation 3.
In situations in which a plot of undrained shear strength versus depth has been obtained, the Eu vs depth line can be derived from the empirical relationships given earlier in this paragraph.
After you have determined k, you can use Butler’s curves, which are presented in Figure 5, to determine the appropriate factor for I’p. These are for different ratios of L/B at the level of the equivalent raft, and they are applicable for a compressible layer thickness that is not greater than 9B. The curves have been constructed on the basis of the assumption that an undrained condition will have a Poisson’s ratio of 0.5; this is so that the load can be applied immediately.
Figure 5: Values of the influence factor for deformation modules increasing linearly with depth and Poisson’s ratio of 0.5 (after Butler (1974))
In situations in which the pile group covers a large area and is, as a result, relatively flexible, it is possible that it will be necessary to calculate the settlements at the corners in addition to those in the area’s centre.
Consolidation Settlement of Pile Groups
The results of oedometer tests carried out on clay samples in the laboratory are used as the basis for the calculation of the consolidation settlement ρc. The pressure-to-voids ratio curves that were obtained from these tests are what are used to calculate the volume compressibility coefficient, denoted by the symbol mv.
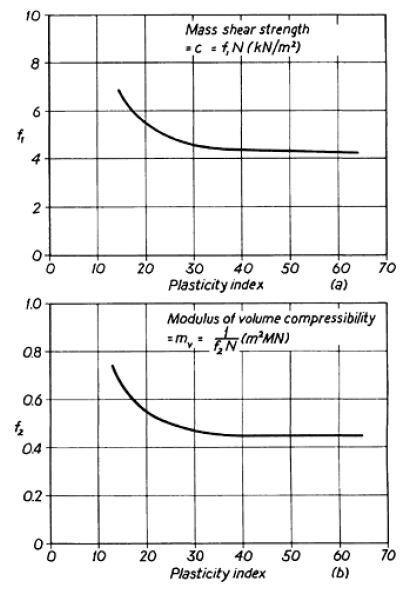
It may be difficult to obtain satisfactory undisturbed samples for oedometer testing in hard glacial tills or in rocks that have been highly weathered and weakened by weathering. If the results of standard penetration tests are available, then the values of mv (as well as cu) can be obtained from the empirical relationships established by Stroud (1975) and shown in Figure 6.
Figure 6: Relationship between mass shear strength, modulus of volume compressibility, plasticity index and standard penetration test N-values (after Stroud (1975)) (a) N-value vs. undrained shear strength (b) N-value vs. modulus of volume compressibility
Once a representative value of mv has been obtained for each soil layer that is being stressed by the pile group, the oedometer settlement ρoed for this layer at the centre of the loaded area can be calculated using the equation;
ρoed = μdmv × σz × H ——– (5)
where μd is a depth factor, σz is the average effective vertical stress imposed on the soil layer due to the net foundation pressure qn at the base of the equivalent raft foundation and H is the thickness of the soil layer. The depth factor is obtained from Fox’s correction curves.
The oedometer settlement must now be corrected to obtain the field value of the consolidation settlement. The correction is made by applying a ‘geological factor’ μg to the oedometer settlement, where;
ρc = μg × ρoed ——– (6)
Published values of μg have been based on comparisons of the settlement of actual structures with computations made from laboratory oedometer tests. Values established by Skempton and Bjerrum (1975) are shown in Table 1.
Type of clay
μg value
Very sensitive clays (soft alluvial, estuarine and marine clays)
1.0 – 1.2
Normally-consolidated clays
0.7 – 1.0
Over-consolidated clays (London clay, Weald, Kimmeridge, Oxford and Lias clays)
After this, the total settlement of the pile group is determined by adding together the immediate and consolidation settlements that were calculated for each individual layer. A gradual decrease in compressibility with depth is a typical example of this phenomenon. When this occurs, the stressed zone beneath the pile group is segmented into a number of distinct horizontal layers.
The value of the modulus of elasticity (mv) for each of these layers is obtained by plotting the mv value against the depth, which is based on the results of the laboratory oedometer tests. At the level where the vertical stress has decreased to one tenth of qn, the level at which the base of the lowest layer is determined to be is chosen.
When calculating the total consolidation settlements for each layer, the depth factor, denoted by d, is multiplied by that total. It does not apply to the immediate settlement if that settlement has already been computed based on the factors shown in Figure 5.
If a pile group is topped by a deep rigid cap or if it is used to support a rigid superstructure, then the pile group can be considered to be equivalent to a rigid block foundation that has a uniform settlement. This is because both of these conditions ensure that the pile group remains in its original position.
To calculate the value of the latter, a “rigidity factor” is applied to the consolidation settlement that was obtained from the equivalent flexible raft foundation. The immediate settlement can be calculated using Equation 2. This immediate settlement is the same as the average settlement that is given by a rigid foundation. The value of 0.8 for the rigidity factor is widely accepted as being appropriate.
Thus; Settlement of rigid pile group/Settlement of flexible pile group = 0.8
It is possible, for the purposes of this condition, to consider a pile group that is composed of a number of small clusters or individual piles connected by ground beams or by a flexible ground floor slab to be equivalent to a flexible raft foundation at depth.
This is the case if the pile group is connected by ground beams. According to the calculations described above, the consolidation settlements that occurred at the corners of the piled area make up approximately one-half of the settlement that occurred in the centre of the group.
The use of Equation 1, with the substitution of a deformation modulus obtained for loading under drained conditions, is yet another method for estimating the total settlement of a structure that is resting on an over-consolidated clay.
This modulus has been given the name Ev‘, and it can be found at the bottom of Equation 1, where it stands in place of Eu. It roughly corresponds to the value of 1/mv. When used to calculate consolidation settlements, the equation does not adhere to strict validity standards because it assumes a material that is both homogenous and elastic.
However, when applied to over-consolidated clays for which the settlements are relatively small, it has been observed through experience that the method gives predictions that are reasonably reliable. The success of utilising the method is dependent on the collection of sufficient data correlating the observed settlements of structures with the determinations of from plate loading tests and laboratory tests on good undisturbed samples of clay. This is necessary for a successful outcome.
In his analysis of the settlement of structures on over-consolidated clays, Butler (1974) related Ev‘ to the undrained cohesion cu and determined that the relationship for London clay is Ev‘ = 130Cu.
In the settlement analysis of a group of piles, it is better to adopt an approach that is more rational, which is to consider immediate settlements and consolidation settlements separately. This appropriately takes into account the effects that time has had on the location as well as its geological history. The prediction of consolidation settlements based on oedometer tests conducted in the laboratory has been found to lead to reasonably accurate results, provided that a sufficient number of good undisturbed samples have been obtained at the site investigation stage.
The adoption of the method that is based on the total settlement deformation modulus is contingent upon the collection of adequate observational data, first regarding the relationship between the undrained shearing strength and the deformation modulus, and secondly regarding the actual settlement of structures from which the relationships can be checked.
The adoption of this method is dependent upon the collection of adequate observational data. It is highly unlikely that accurate results can be obtained from triaxial compression tests carried out in the lab, so any attempt to do so is likely to end in failure. The modulus can be determined most accurately using the Eu/cu and relationship formulas, which need to be derived from plate bearing tests that have been competently carried out and field observations of settlement.
The reader is directed to a report written by Padfield and Sharrock (1983) for CIRIA that contains a general discussion on the subject of the settlement of foundations on clays. According to what they have found, the immediate settlement is approximately equal to 0.5 to 0.6 times the oedometer settlement, while the consolidation settlement, is approximately equal to 0.4 to 0.5 times the oedometer settlement. This is true for stiff overconsolidated clays. When it comes to normally consolidated soft clays, the immediate settlement is roughly equivalent to 0.1 times the oedometer settlement, and the consolidation settlement is roughly equivalent to the oedometer settlement.
The steps in making a settlement analysis of a pile group in, or transmitting stress to, a cohesive soil can be summarized as follows.
For the required length of pile, and form of pile bearing (i.e. friction pile or end-bearing pile), draw the equivalent flexible raft foundation represented by the group.
From the results of field or laboratory tests assign values to Eu and mv for each soil layer significantly stressed by the equivalent raft.
Calculate the immediate settlement of ρi of each soil layer using equation 2, and assuming a spread of load of 30° from the vertical to obtain qn at the surface of each layer (Figure 4). Alternatively calculate on the assumption of a linearly increasing modulus.
Calculate the consolidation settlement ρc for each soil layer from Equations 5 and 6, using relevant charts to obtain the vertical stress at the centre of each layer.
Apply a rigidity factor to obtain the average settlement for a rigid pile group.
The consolidation settlement calculated as described above is the final settlement after a period of some months or years after the completion of loading. It is rarely necessary to calculate the movement at intermediate times, i.e. to establish the time settlement curve, since in most cases the movement is virtually complete after a period of a very few years and it is only the final settlement which is of interest to the structural engineer. If time effects are of significance, however, the procedure for obtaining the time-settlement curve can be obtained from standard works of reference on soil mechanics.
References
TERZAGHI, K (1943). Theoretical Soil Mechanics, John Wiley, New York, p. 425.
FOX, E.N. (1948). The mean elastic settlement of a uniformly-loaded area at a depth below the ground surface, Proceedings of the 2nd International Conference, ISSMFE, Rotterdam, Vol. 1, pp. 129–32.
CHRISTIAN, J.T. and CARRIER, W.D. (1978). Janbu, Bjerrum and Kjaernsli’s chart reinterpreted, Canadian Geotechnical Journal, Vol. 15, pp. 123–8.
BUTLER, F.G. (1974). General report and state-of-the-art review, Session 3, Proceedings of the Conference on Settlement of Structures, Cambridge, Pentech Press, London, pp. 531–78.
STROUD, M.A. (1975) The standard penetration test in insensitive clays, Proceedings of the European Symposium on Penetration Testing, Stockholm, Vol. 2, pp. 367–75.
SKEMPTON, A.W. and BJERRUM, L. A (1957). contribution to the settlement analysis of foundations on clay , Geotechnique, Vol. 7, No. 4, pp. 168–78.
PADFIELD, C.J. and SHARROCK, M.J. (1983). Settlement of structures on clay soils, Construction Industry Research and Information Association (CIRIA), Special Publication 27, 1983.
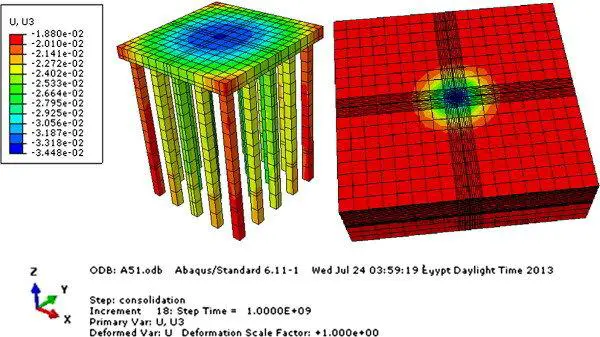
Feature Image: Ata A., Badrawi E., Nabil M. (2015): Numerical analysis of unconnected piled raft with cushion. Ain Shams Engineering Journal, 6(2):421-428 https://doi.org/10.1016/j.asej.2014.11.002.
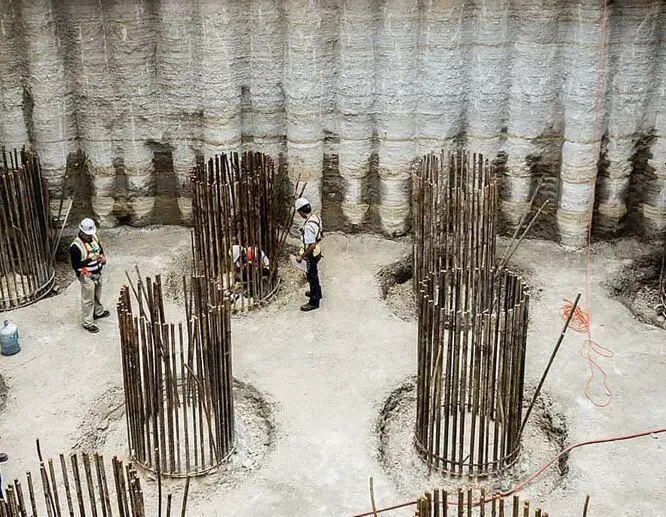
During the design and construction of pile foundations, there are instances of eccentric loading that may arise because column positions do not align with the centroid of the pile group. This eccentricity usually induces bending moments which affect the axial load on each pile in a group. Therefore, the evaluation of axial load distribution of piles under eccentric vertical loading is very important, so that the safe working load on each individual pile in not exceeded. In this article, we will discuss the effects of eccentric loading on a group’s axial load on piles.
Every deep foundation project is unique. Most clients frown at soil test reports recommending pile foundations for their projects due to the cost implication of deep foundations. Since there are a variety of pile types, professionals in the construction industry should always assure their clients of the most economical pile type for their projects.
Generally, pile foundations are used when suitable foundation conditions are not present at or near ground level, making the use of shallow traditional foundations uneconomical. Furthermore, it is often recommended to use more than one pile below a column, depending on the pile’s safe working load and the service axial load from the column. Piles in group are usually preferred, particularly if the piles are driven because driven piles in group have large load bearing capacity, a small settlement, and good stability.
Axial Load on Eccentrically Loaded Piles
When a pile group is subjected to eccentric loading, it raises questions about how safe and reliable the piles will become, especially if they were designed initially with zero loading eccentricity. Therefore, designers and construction engineers need to ascertain the eccentricity limit within which a design is still safe and applicable.
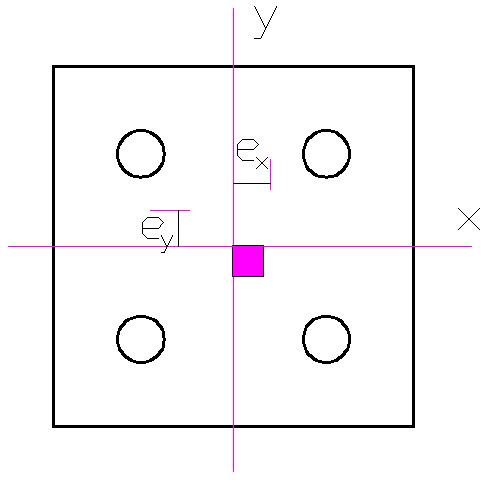
For a group of piles, the vertical load (P) is the sum of the column loads, the self-weight of the pile cap, any backfilling, and the surcharge on the pile cap. Using the figure above, the axial load (Rp) on any pile in a group can be calculated using the equation below.
Where; Rp = Axial load on any pile P = Vertical load on pile group n = Number of piles in pile group Mxx and Myy = Moment about x-x and y-y on pile group respectively x and y = Distance of any pile from x-x and y-y respectively ⅀x2 and ⅀y2 = Sum of the squares of the distances of all piles from x-x and y-y respectively
However, this method of calculating the axial load on any pile in a group is only valid for rigid pile caps, that is, very stiff pile caps. Therefore, large pile caps and rafts should be treated as flexible, and a rigorous grillage or finite element analysis should be undertaken to determine the axial load on any pile.
Solved Example
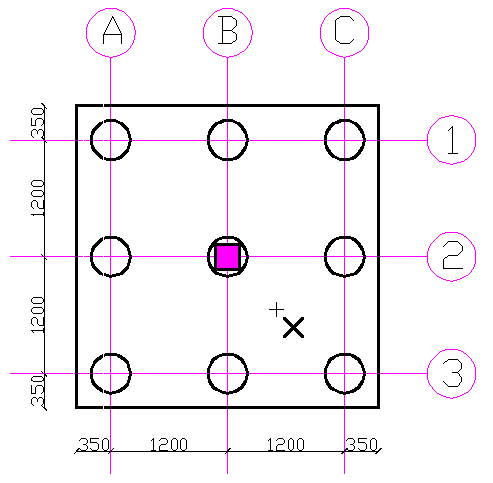
With reference to the pile layout in the diagram below, column position is on grid B2. Column load = 4500 kN. Assuming pile diameter = 400mm, pile cap depth = 900mm, and there is a surcharge load of 18.8 kN/m2
a) Determine the axial load on each pile in the group. b) If the column moves to a position x, that is, the right of gridline B by 0.3 m and below gridline 2 by 0.6 m simultaneously. What is the effect on the axial load on each pile?
Solution
Column load = 4500 kN Length and breadth of pile cap = 3100 mm Pile diameter = 400 mm Pile cap depth = 900mm Number of piles (n) = 9 Unit weight of concrete = 24 kN/m3 Surcharge load = 18.8 kN/m2
a) The axial load on each pile is the same because the vertical load is applied concentrically, and the piles are spaced at sufficient and equal distances apart. Axial load (Rp) = P/n= 4888.244/9 = 543.14 kN
b) Using equation (1) ⅀x2 = ⅀y2 = (1.2)2 + (1.2)2 + (1.2)2 + (1.2)2 + (1.2)2 + (1.2)2 + (0)2 + (0)2 + (0)2 = 8.64 m
From the solved example above, we can see that loading eccentricity significantly impacts the axial load on any pile in a pile group. Moreover, the effect is quite profound on PC3, with a 103.6% increment in axial load compared to when the vertical load (P) acts on the pile group concentrically.
Furthermore, piles are usually designed to transfer compression loads. As a result of the eccentric loading of the pile group, PA1 is now in tension. This means the pile is subjected to uplift forces that might otherwise cause it to be pulled out of the ground. Therefore, the pile group will fail if the piles are not designed to resist uplift forces.
Construction engineers must give more attention to the positioning of columns to ensure that column centerlines align with the centroid of pile groups. Indeed, the load capacity of piles is usually factored by 2 – 2.5, but this should not prevent construction engineers from constructing with due diligence.
Reference(s)
[1] Di Laora, R., de Sanctis, L. & Aversa, S. Bearing capacity of pile groups under vertical eccentric load. Acta Geotech. 14, 193–205 (2019). https://doi.org/10.1007/s11440-018-0646-5
At normal temperatures, structural design requires the structure to support the design ultimate loads (the ultimate limit state) while also limiting deformation and vibrations under serviceability circumstances (the serviceability limit state). The fire resistance design of steel columns and beams is aimed at maintaining the structural integrity of the structure at elevated fire temperature within a stipulated time. At room temperature, the structure’s design effort is primarily focused on preventing excessive deformations.
The basic goal of fire-resistant design is to prevent collapse before the stated fire resistance duration expires. During a fire, large deformations are normal and do not need to be calculated in the fire design. For a particular fire loading, the load-bearing function of a steel member is assumed to be lost at time t, when:
Efi,d = Rfi,d,t ——– (1)
where; Efi,d is the design value of the relevant effects of actions in the fire situation; Rfi,d,t is the design value of the resistance of the member in the fire situation at time t.
Figure 1: Burning steel structure
Rfi,d,t represents the design resistance of a member in a fire situation at time t, which can be Mfi,t,Rd (design bending moment resistance in a fire situation), Nfi,t,Rd (design axial resistance in a fire situation), or any other force (separately or in combination), and the corresponding values of Mfi,Ed (design bending moment in a fire situation), Nfi,Ed (design axial force in the fire situation), etc. represent Efi,d.
The design resistance Rfi,d,t at time t shall be determined by reducing the design resistance for normal temperature design according to EN 1993-1-1 to account for the mechanical properties of steel at elevated temperatures (assuming a consistent temperature across the cross section). The differences in the equations for cold and fire design are mostly related to the shape of the stress-strain diagram at ambient temperature and the shape of the diagram at elevated temperature. Figure 2 shows this schematically.
Figure 2: Stress-strain relationship of steel and normal and high temperature
When employed at greater temperatures, some adaptation to the design equations established for room temperature circumstances is required. If a non-uniform temperature distribution is employed, the normal temperature design resistance to EN 1993-1-1 should be changed based on this temperature distribution.
Fire Resistance Design of Steel Columns
The most important design requirements of steel structures is the verification of the buckling and shear resistance of the column. For uniaxial or biaxial bending of steel columns, the interaction factors should be duly considered.
Buckling Resistance
The design value of the compression force in the fire situation, Nb,fi,Ed, at each cross section should satisfy the following condition:
Nb,fi,Ed/Nb,fi,t ,Rd ≤ 1.0 ——– (2)
where the design buckling resistance Nb,fi,t,Rd at time t of a compression member with a Class 1, Class 2 or Class 3 cross section with a uniform temperature θa should be determined from:
Nb,fi,t ,Rd = χfiAky,θfy / γM,fi ——– (3a)
and for Class 4 cross sections
Nb,fi,t ,Rd = χfiAeff k0.2p,θ fy /γM,fi ——– (3b)
where; ky,θ is the reduction factor for the yield strength of steel at uniform temperature θa ,reached at time t. k0.2p,θ is the reduction factor for the 0.2% proof strength of steel at uniform temperature θa, reached at time t,. Aeff is the effective area of the cross section when subjected only to uniform compression; χfi is the reduction factor for flexural buckling in the fire design situation, given by Eq. (5.45).
The value of χfi should be taken as the lower of the values of χy,fi and χz,fi determined according to:
χfi = 1/[φθ + φθ2 −λθ2] ——– (4)
where; φθ = 0.5[1 + αλθ + λθ2] ——– (5)
and the imperfection factor, α , proposed by Franssen et al (2005) is given by;
α = 0.65 √235/fy ——– (6)
The non-dimensional slenderness λθ for the temperature θa, is given, for Class 1, 2 and 3 by;
λθ = λ √(ky,θ/kE,θ) ——– (7a)
and for Class 4 cross sections
λθ = λ √k0.2 p,θ/ kE,θ) ——– (7b)
where; λ is the non-dimensional slenderness at room temperature given by Eq. (8a) or Eq. (8b) using the buckling length in fire situation lfi . The non-dimensional slenderness at room temperature, λ, is given by;
λ = √(Afy/Ncr) ——– (8a)
for Class 1, 2 and 3 cross sections or;
λ = √(Aefffy/Ncr) ——– (8b)
for Class 4 cross sections.
where Ncr is the elastic critical force for flexural buckling based on the gross cross sectional properties and in the buckling length in fire situation, lfigiven by;
Ncr = π2EI/lfi2 ——– (9)
where; E is the Young’s modulus at room temperature; I is the second moment of area about y-y or x-x axis based on the gross cross sectional properties; lfiis the buckling length in fire situation.
The buckling length lfi of a column for the fire design situation should generally be determined as for normal temperature design. In the case of a braced frame, the buckling length lfiof a continuous column may be determined by considering it as fixed to the fire compartments above and below, provided that the fire resistance of the building components that separate these fire compartments is not less than the fire resistance of the column.
Figure 3: High-rise building under fire
Shear Resistance
The design value of the shear force in a fire situation, Vfi,Ed at each cross section should satisfy;
Vfi,Ed/Vfi,t ,Rd ≤ 1.0 ——– (10)
where the design shear resistance Vfi,t ,Rd at time t for a Class 1, Class 2 or Class 3 cross section should be determined from:
Vfi,t ,Rd = ky,θ,webVRd [γM0/ γM,fi] ——– (11)
where; VRd is the shear resistance of the gross cross section for normal temperature design, according to EN 1993-1-1, and given in Eq. (12); θweb is the average temperature of the web; ky,θ,web is the reduction factor for the yield strength of steel at the web temperature θweb.
It should be noted that when a uniform temperature is considered in the design, the average temperature in the web is equal to the uniform temperature in the section. Alternatively, the temperature in the web can be determined using the section factor of the web. For an I-section, the section factor can be approximated as kshAm / V = ksh2/tw , where the correction factor for the shadow effect is taken for the full section or, in a more accurate way, as the view factor evaluated as shown in Section 4.9.
The shear resistance of the gross cross section for normal temperature design is given (according to EN 1993-1-1) by;
Vpl,Rd = Av(fy/3)/γM0 ——– (12)
where Av is the shear area
Substituting Eq. (11) into Eq. (12), and considering a uniform temperature distribution, gives the following expression for the design shear resistance;
Vfi,t ,Rd = Avky,θfy/√3γM,fi ——– (13)
Design Example (Franssen and Real, 2015)
Consider a 3.5 m long HE 180 B column in S275 grade steel, located in an intermediate storey of a braced frame and subject to a compression load of Nfi,Ed = 495 kN in the fire situation. Assuming that the column doesn’t have any fire protection and that the required fire resistance is R30, verify the fire resistance in each of the following domains:
a) Temperature; b) Time; c) Resistance.
Solution: Classification of the cross section: The relevant geometrical characteristics of the profile for the cross section classification are;
h = 180 mm b = 180 mm tw = 8.5 mm tf = 14 mm r = 15 mm c = b/2 − tw/2 − r = 70.75 mm (flange) c = h − 2tf − 2r = 122 mm (web)
As the steel grade is S275 ε = 0.85 √(235/fy) = 0.786 The class of the flange in compression is c/tf = 70.75/14 = 5.1 < 9ε = 7.07 ⇒ Class 1
The class of the web in compression is d/tw = 122/8.5 = 14.4 < 33ε = 25.9 ⇒ Class 1
The cross section of the HE 180 B in fire situation is Class 1. This classification could be directly obtained using the table for cross sectional classification of Annex F, Vila Real et al (2009b).
Evaluation of the critical temperature: For the HE 180 B: Area, A = 6525 mm2 Second moment of area, Iz = 13630000 mm4 The design value of the compression load in fire situation: Nfi,Ed = 495 kN The buckling length for intermediate storey is: lfi= 0.5L = 0.5 × 3.5 = 1.75 m
The Euler critical load takes the value:
Ncr = (π2EI)/lfi2 = 9224414 N
The non-dimensional slenderness at elevated temperature is given by Eq. (5.48) λθ = λ ⋅√(ky,θ/kE,θ)
This is temperature dependent and an iterative procedure is needed to calculate the critical temperature. Starting with a temperature of 20ºC at which ky,θ = kE,θ = 1.0, equations (5.48), and (5.49) give:
Therefore the reduction factor for flexural buckling is: χfi = 1/[0.730 + √(0.7302 − 0.4412)] = 0.763
The design value of the buckling resistance Nb,fi,t,Rd at time t = 0, is obtained from Eq. (5.44):
Nb,fi,0,Rd = χfiAfy / γM,fi = 1368 kN
and the degree of utilisation takes the value:
μ0 =Nfi,Ed/Nfi,0,Rd = 495/1368 = 0.362
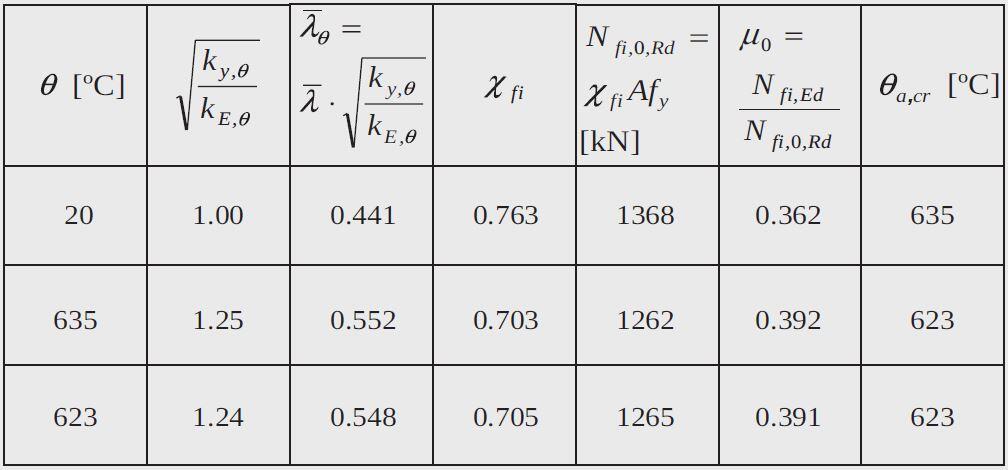
For this degree of utilisation Eq. (5.104) gives a critical temperature, θa,cr = 635 ºC. Using this temperature, the non-dimensional slenderness λθ can be corrected, which leads to another critical temperature. The iterative procedure should continue until convergence is reached, as illustrated in the next table:
Adapted from Franssen and Real (2015)
After three iterations a critical temperature of θa,cr = 623 ºC is obtained.
The verification of the fire resistance of the column may be now made. a) The section factor of the HE 180 B is Am/V = 159 m−1 .
and the shadow factor ksh ksh = 0.9 [Am/V]box / [Am/V] = (0.9 × 110.3 ]/159 = 0.624
The modified section factor is: ksh[Am/V]b = 0.624 × 159 = 99.2 m−1
This value could be directly obtaining from the table of Annex E, Vila Real et al (2009a). Interpolating, from table of the Annex A.4 yields the following temperature after 30 minutes:
θd = 766 ºC and θd > θa,cr ⇒ not satisfactory.
b) By double interpolation of table of the Annex A.4 the time needed to reach a temperature of 623 ºC is;
tfi,d = 17.4 min and tfi,d < tfi,requ ⇒ not satisfactory.
c) The reduction factors for the yield strength and the Young’s modulus after 30 minutes of fire exposure are, interpolating in Table 5.2 for a temperature of 766 ºC: ky,θ = 0.1508 and kE,θ = 0.1036
The design value of the buckling resistance is obtained from;
Nb,fi,t ,Rd = χfiAky,θfy/γM,fi
The non-dimensional slenderness at 766 ºC, is λθ = λ ⋅√(ky,θ/kE,θ) = 0.441√(0.1508/0.1036) = 0.532
and using
φθ = 0.5[ 1 + αλθ +λθ2] with α = 0.65 √(235/fy) gives φθ = 0.8014 and the reduction factor for the flexural buckling is: χfi = 1 / [φθ + φθ2 − λθ2] = 0.714
The design value of the buckling resistance after 30 minutes of fire exposure, takes the value: Nb,fi,t ,Rd = χfiAky,θfy /γM,fi = (0.714 × 6525 × 0.1508 × 275 × 10−3)/1.0 = 193 kN
and
Nb,fi,t ,Rd < Nfi,d ⇒ not satisfactory. The column does not fulfil the required fire resistance R30.
References Franssen J. and Real P. V. (2015): Fire Design of Steel Structures (2nd Edition). ECCS – European Convention for Constructional Steelwork
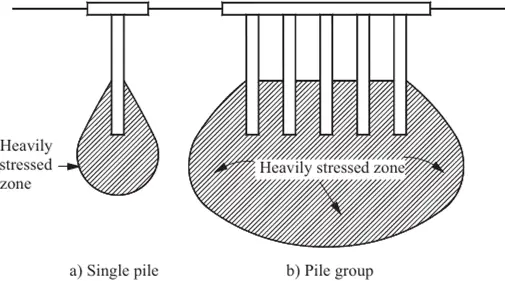
In many cases, the load bearing capacity of a group of vertically loaded piles is smaller than the sum of the capacities of the individual piles that make up the group. The elastic and consolidation settlements of the group are always bigger than a single pile carrying the same working load as each pile within the group. This is due to the fact that the zone of soil or rock that is stressed by the entire group is significantly wider and deeper than the zone beneath a single pile.
Even while loading tests on a single pile have shown good performance, group action in piled foundations has resulted in several recorded examples of failure or excessive settlement. It is therefore very important to check the settlement and bearing capacity of pile groups.
Figure 1: Comparison of stressed zones beneath single pile and pile group (a) Single pile (b) Pile group
A single pile driven to a satisfactory depth in a compact or stiff soil layer underlain by soft compressible clay is a classic case of foundation failure. When a single pile is loaded (Figure 1(a)), the latter formation is not significantly stressed, but when the weight from the superstructure is applied to the entire group, the stressed zone spreads down into the soft clay. The group may then experience excessive settlement or full shear failure (Figure 1(b)).
The allowable load on pile groups is frequently established by ‘efficiency formulas,’ in which the group’s efficiency is defined as the ratio of the average load per pile when the entire group fails to the load at failure of a single comparable pile. While there are so many of pile group efficiency equations to choose from, these equations should be used with caution, as they may be little more than a fair guess in many circumstances. The Converse-Labarre Formula is one of the most extensively used group-efficiency formulae;
Eg = 1 – {[θ(n – 1)m + (m – 1)n]/90mn} ——- (1)
Where; m = number of columns in the pile group n = number of rows in the pile group θ = tan-1(d/s) in degrees d = diameter of the piles s = spacing of the piles
Most of the varying efficiency ratios are solely developed based on personal experience, with no connection to soil mechanical theory. As a result, Tomlinson (2004) argues that this is not a desirable or logical approach to the problem, and instead prefers to design methods based on the assumption that the pile group behaves as a block foundation with a degree of flexibility that is determined by the rigidity of the capping system and the superimposed structure.
When applying soil mechanics methods to the design of pile groups, it’s important to keep in mind that, whereas the installation method influences the selection of design parameters for skin friction and end bearing in the case of a single pile, the installation procedure has less of an impact when considering group behaviour.
This is due to the fact that the zone of soil disturbance occurs only within a few pile diameters surrounding and beneath each individual pile, whereas the soil is considerably stressed to a depth equal to or higher than the group’s breadth (Figure 1(b)). The majority of this zone is located below ground level, which has been disrupted by the pile construction.
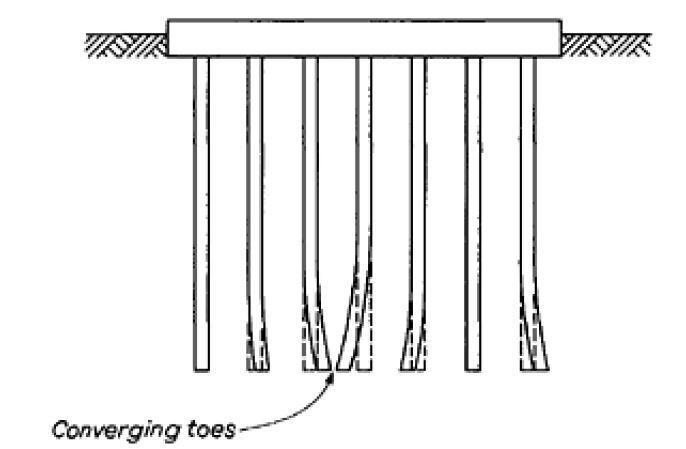
If two or more piles depart from alignment and come into close contact at the toe, there is a risk of severe base settlement when piles are erected in small numbers. As shown in Figure 2, the toe loads are concentrated over a limited region, and while failure would not occur if the end bearing safety factor was appropriate, the settlement would be greater than when the piles were spaced at their design spacing. As a result, the piles in the group would undergo differential settlement.
Figure 2: Effect of deviation of piles from correct alignment in group
Spacing of Piles in a Group
In clays, the selection of a centre-to-centre spacing of at least three pile diameters, with a minimum of 1m, is a precaution against severe base settlement due to close alignment of piles. For friction piles, BS 8004 requires a centre-to-centre spacing of not less than the perimeter of the pile or three times the diameter of circular piles.
For piles carrying their load mostly in end bearing, closer spacing can be used, but the distance between neighbouring piles must not be less than their minimum width. The spacing of piles with larger bases requires special attention, including a study of the interaction of stresses and the impact of construction tolerances.
The Swedish piling code gives the following minimum centre-to-centre spacing for end-bearing and friction piles;
Pile Length (m)
Circular Pile
Square Pile
Less than 10 m
3 x Diameter
3.4 x width
10m – 25m
4 x Diameter
4.5 x width
> 25 m
5 x Diameter
5.6 x width
In all cases the centre-to-centre spacing should not be less than 0.8m.
Ultimate Bearing Capacity of Pile Group in Clay
There is no risk of general shear failure of the group if piles in groups are driven through soft clays, loose sand, or fill to end in a stiff clay, as long as there is an enough safety factor against single pile failure. However, the group’s settlement must be determined.
If a group of piles must be terminated totally within a soft clay (which is not recommended), the group’s safety factor against ‘block failure’ must be determined. Equation (2) is used to compute the ultimate bearing capacity of the block of soil enclosed by the group.
Q = 2D(B + L)ca + 1.3cbSNcBL ——- (2)
where; D is the depth of the piles below ground level, B is the overall width of the group, L is the overall length of the group, ca is the average cohesion of the clay over the pile embedment depth, cb is the cohesion of the clay at the pile base level or within the zone of soil below the base affected by the loading, s is a shape factor, and Nc is the bearing capacity factor.
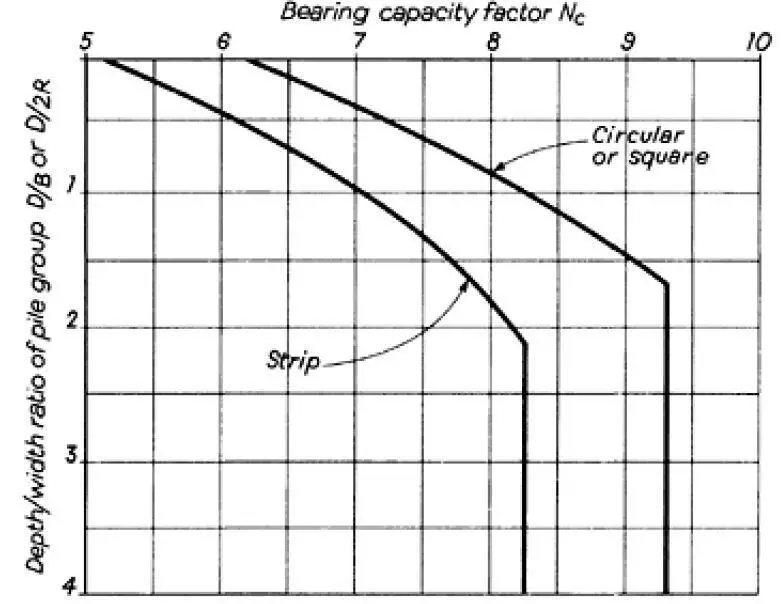
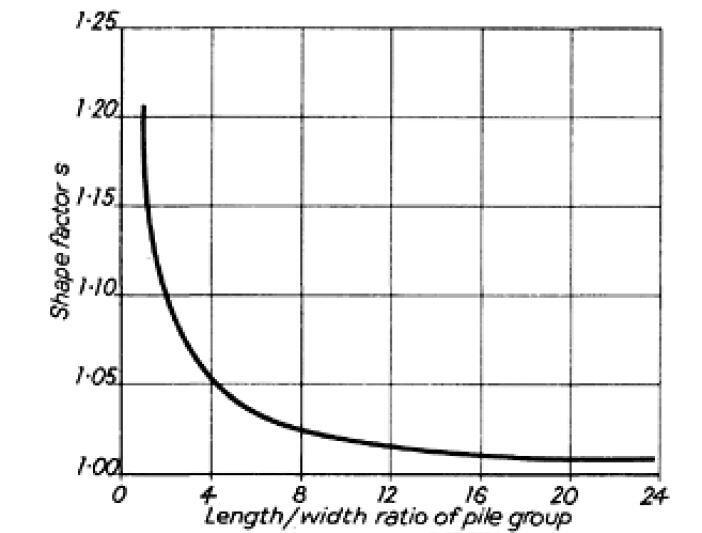
The remoulded shearing strength should be considered if the pile group is required to handle the full working load within a few days or weeks of the piles being put. Because the majority of the zone in which general shear failure would occur remains undisturbed, undisturbed cohesion can be employed for cb in most circumstances. Nc values are determined by the group’s depth to width ratio (Figure 3). The length to width ratio determines the shape factor s, and suitable values are indicated in Figure 4.
Figure 4: Shape factor for rectangular pile groups (Meyerhof-Skempton)
Ultimate Bearing Capacity of Pile Group in Sand
There is no risk of block failure of a pile group terminated in and applying stress to a cohesionless soil if each individual pile has an acceptable safety factor against failure under compressive pressure. The piles must be designed with high-end bearing loads for economy.
When piles deviate from their intended line, as with piles terminating in clay, there is a potential of differential settlement between adjacent piles if the toe loads of a small group become concentrated in a small location. The simplest way to avoid this is to keep the piles separated by a reasonable amount of space.
During the waterproofing of basements, the architect or structural engineer, or another party such as the contractor or specialised subcontractor, could perform a number of duties related to achieving basement watertightness. Generally, waterproofing systems should be designed to resist the passage of water and moisture to internal surfaces.
As a result, it will be necessary to explicitly identify the roles of each member of the design team in respect to these challenges from the start, as well as to notify the client. The requirement for a resident engineer on large projects should be explored with the client.
The first step in planning a basement waterproofing programme is to ensure that the membrane or other waterproof barrier is raised to the appropriate height. Borehole data isn’t usually a good indicator of the actual level of ground water surrounding a finished basement’s walls. The basement, for example, could be built on a sloping slope to act as a barrier to ground water seepage over the property.
On the uphill side of the structure, this will result in a rise in groundwater level. Borings on a clay site may reveal only sporadic water seepages at depth. Water may gather in the backfilled space surrounding the walls once the basement is finished, especially if the backfilling was placed in a loose state. The compartment could operate as a sump for surface water that collects around the walls and rises to near ground level.
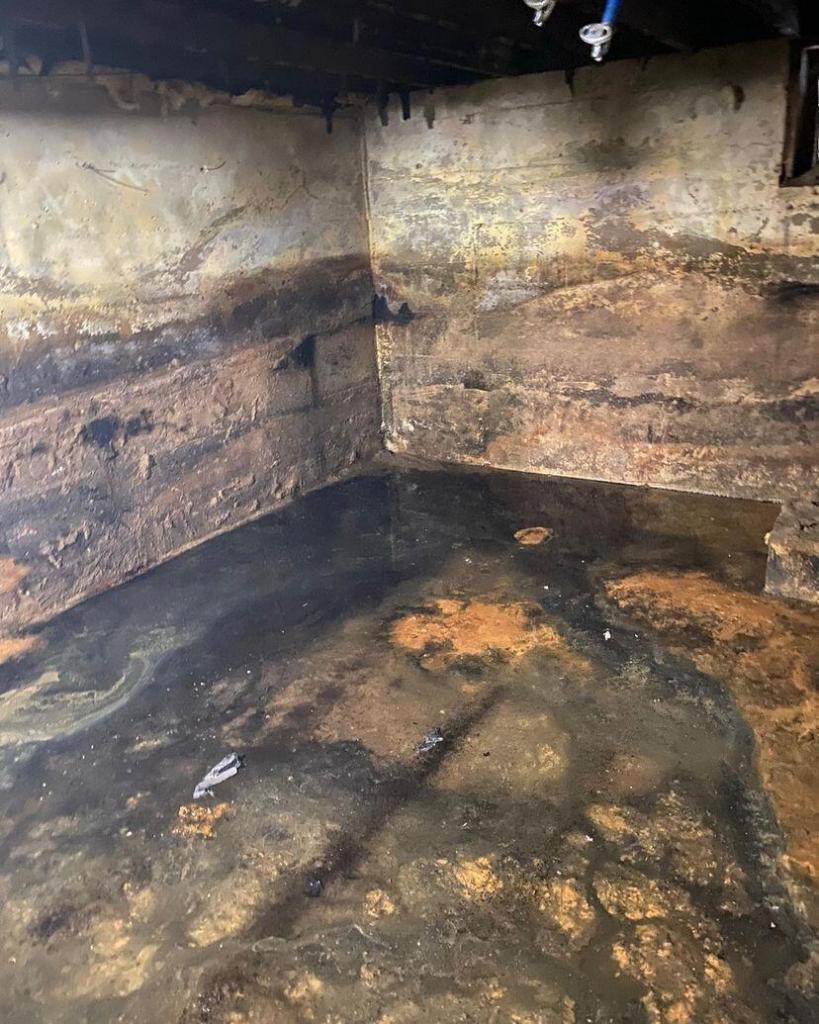
Figure 1: Basement ruined by ground water ingress
Generally, waterproofing of basements should reach 150mm above the external ground level and link with damp-proofing in the superstructure. This is usually accomplished by connecting a continuous cavity tray to the below-ground waterproofing system. The link between the below-ground and above-ground waterproofing systems should be connected and constructed with the right materials.
When waterproofing is connected to an above-ground structure via a cavity tray, the materials must be able to:
compress to form a watertight seal, and
bear the load.
Generally, construction works that are at risk of coming into contact with groundwater and generally require waterproofing include:
basements
semi-basements
below ground parking areas
underground water tanks and swimming pools
lift pits
cellars
storage or plant rooms
service ducts, or similar, that are connected to the below ground structure
stepped floor slabs where the retained ground is greater than 150mm.
Elements forming a waterproofing structure below ground including: foundations, walls and floors, shall adequately resist movement and be suitable for their intended purpose. Issues to be taken into account include:
a) site conditions b) structural design c) durability d) movement e) design co-ordination.
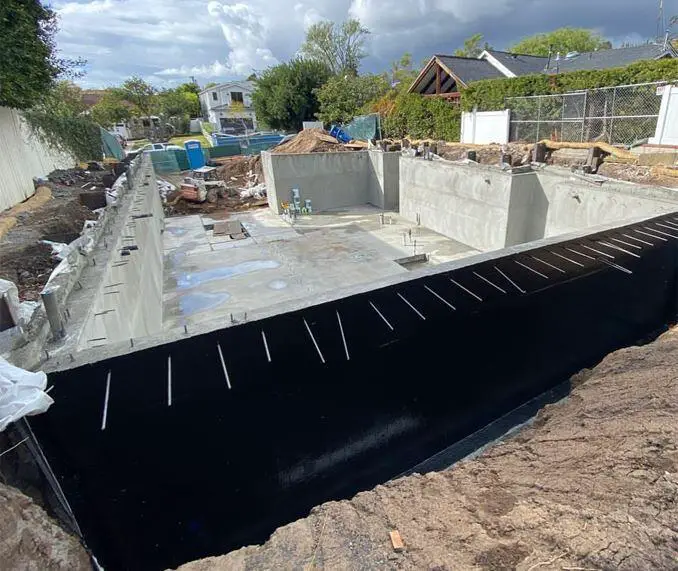
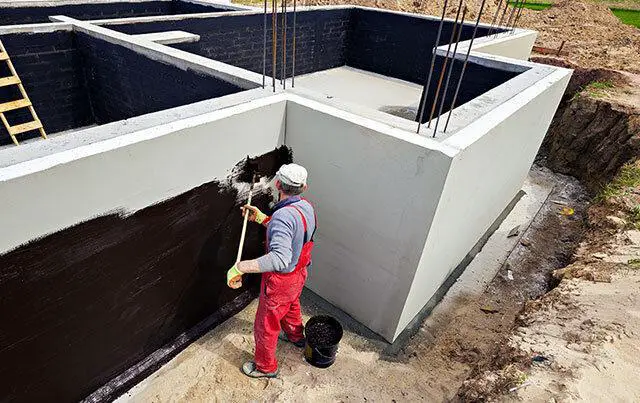
Figure 2: Waterproofing of a basement wall using coatings
Grades of Basements
During the design and waterproofing of basements, the client must describe the intended use of the basement space, as well as whether flexibility is required to allow for future changes of usage. The client’s final brief to the design team is usually developed through an interactive consultation process between the client and the design team. The term ‘waterproof’ basement should be avoided at all costs. Rather, acceptable levels of water and vapour penetration should be decided upon – see Table 1.
Grade of basement
Usage
Performance level
Relative humidity
Dampness
Wetness
1. (Basic utility)
Car parking Plant rooms (excluding electrical equipment) Workshops
Some leakage and damp areas tolerable. Local drainage may be required
65% normal UK external range
Visible damp patches may be acceptable
Minor seepage may be acceptable
2. (Better utility)
Workshops and plant rooms requiring drier environment than Grade 1 Retail storage
No water penetration but damp areas tolerable dependent on the intended use. Ventilation may be required to control condensation
35–50%
No visible damp patches, construction fabric to contain less than air dry moisture content
None acceptable
3. (Habitable)
Ventilated residential and commercial areas including offices restaurants etc. Leisure centres
Dry environment. No water penetration. Additional ventilation, dehumidification or air conditioning appropriate to intended use
40–60% 55–60% for restaurants in summer
None acceptable. Active measures to control internal humidity may be necessary
None acceptable
4. (Special)
Archives Landmark buildings and stores requiring controlled environment
Totally dry environment. Requires ventilation, dehumidification or air conditioning appropriate to intended use
50% for art storage 40% for microfilms and tapes 35% for books
Active measures to control internal humidity probably essential
None acceptable
Table 1: Guide to grades of basements: functional environmental requirements and levels of protection
The level of active and passive measures necessary to control the interior environment will be determined by this. BS 8102 includes a useful classification table as well as usage grades. The various grades are intended to qualitatively distinguish the various levels of performance. Table 1 reproduces this information along with recommendations from CIRIA Report R140 (Water-resisting basements), which details how to define the internal climate (temperature, humidity, and wetness) for various purposes within each basement grade.
Relative Humidity (RH) is determined by exterior and internal factors and managed internally by natural or mechanical ventilation within a basement. Waterproofing methods usually have no effect on it. The design team and client should discuss and agree on a plan for controlling RH. The recommended temperature levels are attained by the use of heating and insulation. They, like RH, are unaffected by waterproofing measures and hence are no longer a BS 8102 requirement. Special settings, such as archive or retail storage, require a heating/ventilation system as well as the right style of architecture. In the case of archival storage, BS 5454 provides useful recommendations.
Types of Water-resisting Construction/Protection
After determining the desired basement grade, the next step in the waterproofing of basements is to identify the right type of construction. Types A, B, and C of water-resistant construction/protection are identified in BS 8102. These are barrier, structurally integral, and drained protection, as discussed below.
The location of the water table is regarded crucial in terms of the eventual construction’s possible dangers. With any water table levels and basement grades, Type A, B, or C could potentially be suitable. It should be emphasised, however, that in areas with changeable or high water tables, additional procedures for Type A and piled wall construction are required. It should also be highlighted that reduced permeability of the external earth (where undisturbed) and primary structural wall lowers the risk.
Type A – Waterproofing Barrier Protection
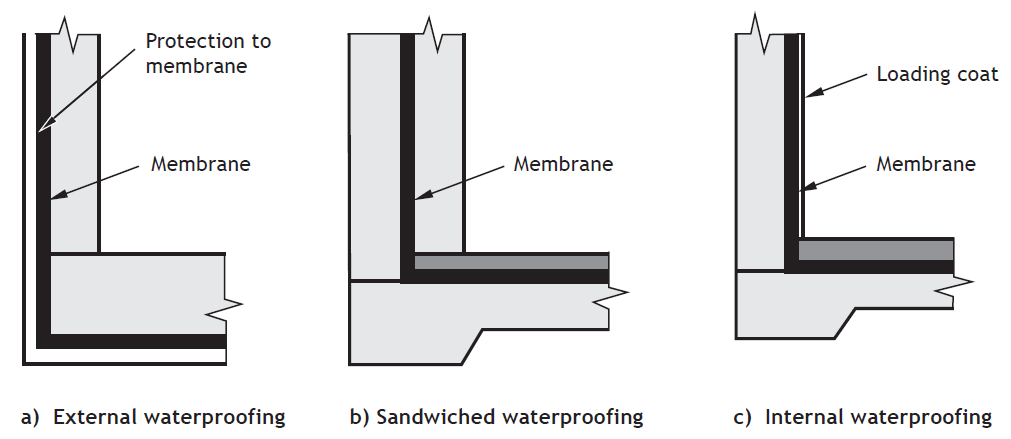
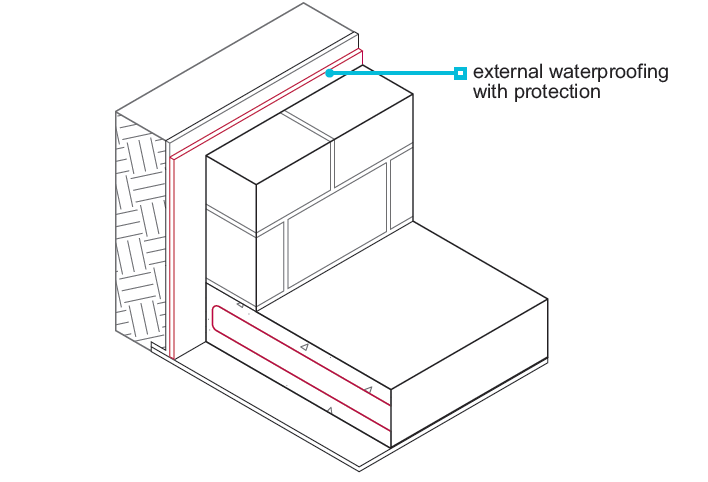
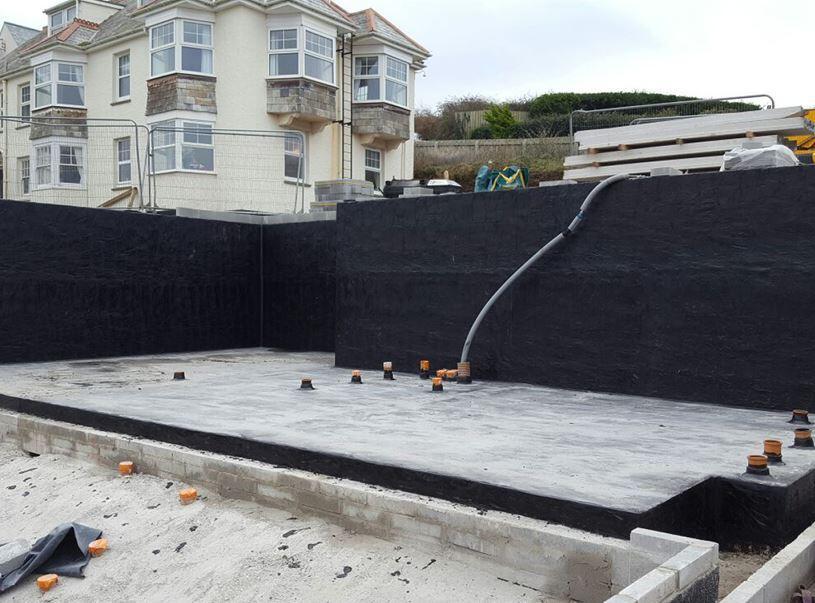
This type of construction, as shown in Figure 3, is entirely reliant on a continuous barrier of a waterproofing membrane, which can be applied to the exterior faces of walls and floors, sandwiched within the structure, or applied to the inner faces of walls. In Type A waterproofing, the structure itself does not prevent water ingress. Protection is dependent on the total water barrier system or water and vapour barrier system applied internally or externally or sandwiched between structural elements in accordance with manufacturers’ instructions. Edge thickenings are to be discouraged with external waterproofing.
Figure 3: Type A water-resisting construction (barrier protection)
Membranes are usually not applied to floor surfaces and left uncovered because they lack the necessary wear characteristics. If applied to the tops of slabs, a protective slab (or something similar) will be required to keep the membrane in place. A variety of waterproofing materials are available (see below).
Any chosen system should be able to withstand hydrostatic pressure and/or loading effects, as appropriate. Some waterproofing systems may also provide excellent vapour resistance. However, plain polyethylene sheet should not be used as a waterproofing system. The structure is not specifically designed to be watertight in this type of construction, but it may be designed to meet the requirements of BS EN 1992-1-1.
Figure 4: Barrier protection of basement wall
External membranes (or ‘tanking’) will obviously only be suitable where the external face can be accessed for initial construction. Access will limit the scope of subsequent repairs, and locating the source of any defect in a system that is not continuously bonded will be difficult, especially since defects may not become apparent until after construction.
Internally applied membranes will be easier to maintain, but their performance may be harmed by hydrostatic pressures and post-construction attachments. External membranes prevent early-age cracks from autogenously healing and encourage drying shrinkage cracks in concrete. Membranes may be used to protect the concrete structure in extremely aggressive ground conditions.
Type B – Structurally Integral Protection
Type B structure is often a reinforced concrete box that does not rely on applied membranes for water tightness (see Figure 5). The box is designed in accordance with BS EN 1992-3 so that water infiltration is minimised. Crack width limits are determined by the water table and/or the planned grade of use. Design to BS EN 1992-1-1 should be acceptable where the water table and risk are classed as low.
Figure 5: Type B water-resisting construction (structurally integral protection).
Type B systems acceptable to NHBC include:
in-situ concrete with or without admixtures and crack widths limited by design
in-situ high-strength concrete with crack widths limited by design and post-construction crack injections
precast concrete systems assessed in accordance with Technical Requirement R3.
The structure is unlikely to be totally vapour resistant without membranes, and other measures may be required. As a result, a type B basement may require conversion to a type A or C structure. Alternatively, and more commonly, the consequences of vapour penetration can be easily mitigated by the use of heating and/or ventilation. With the inclusion of vapour barriers, Type B building can accomplish all levels of internal environment.
Design details for reinforced concrete structures should include:
To avoid faults that allow water to pass through, good workmanship is required. Permeable concrete is a common fault caused by poor craftsmanship, such as inadequate compaction, honeycombed concrete, improper water bar installation, and poor joint preparation and contamination. Under high water table conditions, any water penetration through minor faults can be rectified from the inside.
Type C – Drained Protection
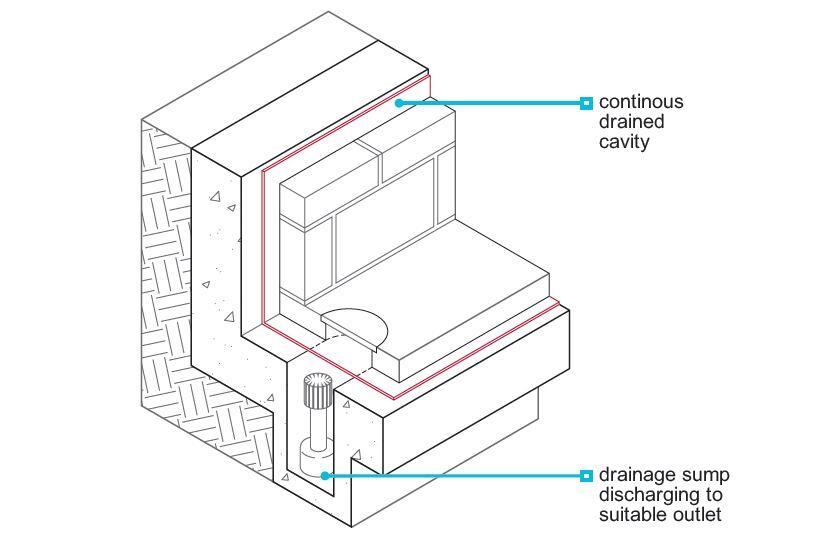
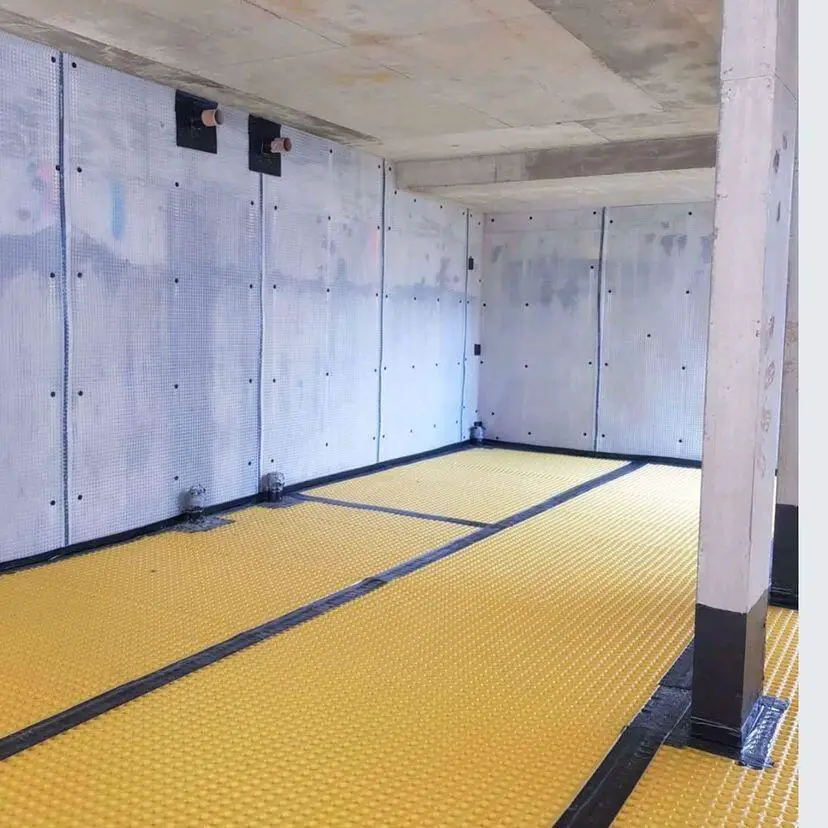
Type C building contains a drained cavity within the basement, which collects any seepage water and drains it to sumps for pumping out (see Figure 6). If any flaws are repaired and the system is maintained, a dry internal environment can be produced with certainty using a drained cavity wall and floor construction.
Figure 6: Type C water-resisting construction (drained protection).
The cavity and pumps may not be able to cope with the flows if the external wall and base slab do not substantially limit water infiltration. Large flows may also cause particles to be lost in the soils around them. Even tiny amounts of drained water may become a problem that necessitates negotiations with authorities.
It should be noted that significant amounts of groundwater pumped into sewers or rivers will normally not be approved by water authorities or the Environment Agency (EA), and specific provisions may be required to avoid loss of fine materials. If a drainage solution is chosen, maintenance requirements must be taken into account in case the drain or filter becomes clogged or fails. If no room is made for maintenance, ineffective drains and filters are likely to cause difficulties.
The cavity should not be used to conceal major leaks, according to CIRIA Report R140. When using water bars, make sure they are continuous and cover all construction joints.
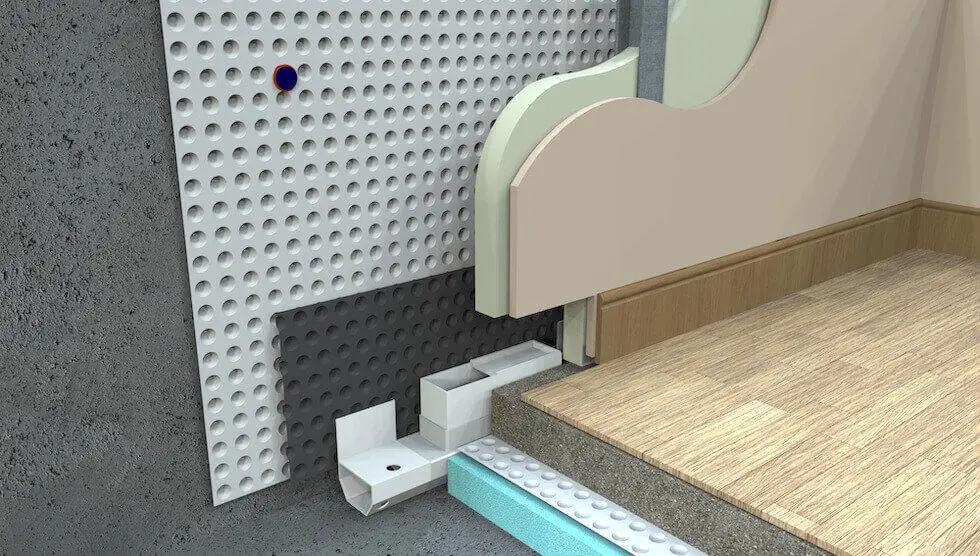
Flooding caused by the failure of drains or pumps, or drain blockage caused by silt or other sediments, are examples of defects that can occur with this type of construction. To collect water infiltration, proprietary channels are often incorporated at the base of the walls. In the case of a blockage, access should be accessible for cleaning the silt and rodding the drains. Some linings prevent access to the cavity behind them, thus it’s obvious that building any interior walls or linings as late as feasible will allow any problems to be seen and rectified.
Rule of Thumb for Structural Design of Water Resistant Basements
Minimum thickness Preferred minimum thickness of walls and slabs: 300mm Where thicker consider surface zones of 200mm each face for reinforcement to control shrinkage/thermal cracking
Reinforcement Typically for water resistant walls: T16 @ 200 c/c in both faces and in both directions, or T12 @ 150 c/c in both faces and in both directions
Standard concrete cover Assumed concrete grade 35 (this should be a minimum) Put the horizontal reinforcement furthest from earth face.
Face
Concrete Cover (mm)
Earth face of walls where shuttered
50
Earth face of walls (cast against earth)
75
External exposed faces of walls
40
Bottom and sides to base
75
Internal faces
Greater of 25 or bar diameter
Waterstops / waterbars
Required by BS 8102 for grade 1 basements with concrete design to BS 8110
Give extra “comfort” at construction joints, otherwise total reliance on workmanship
Not essential but often desirable
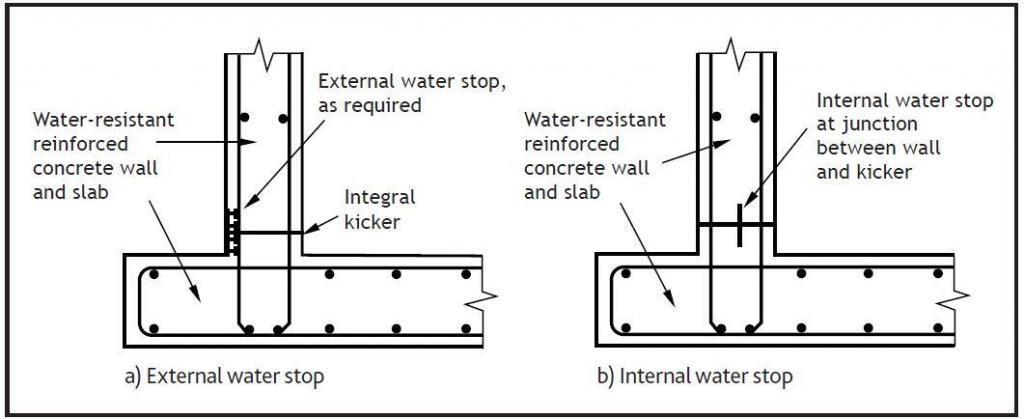
Use external waterstop for basements (preferred)
Can use centrestop in vertical construction if necessary (e.g. swimming pool), must be carefully supported/kept in place.
Materials for Waterproofing of Basements
Materials for waterproofing of basements should be suitable for the desired site, weather conditions, and any expected movements. There are a lot of proprietary systems out there. Choosing systems with Agreement certifications is a good idea, but the designer should think about the implications of any constraints listed in the certificates. When a vapour-proof system is necessary, further caution should be exercised. In general, it is not a good idea to mix systems.
Structural waterproofing can be done with a variety of products. They have been divided into seven distinct categories based on product kind, form, and application for simplicity of understanding. They are considered barrier systems for Type A protection, with the exception of Category 2. (but may be combined with Type B protection). Category 2 is a Type C protective mechanism that generates a drainable cavity. Below is a brief description of each category.
Category 1 – Bonded sheet membranes These are cold-applied or heat-bonded to the structure. They are flexible and can accommodate minor movements. There are also composite sheet membranes, which can be fixed to vertical formwork or laid on the ground prior to pouring the slabs.
Figure 7: Typical bonded sheet membrane
Category 2 – Cavity drain membranes These are high-density polyethylene sheets placed against the structure. The dimples form the permanent cavity. These are generally used internally. They are flexible and are able to adapt to minor settlement and shrinkage of substrate. These are not waterproofing membranes in themselves; but facilitate drainage of any water ingress (see Figure 8).
Figure 8: Cavity drain membrane
Category 3 – Bentonite clay active membranes These are sheets of sodium bentonite clay sandwiched between two layers of geotextile or biodegradable cardboard. When the clay meets water, it can swell to many times its original volume sealing any gaps or voids in the membrane. This category of membrane is used externally. Bentonite systems can be either bonded or unbonded. Where bonded, the system is simple to apply with minimum preparation of the substrate. The efficacy of the system under alternating drying and wetting conditions should be verified with manufacturers. It should not be used in acidic or excessively alkaline soil.
Category 4 – Liquid applied membranes These one- or two-part systems are applied cold as a bitumen solution, elastomeric urethane or modified epoxy. A loading coat (a layer of material designed to hold a Type A waterproofing compound in place when resisting water pressure) will be required if applied internally, and it must be strong enough to adhere to a suitable substrate and sustain hydrostatic pressure. In Type B protection, they can be utilised solely as a vapour barrier if the building can take the load. The membrane’s continuity is preserved due to its lack of joints. It is simple to apply, but proper surface preparation is required. They can protect the structure from aggressive soils and groundwater when applied externally. Minor substrate motions can be accommodated because the substrate is elastic and flexible.
Figure 9: Typical liquid applied membrane
Category 5 – Mastic asphalt membranes As a hot mastic liquid, these are applied in three coats. They harden into a waterproof layer as they cool. The application can be external or interior, but if applied internally, a loading coat is required. The likelihood of a defect in one coat being carried across all of the membrane’s coats is low. For complex foundation profiles, externally applied membranes are often unsuitable.
Figure 10: Mastic asphalt membrane
Category 6 – Cementitious crystallisation active systems These slurry coatings react with free lime in concrete, renders or mortars and block hairline cracks and capillaries. The chemicals remain active and will self-seal leaks. These products will not waterproof defective concrete (e.g. honeycombed areas).
Category 7 – Proprietary cementitious multi-coat renders, toppings and coatings These coatings usually incorporate a waterproofing component and are applied in layers generally internally but may also be external. They are effective against severe ground water infiltration. Mechanical fixings through the system should be avoided.
Finally, ancillary components should be assessed as part of the waterproofing system. Alternatively, an assessment of compatibility and satisfactory performance should be provided for materials and products that are interchangeable between different systems.
A braced frame is a structural system that is prevented from undergoing excessive sidesway under the effect of lateral loads by the provision of diagonal steel members (for steel structures) or shear walls/cores (for reinforced concrete structures). Therefore, braced frames are effective structural solutions for resisting lateral loads due to wind or earthquake in civil engineering buildings and structures. In effect, they provide the lateral stability needed in structures.
The stabilising members in a braced frame are usually made of structural steel, which can be very effective in resisting tensile and compressive forces. Most of the multi-story braced frames in the UK are designed as ‘simple construction,’ with nominally pinned connections between beams and columns. The horizontal force resistance of buildings in simple construction is provided by the bracing systems or cores in the global analysis.
As a result, the beams are designed to be simply supported, and the columns are merely designed to withstand moments caused by a minimal eccentricity in the beam-to-column connection (in conjunction with the axial forces). As a result, there is no need to consider pattern loading when calculating design forces in the columns.
Figure 1: A braced high-rise building
The Eurocodes take the ‘simple construction’ design approach into account. If the joint is categorised as ‘nominally pinned’ according to BS EN 1993-1-8, and this classification is based on previous satisfactory performance in similar instances, a ‘simple’ joint model, in which the joint is assumed not to transfer bending moments, may be utilised. The beam reactions are applied eccentrically to the columns in the regularly used joint configurations in the UK, which assume a pinned connection but also assume that the beam reactions are applied eccentrically to the columns.
The global analysis model may therefore assume pinned connections between the columns and the beams for braced frames constructed in accordance with BS EN 1993-1-1, provided that the columns are designed for bending moments due to eccentric reactions from the beams.
Bracing Systems
The beams and columns in a multi-story building are typically placed in an orthogonal pattern in both elevation and plan. Two orthogonal bracing systems provide horizontal force resistance in a braced frame building:
Vertical Bracing, and
Horizontal bracing
Vertical bracing
Vertical bracing (between lines of columns) provides load pathways that carry horizontal forces to the ground level while also providing stiff resistance to overall sway. The vertical bracing planes in a braced frame multi-story building are commonly provided by diagonal bracing between two lines of columns, as shown in Figure 2.
Figure 2: Cantilever Truss
Single diagonals, as shown, must be designed for either tension or compression, however crossing diagonals can be utilised with narrow bracing components that do not resist compressive stresses (then only the tensile diagonals provide the resistance). The floor beams participate as part of the bracing system when crossing diagonals are used, and it is considered that only the tensile diagonals produce resistance (in effect a vertical Pratt truss is created, with diagonals in tension and posts in compression).
Vertical bracings must be designed to withstand the following forces:
Wind forces
Equivalent horizontal forces, which illustrate the effects of initial imperfections
For the right combinations of actions, forces in specific members of the bracing system must be determined. Design forces at ULS are anticipated to be the most onerous for bracing members due to the combination where wind load is the dominating action. Bracing members that are inclined at about 45 degrees are preferred whenever possible.
This results in an efficient system with low member forces compared to other configurations, as well as compact connection details where the bracing meets the beam/column joints. The sway sensitivity of the structure will be increased by narrow bracing systems with steeply inclined interior elements. Structures with extensive bracing will be more stable.
Figure 3: Installation of braces in a steel building
In a building, at least two vertical bracing planes in each orthogonal direction must be provided to avoid disproportionate collapse. There should be no considerable component of the structure braced by only one plane of bracing in the direction being studied since there would be no other restraint system in that direction if the local failure occurred in one of its parts.
Types of Vertical Bracing
Different types of bracing systems can be adopted for the lateral stability of framed structures. Diagonally Braced Frames, V-Braced Frames, and Chevron Braced Frames are three popular forms of concentrically braced frames. Studies have shown that the seismic excitation due to earthquake can be efficiently resisted by concentrically braced frames. This means that the braces, columns, and beams resist lateral seismic acceleration predominantly through axial forces (tension and compression) and deformation.
In order to appreciate the effects of bracing, let us consider the unbraced frame loaded as shown in Figure 4;
Figure 4: Typical unbraced frame
Under the applied load, the deflection in the frame is shown in Figure 5;
Figure 5: Deflection of an unbraced frame
Now, let us consider the effects of different bracing systems on the deflection behaviour of the frame.
Single Diagonal Bracing
Single diagonal bracing is considered effective in resisting lateral loads. They are formed by introducing single diagonal members to the frame (trussing). When lateral load is applied to the braced frame, the diagonal braces are subjected to compression while the horizontal web acts as the axial tension member in order to maintain the frame structure in equilibrium. If we consider the frame shown in Figure 4, let us introduce diagonals with the same member property UB 152 x89x16 as shown in Figure 6;
Figure 6: Framed structure with single diagonal bracing
Interestingly, the introduction of single diagonal bracing reduced the lateral displacement of the frame by 99.34% as shown in Figure 7. In this case, the columns on the left-hand side and the diagonals of the braced frame were in tension, while the horizontal beams and the columns on the right-hand side were in axial compression.
Figure 7: Deflection of framed structure with single diagonal bracing
Cross Bracing (X-Braced Frames)
In cross-braced frames, two diagonal members cross each other to form an X-shape. These simply need to be tension-resistant, with one brace functioning at a time to resist lateral loading, depending on the loading direction. Steel cables can therefore be utilised for cross-bracing. The performance of the tension braces in the design of single diagonal braces and X-bracing depends on the stiffness, resistance and ductility.
Figure 8: Framed structure with cross bracing (x-bracing)
When cross bracing is applied to the frame, the deflection is shown in Figure 9;
Figure 9: Deflection of framed structure with cross bracing (x-bracing)
The result shows that x-braced frame is more efficient than single diagonal cross bracing in reducing the lateral displacement of the structure. However, this usually comes at the expense of extra cost, and increased bending of the horizontal beams. From the structural behaviour, it was observed that one of the braces is in tension, while the other is in compression (depending on the direction of the load).
V-Bracing (Chevron Bracing)
A chevron bracing is formed by introducing v-shaped braces into the frame. Chevron braces are known for their high elastic stiffness and strength. Unlike cross-bracing, chevron bracing is also effective in increasing architectural functionality. This is necessary in order to arrange the window and entrances in the braces bay.
However, under the effect of lateral load, however, uneven forces are formed on the braces. This is because the compression bracing will deform while the tension braces will remain in place to maintain the tension force during lateral loading.
Figure 10: Typical installation of a chevron bracing on site
Under earthquake load, the tension and compression braces have a substantial influence on the unbalanced distributed force, which can induce elastic deflection of the braced frame. As a result of the deformation of the braces, the entire braces frame performs poorly. This means that at each level of braces bay, one brace resists the tension while the other brace resists compression. Before the buckling point, they both distribute the lateral stress equally in the elastic range.
The tension braces, on the other hand, maintain their tension after buckling, but the compression braces lose all of their axial load capacity. This contributes to the unbalanced distributed lateral load and result in a significant bending moment at the beam-brace intersection. As a result, the mid-span beam develops a plastic hinge and collapses due to its inability to withstand downward stresses.
For the frame loaded as shown in Figure 4, Chevron braces are were introduced as shown in Figure 11;
Figure 11: Framed structure with v-bracing (Chevron bracing)
The deflection of the frame under lateral load is shown in Figure 12;
Figure 12: Deflection of framed structure with Chevron bracing
The deflection behaviour of the x-braced frame and the chevron bracing are quite comparable.
Summary of the lateral deflection is shown in the Table below;
Frame Type
Lateral Displacement (mm)
Unbraced frame
1111.635 mm
Single diagonal bracing
7.313 mm
Cross Bracing (X-bracing)
4.648 mm
C-bracing (Chevron Bracing)
4.732 mm
Horizontal bracing
At each floor level, horizontal bracing (usually provided by floor plate action) provides a load route for horizontal forces (mostly from perimeter columns owing to wind pressure on the cladding) to be transferred to the vertical bracing planes.
At each floor level, a horizontal bracing system is required to transfer horizontal forces (mostly those transferred from the ends of perimeter columns) to the vertical bracing planes that provide resistance to horizontal forces. In multi-story braced frames, there are two types of horizontal bracing systems:
Diaphragms
Discrete triangulated bracing.
In most cases, the floor system will operate as a diaphragm without the need for extra steel bracing. If there is no slab at roof level, bracing, also known as a wind girder, may be necessary to carry the horizontal forces at the top of the columns.
If the horizontal bracing system at each floor level is relatively stiff (as it is when the floor acts as a diaphragm), the forces carried by each plane of vertical bracing are determined by its relative stiffness and placement, as well as the location of the horizontal forces’ centre of pressure.
Horizontal Diaphragm
Permanent formwork, such as metal decking connected to the beams by through-deck stud welding, and in-situ concrete infill, provide an effective rigid diaphragm to transfer horizontal forces to the bracing system. If precast concrete planks are to operate as a diaphragm, due thought must be given to ensure effective force transfer.
Planks and steelwork can have a coefficient of friction as low as 0.1, and even lower if the steel is painted. This will allow the slabs to glide over the steelwork and move relative to one another. Grouting between the slabs will only solve part of the problem; for significant shears, a more positive fastening system between the slabs and from the slabs to the steelwork would be necessary.
Reinforcement in the topping might be used to connect the planks. This could be mesh or ties running along both ends of a row of planks to ensure the entire panel functions as one. In most cases, a 10 mm bar at half the depth of the topping will suffice.
One of two approaches can be used to connect to the steelwork:
Provide ties between the topping and an in-situ topping to the steelwork (known as a ‘edge strip’).
Enclose the slabs with a steel frame (on shelf angles, or particularly provided limitation) and fill the gap with concrete. Shear connections should be installed on the steel beam to transfer forces between the in-situ edge strip and the steelwork.
The capacity of the connection should be verified if plan diaphragm forces are transferred to the steelwork by direct bearing (usually the slab bears on the face of a column). The plank’s capacity is often restricted by local crushing. In every scenario, in-situ concrete should be used to fill the gap between the plank and the steel.
Without additional safeguards, timber floors and floors made of precast concreted inverted tee beams and infill blocks (often referred to as “beam and pot” floors) are not considered suitable diaphragms.
Discrete Triangulated Bracing
A horizontal system of triangulated steel bracing is indicated when diaphragm action cannot be relied upon. In each orthogonal direction, a horizontal bracing system may be required. Horizontal bracing systems often span between the ‘supports,’ which are the vertical bracing’s positions. This configuration frequently results in a truss that spans the entire width of the structure and has a depth equal to the bay centres. Warren trusses, Pratt trusses, and crossing members are all common floor bracing arrangements.
The nature of the soil, its plasticity, clay content, soil structure, and other factors can all be used to determine whether or not a soil has the potential to be expansive. Expansive soils must be identified during the reconnaissance and preliminary stages of a site investigation in order to determine the best sample and testing methods to use.
Expansive soils can cause considerable damage to civil engineering structures and foundations. This is due to the high swelling pressure they exert on foundations as they absorb water. Furthermore, their high shrinkage on drying can also affect foundations negatively.
The methods for determining the swell potential of expansive soils can generally be divided into two types. The first category mainly involves measurement of physical properties of soils, such as Atterberg limits, free swell, and potential volume change. The second category involves measurement of mineralogical and chemical properties of soils, such as clay content, cation exchange capacity, and specific surface area (Nelson et al, 2015).
To detect expansive soils, practicing geotechnical engineers often rely solely on physical property measurements. However, agricultural and geological practitioners routinely measure mineralogical and chemical parameters, and the engineering community should not overlook them.
Many of the methods of identification simply detect the presence of minerals with the capacity to expand. Physical factors such as in situ water content and density are not taken into account. As a result, they do not always determine whether or not the natural soil deposit is genuinely expansive, nor do they assess the potential for expansion. Nonetheless, they serve as important indicators of the need to dig more into the expansivity potential.
Figure 1: Typical view of expansive soil
Identification of Expansive Soils Based on Physical Properties
These are the tests on the physical properties of soils that can be carried out in the laboratory to determine if the soil has the potential to be expansive. These tests are;
Methods Based on Plasticity
Expansive soils can be identified using the Atterberg limits. The plasticity index, PI, and the liquidity index, LI, are two indexes based on the Atterberg limits. One or both of these indices have been used in a variety of identification methods for expansive . More expansive minerals, on the whole, have a higher plasticity. According to Peck, Hanson, and Thornburn (1974), there is a general relationship between a soil’s plasticity index and its expansion potential, as illustrated in Table 1.
Table 1: Expansion Potential of Soils and Plasticity Index (Peck, Hanson, and Thornburn 1974)
Plasticity Index
Expansion Potential
0 – 15
Low
0 – 35
Medium
22 – 55
High
> 55
Very high
However, Zapata et al. (2006) observed that the plasticity index alone does not accurately predict the expansion potential of remoulded expansive soils. They concluded that associating expansion potential with the product of plasticity index and % passing the No. 200 (75 μm) sieve improves the correlation significantly. It’s vital to remember that, while a soil’s plasticity may indicate the presence of expansive minerals, it’s not a guarantee that the soil is expansive.
Atterberg limits and clay content can be combined into a parameter called activity, Ac. This term was defined by Skempton (1953) as;
Activity = Plasticity Index / (% by weight finer than 2μm)
According to Skempton, clays can be divided into three categories based on their activity. “Inactive” for activities less than 0.75, “normal” for activities between 0.75 and 1.25, and “active” for activities greater than 1.25. The biggest potential for expansion is found in active clays. Table 2 shows typical activity values for a variety of clay minerals. The largest growth potential is seen in sodium montmorillonite, as evidenced by the extremely high value of activity in Table 2.
Table 2: Typical Activity Values for Clay Minerals (Skempton 1953)
Mineral
Activity
Kaolinite
0.33 – 0.46
Illite
0.9
Montmorillonite (Ca)
1.5
Montmorillonite (Na)
7.2
Free Swell Test
The free swell test involves inserting a known volume of dry soil that has passed through the No. 40 (425 μm) sieve into a graduated cylinder filled with water and measuring the swollen volume after it has settled completely. The ratio of the change in volume from the dry to the wet condition over the initial volume, expressed as a percentage, is used to calculate the free swell of the soil.
The free swell value of a high-grade commercial bentonite (sodium montmorillonite) will range from 1200 to 2000 percent. According to Holtz and Gibbs (1956), soils with free swell values as low as 100 percent can expand significantly in the field when wetted under modest loading. In addition, according to Dawson (1953), certain Texas clays with free swell values in the 50 percent range have caused significant damage due to expansion. Extreme climate circumstances, along with the soil’s expansion tendencies, caused this.
The free swell index (FSI) is calculated as;
FSI = [(soil volume in water − soil volume in kerosene)/ soil volume in kerosene] × 100%
The expansion potential of the soil as classified according to the FSI is shown in Table 3.
Table 3: Expansion Potential Based on Free Swell Index
Free Swell Index (FSI)
Expansion Potential
< 20
Low
20 – 35
Medium
35 – 50
High
> 50
Very High
Potential Volume Change (PVC)
T. W. Lambe (1960) developed the potential volume change (PVC) method for the Federal Housing Administration. Figure 2(a) shows the PVC apparatus, which has been used by many states in the United States of America. The test consists of placing a remoulded soil sample into an oedometer ring. The sample is then wetted and allowed to swell against a proving ring in the device. The pressure on the ring is given as the swell index, which is connected to qualitative ranges of possible volume change using the chart in Figure 2(a) (Lambe 1960).
Figure 2: (a) Potential volume change (PVC) apparatus; (b) swell index vs. PVC.
The test’s simplicity is a benefit. The downside is that the proving ring’s stiffness is not uniform, allowing for varying degrees of swelling depending on the stiffness of the proving ring. The quantity of swelling allowed by the proving ring will affect the swelling pressure that develops. The swell index and PVC values are more beneficial for identifying potential expansive behaviour and should not be utilised as design parameters for undisturbed in situ soils because the test uses remoulded samples.
Expansion Test (EI) Test
The expansion index test entails compacting a soil at a saturation level of 50% ± 2% under standard conditions. The sample is subjected to a vertical pressure of 144 psf (7 kPa) and then flooded with distilled water. Equation is used to calculate the expansion index, which is reported to the closest whole number.
The expansion potential of the soil is classified according to the expansion index, as shown in Table 4.
Table 4: Expansion Potential Based on Expansion Index
Expansion Index (EI)
Expansion Potential
0 – 20
Very low
21 – 50
Low
51 – 90
Medium
91 – 130
High
> 130
Very high
The International Building Code (2012) and the International Residential Code (2012) both adopted the expansion index test for identification of an expansive soil. Both of the codes state the following:
Soils meeting all four of the following provisions shall be considered expansive, except that tests to show compliance with Items 1, 2, and 3 shall not be required if the test prescribed in Item 4 is conducted:
Plasticity Index (PI) of 15 or greater, determined in accordance with ASTM D 4318.
More than 10 percent of the soil particles pass a No. 200 sieve, determined in accordance with ASTM D 422.
More than 10 percent of the soil particles are less than 5 micrometers in size, determined in accordance with ASTMD422.
Expansion Index greater than 20, determined in accordance with ASTM D 4829.
Coefficient of Linear Extensibility (COLE)
The coefficient of linear extensibility (COLE) test measures the linear strain of an undisturbed, unconfined sample as it is dried from 5 psi (34 kPa) suction to oven-dry suction (150,000 psi = 1,000 MPa). A flexible plastic resin is applied to undisturbed soil samples during the procedure. The resin is impermeable to liquid water, but permeable to water vapor. Natural clods of soil are brought to a soil suction of 5 psi (34 kPa) in a pressure vessel.
Using Archimedes’ principle, they are weighed in air and in water to determine their weight and volume. After that, the samples are oven-dried, and another weight and volume measurement is done in the same way. COLE is a measurement of how much a sample’s dimension changes from wet to dry.
The value of COLE is given by:
COLE = ΔL∕ΔLD = (?dD∕?dM)0.33 − 1
where: ΔL∕ΔLD = linear strain relative to dry dimensions, ?dD = dry density of oven-dry sample, and ?dM = dry density of sample at 5 psi (34 kPa) suction.
The value of COLE is sometimes expressed as a percentage. Whether it is a percentage or dimensionless is evident from its magnitude. COLE has been related to swell index from the PVC test and other indicative parameters. The linear extensibility, LE, can be used as an estimator of clay mineralogy.
The LE of a soil layer is the product of the thickness, in centimeters, multiplied by the COLE of the layer in question. The LE of a soil is defined as the sum of these products for all soil horizons. The ratio of LE to clay content is related to mineralogy as shown in Table 5.
Table 5: Ratio of Linear Extensibility (LE) to Percent Clay
LE/Percent Clay
Mineralogy
< 0.05
Kaolinite
0.05–0.15
Illite
0.15
Montmorillonite
Standard Absorption Moisture Content (SAMC)
Yao et al. (2004) proposed the SAMC test as a means of identifying expansive soils. It was suggested in China’s Specifications for Highway Subgrade Design (CMC 2004). The SAMC test has the advantage of being simple. The SAMC is the water content at which a soil will reach equilibrium under specified conditions.
An undisturbed soil sample is placed on a porous plate within a constant humidity container above a saturated sodium bromide solution. After measuring the weight of the soil sample at equilibrium, it is oven-dried. The SAMC is determined as follows:
SAMC (%) = (We −Ws)/Ws
where: We = weight of sample at equilibrium (77 ∘F and 60% relative humidity) and Ws = weight of oven-dry sample.
China’s Specifications for Design of Highway Subgrades (CMC 2004) presents a method for classifying expansive soils based on the standard absorption moisture content, plasticity index, and free-swell values, as shown in Table 6.
Table 6: Classification Standard for Expansive Soils (CMC, 2004)
Standard Absorption Moisture Content (%)
Plasticity Index (%)
Free-Swell Value (%)
Swell Potential Class
< 2.5
< 15
< 40
Non-expansive
2.5 – 4.8
15 – 28
40 – 60
Low
4.8 – 6.8
28 – 40
60 – 90
Medium
6.8
> 40
> 90
High
Mineralogical Methods
The presence of montmorillonite in a soil can be used to determine whether or not the soil is potentially expansive. A clay’s mineralogy can be determined based on its crystal structure or by chemical analysis. X-ray diffraction (XRD), differential thermal analysis (DTA), and electron microscopy are all popular mineralogical identification procedures.
The amount by which X-rays are diffracted around crystals is used to calculate basal plane spacing in XRD. DTA involves heating a sample of clay and an inert material at the same time. The resulting thermograms are contrasted to those for pure minerals, which are plots of temperature difference vs applied heat. On the thermograms, each mineral exhibits distinct endothermic and exothermic reactions. The clay particles can be observed directly using electron microscopy.
The size and shape of the particles can be used to make a qualitative identification. X-ray absorption spectroscopy, petrographic microscopy, soil micromorphology, digital image analysis, atomic force microscopy, and diffuse reflectance spectroscopy are some more mineralogical techniques (Ulery and Drees, 2008). In engineering practice, mineralogical approaches are rarely applied. They’re especially beneficial for research.
Chemical Methods
The most common chemical methods that are used to identify clay minerals include measurement of cation exchange capacity (CEC), specific surface area (SSA), and total potassium (TP). These methods are described in the following sections;
Cation Exchange Capacity (CEC)
The total amount of exchangeable cations required to balance the negative charge on the surface of clay particles is known as the CEC. Milliequivalents per 100 grammes of dry clay are used to calculate CEC. Excess salts in the soil are first eliminated, then adsorbed cations are restored by saturating the soil exchange sites with a known cation during the test procedure. For a mineral with a higher imbalanced surface charge, the amount of known cation required to saturate the exchange sites is greater.
Chemical examination of the extract can reveal the nature of the cation complex that was removed. Clay mineralogy is linked to CEC. A high CEC value suggests the presence of a highly active clay mineral like montmorillonite, whereas a low CEC value indicates the presence of a non-expansive clay mineral like kaolinite. In general, as the CEC rises, so does the expansion potential. Table 7 shows typical CEC values for the three most common clay minerals (Mitchell and Soga, 2005).
Table 7: Typical Values of CEC, SSA, and TP for Clay Minerals (Mitchell and Soga, 2005)
Clay Mineral
Cation Exchange Capacity (CEC) (meq/100 g)
Specific Surface Area (SSA) (m2/g)
Total Potassium (TP) (%)
Kaolinite
1 – 6
5 – 55
0
Illite
15 – 50
80 – 120
6
Montmorillonite
80 – 150
600 – 800
0
To determine the CEC of a soil, a variety of methods can be used. CEC measurement necessitates complex and precise testing procedures that are rarely performed in soil mechanics laboratories. However, many agricultural soils laboratories undertake this test on a regular basis, and it is rather inexpensive.
Figure 3: Expansion potential as indicated by clay activity and CEAc (Nelson et al, 2015)
The graph in Figure 3 was created using data from the Natural Resources Conservation Service’s soil survey reports for soils in California, Arizona, Texas, Wyoming, Minnesota, Wisconsin, Kansas, and Utah. The CEAc (CEAc = CEC/clay content) versus Ac chart was used to create Figure 3, which was designed to be used as a generic classification method for potentially expanding soils.
Specific Surface Area (SSA)
The total surface area of soil particles in a unit mass of soil is described as the specific surface area (SSA) of a soil. The SSA of montmorillonite is substantially higher than that of kaolinite. Therefore, a clayey soil with a high SSA, will have a larger water holding capacity and better expansion potential (Chittoori and Puppala 2011).
A high SSA, on the other hand, does not always imply an expanding soil. If a soil has a high organic component, for example, that fraction may have a highly reactive surface with properties similar to those of a material with a large specific surface area (Jury, Gardner, and Gardner 1991). Several methods for determining a soil’s specific surface area have been devised. Adsorption of polar molecules, such as ethylene glycol, on the surfaces of clay minerals is the most prevalent approach.
The typical SSA values for the three basic clay minerals are shown in Table 7. The SSA of the montmorillonite minerals is around ten times that of the kaolinite group. Although within the same group of minerals, the range of typical SSA values indicated in Table 7 might vary by 100 percent or more, the variation in SSA between groups, notably for montmorillonite, is so great that mineral identification is usually attainable.
Total Potassium (TP)
The only clay mineral that includes potassium in its structure is illite. Therefore, the amount of potassium ions in a soil provides a direct indication of the presence of illite (Chittoori and Puppala 2011). Table 7 shows the differences in amount of total potassium between illite and the other two minerals. Thus, high potassium content is indicative of low expansion potential.
References
[1] China Ministry of Construction (CMC). 2004. “Specifications for the Design of Highway Subgrades.” JTG D 30, Beijing: Renmin Communication Press. [2] Chittoori, B., and A. J. Puppala. 2011. “Quantitative Estimation of Clay Mineralogy in Fine-Grained Soils.” Journal of Geotechnical and Geoenvironmental Engineering, ASCE 137(11): 997–1008 [3] Dawson, R. F. 1953. “Movement of Small Houses Erected on an Expansive Clay Soil.” Proceedings of the 3rd International Conference on Soil Mechanics and Foundation Engineering, 1, 346–350. [4] Holtz, W. G., and H. J. Gibbs. 1956. “Engineering Properties of Expansive Clays.” Transactions ASCE 121, 641–677. [5] International Building Code (IBC). 2012. International Building Code. Falls Church, VA: International Code Council. [6] International Residential Code (IRC). 2012. International Residential Code for One- and Two-Family Dwellings. Falls Church, VA: International Code Council. [7] Jury, W. A.,W. R. Gardner, andW. H. Gardner. 1991. Soil Physics (5th ed.). New York: John Wiley and Sons. [8] Lambe, T.W. 1960. “The Character and Identification of Expansive Soils, Soil PVC Meter.” Federal Housing Administration, Technical Studies Program, FHA 701. [9] Mitchell, J. K., and K. Soga. 2005. Fundamentals of Soil Behavior (3rd ed.). Hoboken, NJ: John Wiley and Sons. [10] Nelson J. D., Chao K. C., Overton D. D., Nelson E. J. 2015. Foundation Engineering for Expansive Soils. John Wiley & Sons, Inc [11] Peck, R. B., W. E. Hanson, and T. H. Thornburn. 1974. Foundation Engineering (2nd ed.). New York: John Wiley and Sons. [12] Skempton, A. W. 1953. “The Colloidal ‘Activity’ of Clays.” Proceedings of the 3rd International Conference on Soil Mechanics and Foundation Engineering, Switzerland, 1, 57–61. [13] Ulery, A. L., and L. R. Drees. 2008. “Mineralogical Methods,” In Methods of Soil Analysis, Part 5. Madison, WI: Soil Science Society of America. [14] Yao, H. L., Y. Yang, P. Cheng, and W. P. Wu. 2004. “Standard Moisture Absorption Water Content of Soil and Its Testing Standard.” Rock and Soil Mechanics 25(6): 856–859. [15] Zapata, C. E., S. L. Houston, W. N. Houston, and H. Dye. 2006. “Expansion Index and Its Relationship with Other Index Properties.” Proceedings of the 4th International Conference on Unsaturated Soils, Carefree, AZ, 2133–2137. [16] Zheng, J. L., R. Zhang, and H. P. Yang. 2008. “Validation of a Swelling Potential Index for Expansive Soils.” In Unsaturated Soils: Advances in Geo-Engineering, edited by D. G. Toll, C. E. Augarde, D. Gallipoli, and S. J. Wheeler. London: Taylor and Francis Group.