8.7 C
New York
Wednesday, April 2, 2025
Home Blog Page 21

Voided Slab Bridge Decks: Design and Construction

Utilizing void formers of some sort to create a voided slab is one of the most popular ways of reducing the weight of a solid slab. In the design of bridges, the deck serves as the primary component for distributing the traffic load to the supports. The deck slab may be solid or have longitudinal and transverse girders to distribute the load to the piers or abutment.

For the same span, solid slab type bridges require more steel and concrete than girder bridges do. The major load-bearing components of slab type superstructure bridges are the slabs themselves. Through the solid slabs, the loads are directly transferred to the substructure. Solid slab decks comprises of a solid section, without beams or voids (See Figure 1a). This type of deck is commonly used in the construction of short span bridges and culverts.

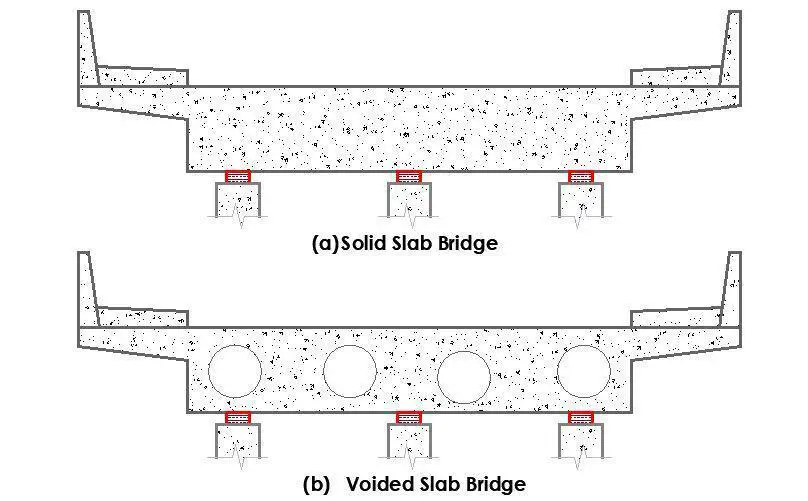
The dead load of a solid slab increases excessively for bridge spans longer than 10 metres, so to lighten the structure, voids with rectangular or circular cross sections are added close to the neutral axis (See Figure 1b). As a result, the use of voids inside the deck slab produces a favourable outcome by reducing the weight of the slab.

Solid Slab bridge and voided slab bridge
Figure 1: Typical cross-sections (a) Solid slab bridge deck (b) Voided slab bridge deck

When the voids are less than 60% of the overall structural depth, their effect on stiffness is minimal and the deck behaves more or less like a plate. In order to assure continuity in the transverse direction, voided slab decks are often constructed using cast in situ concrete with permanent void formers or precast prestressed concrete box beams post tensioned transversely.

In effect, slabs that have voids within them are known as voided slabs. The voids, which are typically cylindrical, are made by embedding hollow, thin-walled steel parts into the slab. The slab’s voids contribute to the reduction of the structure’s self-weight. Voided slabs’ primary purpose is to reduce the volume of the concrete and, as a result, the slab’s self-weight.

If properly designed, it can lower the self-weight of the slab by up to 35% for the same section and span when compared to a solid slab. If the void diameters are less than 60% of the slab depth, voided slabs can be modelled and designed using the same methodology as solid slabs.

Construction Methodology of Voided Slabs

The two main techniques for constructing voided slab systems are the filigree method, in which some components are precast at a workshop or concrete yard, and the on-site method, in which the entire system is cast in situ. Both techniques require the use of void formers, reinforcements/strands, and concrete.

Void forming is an essential part of voided slab construction. Plastic voids can be used in both techniques of voided slab construction. These voids are usually formed from recycled plastic, which is spherical and hollow. The presence of voids makes the slab lighter than conventional solid concrete slabs.

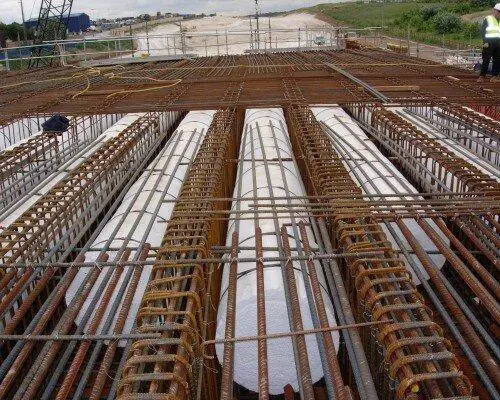
However, the commonest form is circular polystyrene void formers. Although polystyrene appears to be impermeable, it is only the much more expensive closed cell form which is so. The voids should therefore be provided with drainage holes at their lower ends. It is also important to ensure that the voids and reinforcement are held firmly in position in the formwork during construction. This avoids problems that have occurred with the voids floating or with the links moving to touch the void formers, giving no cover.

poystyrene void formers
Figure 2: Use of polysyrene as void formers during bridge deck construction

The steel reinforcement or tendons (for post-tensioned construction) is an additional important component. The slab is reinforced with steel to prevent flexural failure, and the voids are held in place in the middle of the slab by a cage of thin steel. The concrete that encloses the voids is the third element. The strength of the slab is ultimately determined by the concrete.

Advantages of Voided Slab

  • Reduction in dead weight up to 35% allows cost reduction in substructure i.e. footing and Piers. The structural engineer can lighten the floor by more efficiently using the concrete.
  • Reduced concrete usage- The use of 1 kg recycled plastic void former can replace 100 kg of concrete thereby, leading to environmentally green and sustainable construction with reduced energy and carbon emissions.
  • It allows longer spans between columns without increasing the thickness of the slab by large. Voided slabs can take advantage of post-tensioned reinforcement benefits to provide a thin slab with a greater span.
  • The elimination of downstand beams allows the quicker and cheaper erection of shuttering and services. Flat-plate construction eliminates beams and drops, resulting in reduced floor-to-floor heights.
  • Some voided-slab systems can reduce construction time, especially precast systems or those placed on flat-plate forming systems.
  • Voided slabs are beneficial in seismic design since the reduced dead weight of floors results in lower seismic forces applied to structures.
  • This reduced weight of building floors also permits engineers to reduce columns, walls, and foundations by as much as 40%, although concrete can’t be removed from all locations in a floor slab; voids are omitted near columns to maintain slab punching-shear capacity.

Design of Voided Slab Bridge Decks

The bridge can be analysed similarly to a solid slab as long as the void diameters are less than or equal to 60% of the slab thickness and nominal transverse steel is given in the flanges. In other words, the slab can be designed without taking into account either the decreased transverse shear stiffness or the local flange bending. EN 1992-2, in contrast to the earlier British regulation, does not provide particular guidelines on voided slabs. The British Standards Institution’s accompanying “PD” does, however, contain some information.

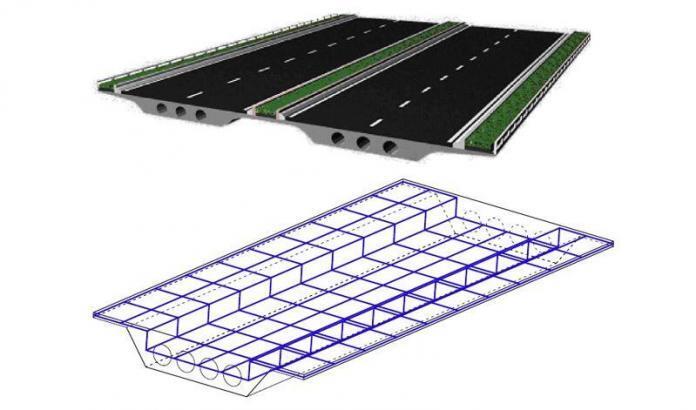
Voided slab bridge deck
Figure 3: Typical 3D rendering of a voided slab bridge deck (Díaz et al., 2010)

The voided slab section is designed longitudinally in both flexure and shear, making appropriate allowance for the voids. Links must be provided, and they are designed as done for flanged beams, bearing the beam’s thinnest web thickness in mind. Particularly if isolated piers are utilised, the shear loads are likely to increase excessively close to the supports. To solve the issue, the void can be easily closed off, leaving a solid part in these critical regions.

Larger diameter voids or square voids forming a cellular deck can be employed if more weight reduction is needed. The analysis must therefore take these into account. The section is treated as a monolithic beam for the purposes of calculating the longitudinal stiffness to be employed for a cellular deck. Under uniform and non-uniform bending, such a structure responds  differently in the transverse direction. The top and bottom flanges rotate about their individual neutral axes in the latter case while acting compositely in the former.

This indicates that with uniform bending as opposed to non-uniform bending, the accurate flexural inertia can be an order of magnitude higher. However, the behaviour can be modelled using a shear deformable grillage in a standard grillage model. Utilizing the composite flexural characteristics, an equivalent shear stiffness is calculated to represent the additional distortion caused by non-uniform bending.

bending stress in the x direction
Figure 4: Typical Bending stress in x-direction of voided slab bridge deck (Díaz et al., 2010)
bending stress in the y direction
Figure 5: Typical Bending stress in y-direction of voided slab bridge deck (Díaz et al., 2010)

The reinforcement should be designed once the moments and forces in the cellular structure have been determined. Local moments in the flanges must be taken into account in addition to the longitudinal and transverse moments in the entire section. This results both from the transverse shear and the wheel loads placed on the deck slab. This shear has to be transmitted across the voids by flexure in the flanges, that is by the section acting like a vierendeel frame.

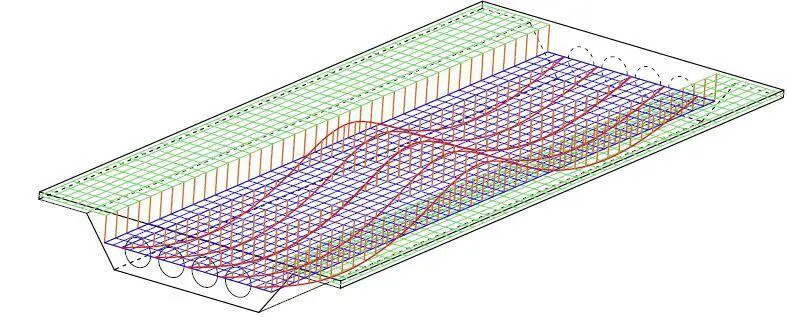
To improve the structural response and to avoid undesired tensile forces in the concrete, post-tensioned steel tendons are embedded into the concrete at the final stages of construction. The common layout of the tendons is parabolic, with negative eccentricities in the mid-span and positive in the pier zones.

post tensioned voided slab bridge
Figure 6: Three-dimensional finite element model of a voided slab deck with shell and beam elements (Díaz et al., 2010)

Grillage Analysis for Voided Slab Decks

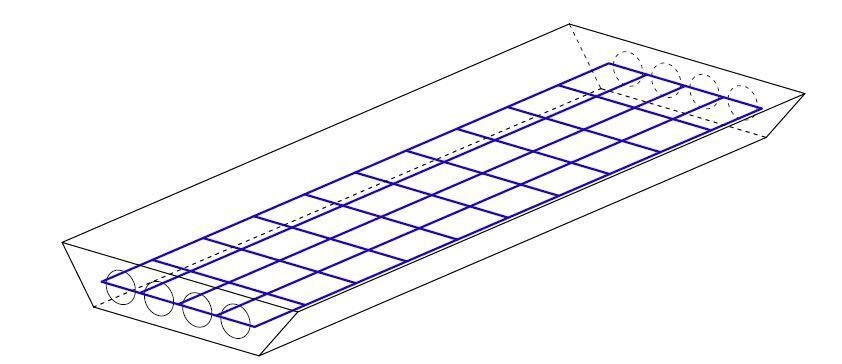
Despite the obvious benefits of voided slab decks, the analysis of the structural model is made more difficult by the voided slab form. While a voided slab has a varying amount of material depending on the direction, a solid slab with a consistent thickness has the same bending stiffness in all directions. As a result of this, defining grillages in the longitudinal and transversal deck directions is a highly popular option, where the grillage’s longitudinal beams are situated in the areas between voids, as shown in Figure 7.

grillage model for voided slab bridge
Figure 7: Grillage model of a voided slab deck (Díaz et al., 2010)

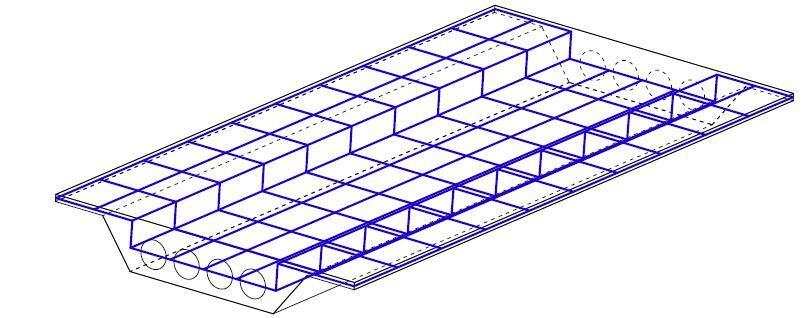
However, the stiffness attributed to each element in the grillage must be adjusted since in this discretization one-dimensional structural elements are used to describe the performance of a two-dimensional plate. The planar grillage analogy is said to be inaccurate when cantilevers are present, therefore a three-dimensional grillage is necessary, like the one in Figure 8, where the layer discretizing the voided slab and the layer modelling the cantilevers are joined together using stiff components.

3D GRILLAGE ANALYSIS
Figure 8: Three-dimensional grillage model of a voided slab deck with two layers joined by rigid beams (Díaz et al., 2010)

The grillage model, however, is an approximation of the deck’s actual behaviour and does not adequately capture the coupling of the slab in torsion or the local effects. Therefore, it is beneficial to create structural models, such as the orthotropic plate technique, that more accurately depict the deck’s resistance scheme.

Reference(s)

Díaz J., Hernández S., Fontán A., Romera L. (2010): A computer code for finite element analysis and design of post-tensioned voided slab bridge decks with orthotropic behaviour. Advances in Engineering Software 41 (2010) 987–999 doi:10.1016/j.advengsoft.2010.04.005

How Engineers should Engage with Host Communities

One of the main goals of civil engineering is to enable resilient and sustainable communities, as such every civil engineer should be involved actively in the communities where they operate. Therefore, how engineers should interact with the communities they work is of utmost importance. According to the Institution of Civil Engineers (ICE) Code of Conduct”, All members must fully consider the public interest, particularly when it comes to issues of health and safety and the welfare of future generations”.

Engineers are being requested more frequently to take on “wicked problems,” which are issues without a single, obvious technical solution. Wicked problems are understood to be complex, ill-structured problems that are located in a real-world context and concern technical as well as societal issues. Such problems are characterised by powerful conflicts of interest and differences in norms and values between stakeholders.

Developing a new understanding of engineering’s role in the delivery of infrastructure is necessary for community engagement. This involves taking into account how engineers collaborate with experts in community engagement and recognized community leaders. According to the World Bank, the public expects their opinion to count when it comes to infrastructure or energy projects in their community.

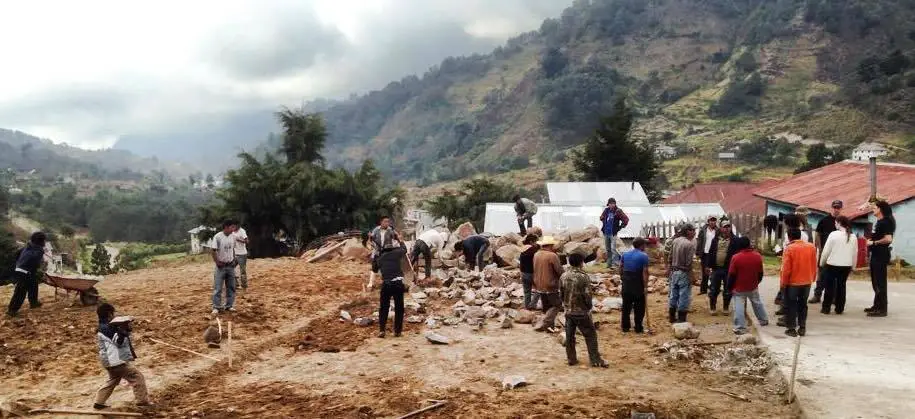
community engagement

Stakeholders are important for the success of public projects; everything from large-scale resource projects and transportation infrastructure, to the creation of regional community facilities. Due to alleged shortcomings in participatory design and the standard of public consultation, recent high-profile projects in the fields of gas, energy, electricity, water, wind, waste, and transport have all attracted public controversy, outrage, and media attention. Some organisations have even hired security firms to facilitate community engagement in some areas due to a serious breakdown of relationships.

At every point in the lifetime of an infrastructure, from design to decommissioning, engineers are responsible for effectively interacting with local populations. The obligation extends across all organizational levels and stages of a person’s career, from an apprentice and graduate to a senior leader and policy maker.

Read Also
The Everyday Engineer

Community Involvement

Engaging the community during the initiation, planning, and execution of a project can help with increase and share gains. Furthermore, project delivery and results can be improved by minimizing and mitigating the potential adverse effects of the project on the host community. A community’s economic, environmental, and social outcomes may suffer significantly over time if communities are not involved in project development. It is now generally understood to be very important for each project to engage local people and other stakeholders in dialogue and develop trusting relationships.

community interaction in construction projects

Professor Sarah Bell, who serves as the Chair ICE Community Engagement Community of Practice, asserts that the Institution of Civil Engineering (ICE) has created a set of principles to support excellent practice in community interaction. According to her, “ICE Principles for Community Engagement with Engineering Community engagement takes many forms, depending on the site, project and community.”

The set of guidelines developed by ICE for community engagements are as follows;

  1. Supporting sustainable, thriving communities is a core purpose of the engineering profession.
  2. Community impacts and interests are integral to engineering design and delivery.
  3. Community engagement should begin at the conception of projects and continue throughout the engineering and infrastructure lifecycle.
  4. A tailored engagement approach with clear objectives, processes and expectations should be agreed among all stakeholders at the outset of infrastructure decision-making and planning.
  5. Engineering and infrastructure projects should identify the diverse needs of communities they work with, giving special attention to include groups that are typically marginalised.
  6. Community engagement should consider how individuals and groups of different race, age, faith, disability, gender, sexuality, family circumstances, economic status, and other characteristics may be differently impacted by infrastructure development and may welcome different forms of engagement.
  7. Methods of engagement should recognise power inequalities and enable two-way communication and learning between communities and engineering projects.
  8. Information about engineering projects and their impacts should be shared with community members as part of a two-way process, with information being accessible to all people.
engineers without borders

According to Sarah, “The ICE Principles for Community Engagement with Engineering were created based on existing literature and then refined with input from stakeholders and civil engineers.”
The principles are designed to be flexible enough to fit a variety of situations, locations, industries, and project sizes. They can assist engineers at various career junctures and power levels. They serve as a starting point for the creation of best practice case studies and instructions. Then, through engineering education and professional development, these can be shared. The guiding principles define the goal, significance, and character of effective community engagement.

They also issued a challenge to the industry, asking it to consider how to collaborate with communities as essential partners in the delivery of resilient and sustainable infrastructure. The guiding principles shed light on how the fundamental knowledge and expertise of civil engineers and other professionals working in the built environment must change in order to face this challenge.

List of Soil Tests for Foundation Design

By performing laboratory tests on soil samples collected from trial pits or boreholes, it is possible to measure the physical and mechanical properties of natural soils for foundation design. For example, calculating the ultimate bearing capacity of soils or the stability of slopes in foundation excavations and embankments can be done using the results of shear strength tests.

Furthermore, laboratory soil tests provide information from which soils can be categorised and predict how they would behave under foundation loads. The results of the soil tests can be used to develop ways for treating soils that will help excavations proceed more smoothly, particularly when dealing with groundwater issues.

It is important to keep in mind that natural soil deposits vary in composition and degree of consolidation, necessitating the need for considerable judgment based on common sense and experience when evaluating soil test results and determining when they should be disregarded. Laboratory tests shouldn’t be relied upon blindly, especially if there aren’t many samples of soils tested.

test
Triaxial soil test

Any bearing capacity estimates or other engineering design data should be confirmed, to the extent practicable, with known conditions and prior experience. The test results should be evaluated in conjunction with the borehole loggings and other site observations. The simplicity of laboratory tests should be maximised.

Expensive equipment tests are time-consuming, costly, and prone to serious error unless meticulously and diligently performed by highly skilled technicians. If the samples are few or if the cost is large relative to the project cost, such procedures could not be very justifiable.

Only if the enhanced accuracy of the data will result in substantial design savings or will eliminate the possibility of an expensive failure, as in the case of geotechnical category 3 investigations (very heavy and complex structures), are complex and expensive tests justified. An important argument in favour of conducting a suitable number of soil tests is the accumulation of relevant data over time linking test findings to foundation behaviour, such as stability and settlement, which gives engineers more confidence in the use of laboratory soil tests.

The soil test results are a useful corrective to engineers’ “wishful thinking” in their initial assessment of the strength of soil as it appears in the borehole or trial pit, at the very least giving a check on field descriptions of boreholes based on visual observation and handling of soil samples.

List of Soil Tests for Foundation Design

The soil mechanics tests made in accordance with BS 1377 which concern the foundation engineer are as follows;

(a) Visual examination
(b) Natural moisture content
(c) Liquid and plastic limits
(d) Particle-size distribution
(e) Unconfined compression
(f) Triaxial compression
(g) Shear box
(h) Vane
(i) Consolidation
(j) Swelling and suction
(k) Permeability
(l) Chemical analyses

Soil Classification Tests (Index Properties Test)

Tests (a) through (d) are necessary for soil characterisation (soil classification tests). Laboratory visual tests are used to note the colour, texture, and consistency of the site-received samples for disturbed and undisturbed samples. This should be done as a normal review of the descriptions provided by the field engineer or boring foreman.

Natural Moisture Content Test

In order to plan the schedule for shear strength tests and to make sure that testing on the softer soils (as suggested by the greater moisture content) is not skipped, natural moisture content test results are compared and related to the liquid and plastic limits of the relevant soil types.

Atterberg Limit Tests

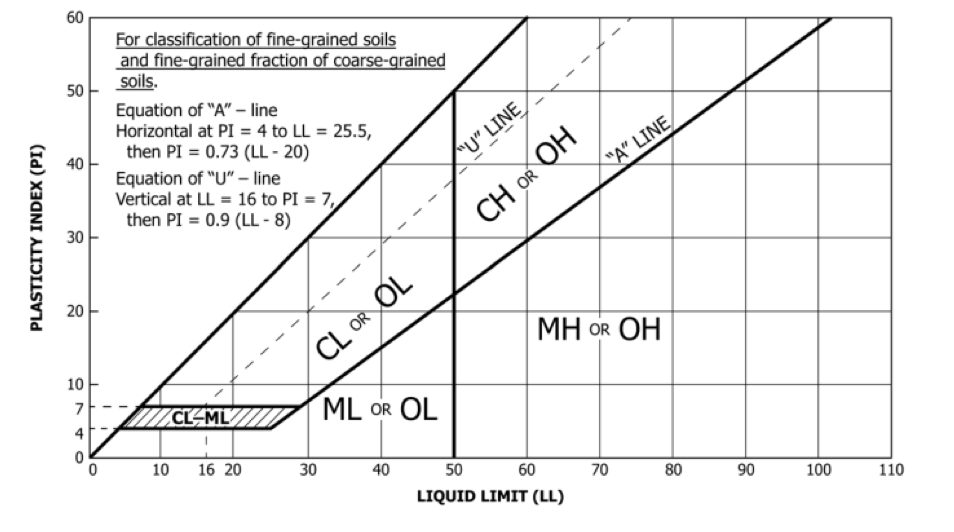
Cohesive soils are subjected to liquid and plastic limit tests to classify them and predict their engineering characteristics. The compressibility of clays and silts can be predicted using the plasticity chart. It is important to know if the soil is of organic or inorganic origin to apply this chart.

PLASTICITY CHART
Plasticity Chart

The standard practice is to conduct liquid and plastic limit tests on a small number of carefully chosen samples of each primary soil type discovered in the boreholes. The different soil types can be grouped in general order of compressibility by comparing the results and showing the data on the plasticity chart, and samples can then be chosen accordingly for consolidation tests if they are necessary.

Particle Size Distribution Test

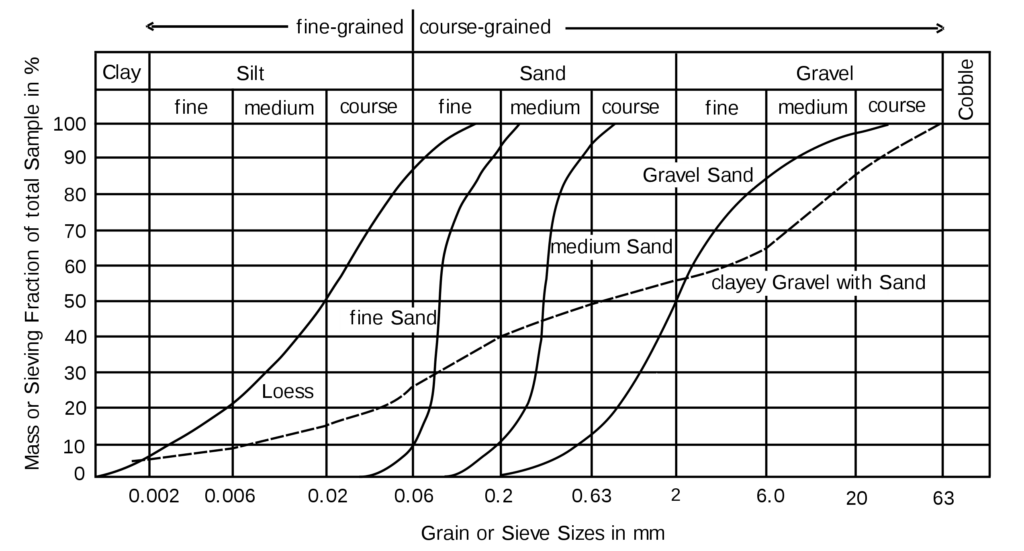
The particle-size distribution test is a type of classification test, where the soil particles are graded according to their sizes. The grading curves can be displayed on the graph using sieve analysis, sedimentation or hydrometer analysis, or a combination of both.

set of bs sieves for particle size distribution test
Set of BS Sieves for Particle Size Distribution Test

The grading curves are of no direct value in assessing allowable bearing pressure, and generally, this type of test need not be made in connection with any foundation investigation in clays or in the case of sands and gravels where the excavation is above the water table.

particle size distribution curve 1
Particle size distribution curves

However, the particle size distribution test is particularly useful when examining excavation-related issues in permeable soils below the water table because the results can be used to determine which of several geotechnical processes is practical for lowering groundwater levels or treating grouting problems.

Shear Strength Test

The ultimate bearing capacity of a foundation and the earth pressure on sheeted excavations (braced cuts or sheet pile walls) can both be calculated simply from the shear strength of the soil.

Unconfined Compression Strength (UCS) Test

The simplest type of shear strength test is the unconfined compression strength (UCS) test. Cohesionless soils, clays, and silts, which are too soft to stand in the machine without collapsing before the load is applied, cannot be subjected to UCS tests. The values are lower than the actual in-situ strength of fissured or brittle soils in this scenario.

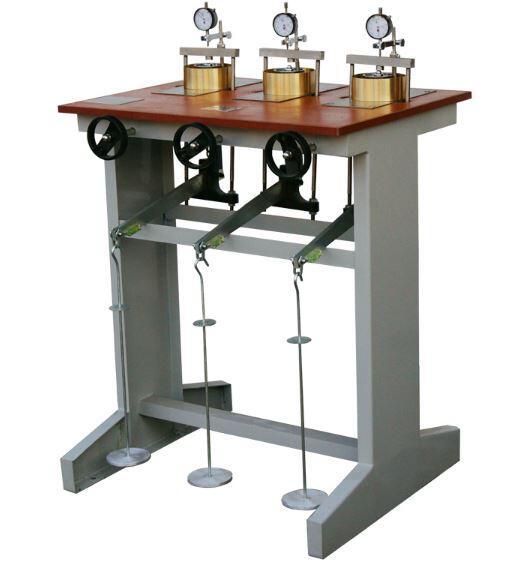
Triaxial Test

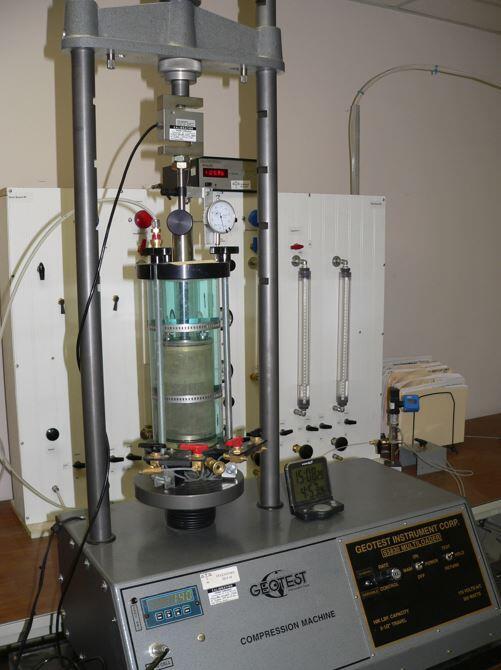
In comparison to the unconfined compression test, the triaxial compression test is a more adaptable way to measure shear strength since it can be used for a greater variety of soil types. The test circumstances and observations can also be adjusted to address a variety of engineering problems.

triaxial testing in the lab
Triaxial Test

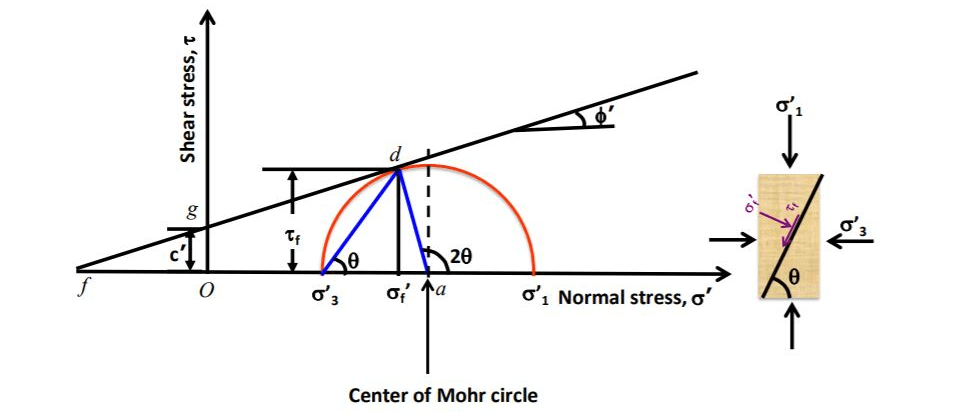
The Mohr-Coulomb equation is used to calculate the cohesiveness (c) and the angle of shearing resistance (ϕ) of soil under three different situations;

Undrained shear (total stresses)
su = Cu

Drained shear strength of sands and normally consolidated clays (effective stresses)
s = σn‘ tan ϕ’

Drained shear strength of over-consolidated clays
s = Cu + σn‘ tan ϕ’

Drained residual (large strain) of clays
Sr = Cr‘ + σr‘ϕr

The three main types of triaxial test are;
(1) Unconsolidated Undrained (UU)
(2) Consolidated Undrained (CU)
(3) Consolidated Drained (CD)

Unconsolidated Undrained (UU) Test

In the unconsolidated undrained test, the specimen is not permitted to drain while the all-around pressure is applied or while the deviator stress is applied, hence the pore pressure is not permitted to dissipate at any point during the test. This test approach reproduces the conditions that arise when the soil beneath the full-scale foundation is loaded or when the earth is removed from an open or sheeted excavation in the case of saturated fine-grained soil. Under these circumstances, the pore pressures in the soil behind the face of an excavation or beneath the laden foundation cannot dissipate during the application of load.

Consolidated Undrained (CU) Test

Total stresses are used in the assessments to determine the ultimate bearing capacity of the foundation soil or the initial stability of excavations. The specimen is allowed to fully consolidate during this stage of the test since the consolidated-undrained test protocol calls for letting the specimen drain while applying all-around pressure. During the application of the deviator stress, drainage is not permitted.

Consolidated Drained (CD) Test

When conducting a drained test, pore water from the specimen may be drained both during the stage of consolidation under all-around pressure and while the deviator stress is being applied. The time allotted for deviator stress application and consolidation under all-around pressure must be slow enough to prevent pore pressure buildup at any point during the test.

consolidated drained test
Mohr Circle for Consolidated Drained Test

The procedure for consolidated-undrained and drained tests corresponds to the conditions when the soil below the foundation level is sufficiently permeable to allow dissipation of excess pore-water pressure during the period of application of foundation loading, or when pore-water pressure changes can occur due to external influences at any time during the life of a structure.

Consolidated-undrained or drained tests are also used to look at the long-term stability of excavated slopes. These issues with long-term stability are examined in terms of effective stress. Standard soil mechanics textbooks are recommended for the reader to consult for explanations of test protocols and data interpretation. For category 3 investigations and to get small strain values of Young’s modulus for use in finite element analysis, the development of triaxial testing techniques, such as the insertion of probes or other devices into the test specimen, can be justified.

Vane Shear Test

Triaxial tests are often only used on weak rocks, peats, clays, and silts. The easiest way to empirically evaluate the angle of shearing resistance of sands and gravels is through in-situ tests. The vane shear test is more appropriate for use in the field than in a lab. However, the laboratory vane test has a useful application when very soft clays and silts have been successfully sampled undisturbed using standard techniques but it is impossible to prepare specimens from the tubes for shear strength tests using the unconfined or triaxial apparatus due to their softness.

Shear Box Test

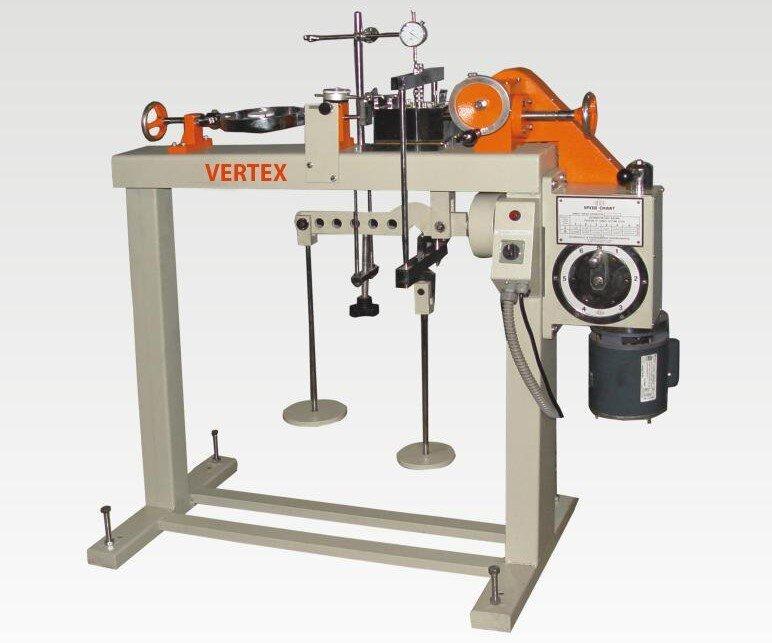
The shear box test can be used to determine the shearing resistance of soils, but it is not used in preference to the triaxial test because of difficulties in controlling drainage conditions, and the fact that the failure plane is predetermined by the apparatus. However, in relation to studies of shaft friction in piles, the shear box has practical uses for evaluating the interface shear between soils and materials like concrete and steel.

direct shear box test apparatus
Direct shear box test apparatus

Additionally, the reversing shear box soil test offers a practical method for determining the residual or long-term shear strength needed to determine the stability of earth slopes when failure may occur on an old slip surface. The big strain parameters c and ϕ are also obtained using the ring shear test.

Consolidation Tests

Consolidation test results are used to estimate the amount and rate of soil consolidation (time-dependent settlement and compression of soils) beneath foundations. Because the material is contained within a metal ring and only one direction of stress is applied, the test is more appropriately referred to as a one-dimensional consolidation test. The instrument used is called an oedometer, also known as a consolidometer. The rate of settling of the full-scale structure can be calculated using the coefficient of consolidation (cv) that is derived from the test data.

consolidometer
Consolidometer

The coefficient of volume compressibility (mv) is determined from the pressure—voids ratio curve that is drawn using the load—settlement data received from the complete cycle of loading and unloading. This is used to determine the amount of consolidation settlement that will occur under a specific loading.

Since the theories on which settlement estimates are based are restricted to these sorts of fine-grained soils, consolidation tests are only applicable to clays and silts. The coefficient of consolidation as determined by oedometer tests on typical 75 mm specimens may be significantly off when used to calculate the rate of settlement. This is due to the possibility that a 75 mm specimen may not accurately depict the soil’s “fabric,” such as the presence of fissures, laminations, root holes, etc.

Consolidation tests should be performed on specimens with a diameter of 200 or 250 mm when soils display a type of fabric that will affect the permeability and, consequently, the rate of consolidation. As an alternative, it is possible to determine the rate of consolidation by observing how quickly large-scale buildings on comparable soil types settle. The settlement of buildings built on sands is typically assessed using data from field tests.

Swelling and Suction Tests

Swelling and suction tests are used to assess the effects of moisture content changes on desiccated clays and unsaturated soils.

Permeability Tests

Permeability tests can be made in the laboratory on undisturbed samples of clays and silts, or on sands or gravels which are compacted in cylindrical moulds to the same density as that in which they exist in their natural state (as determined from in-situ tests).

Permeability of soil
Permeability of soil experimental setup

However, it is questionable how useful the results of laboratory tests on a few samples from a vertical borehole will be in determining the representative permeability of the soil in order to determine how much water needs to be pumped from a foundation excavation or how quickly large foundations will settle. It is best to use tests like boreholes or field pumping tests to determine the permeability of the soil at a specific site.

Chemical Analysis

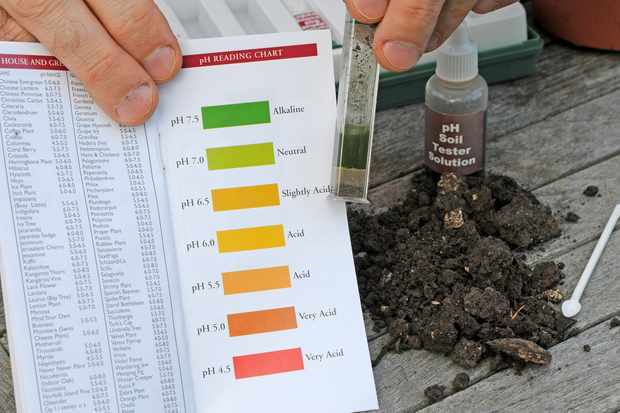
To determine whether the condition of buried steel and concrete foundation structures might deteriorate, chemical tests of soils and groundwater are necessary. Finding the pH value and chloride content of the soil and groundwater is typically sufficient for steel structures like permanent sheet piling or steel bearing piles.

The sulphate content and pH value are typically necessary for concrete buildings. Although the pH value, a measurement of how acidic or alkaline the soil or groundwater is, cannot be used to directly determine the type or amount of acidic or alkaline material present, it is a useful index in determining whether more information is needed to determine the precautions to be taken in protecting buried concrete structures.

soil pH
Soil pH Testing

For example, a low pH value indicates acid conditions, which might result from naturally occurring matter in the soil or which might be due to industrial wastes dumped on the site. In the latter case, detailed chemical analyses would be needed to determine the nature of the substances present, to assess the health risks to construction operatives and in the long term to the occupants of the site, and to assess their potential aggressiveness towards concrete.

Geological Disposal of Radioactive Wastes

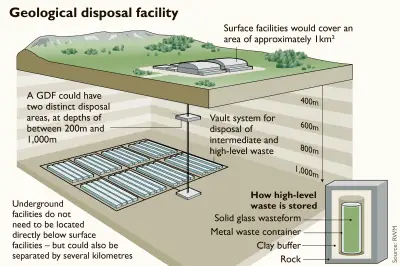
Geological disposal has been deemed the safest permanent solution for disposing of nuclear wastes. This method entails burying the waste several hundred metres beneath solid rocks at a Geological Disposal Facility (GDF). In numerous countries, including Canada, Finland, France, Sweden, and Switzerland, this strategy has already been adopted. Some of these nations such as Sweden and Finland have made significant progress in creating their own GDFs.

The use of geological disposal is made possible by cutting-edge engineering, science, and technology. This entails isolating the radioactive waste in tunnels and vaults that are 200 to 1000 metres below the surface and are completely sealed. The radiation is safely contained in the vaults as it degrades naturally over time, and it is never allowed to rise to the surface in dangerously high concentrations.

Geological disposal facility 4

Solid radioactive waste is packed in safe, engineered containers, usually made of metal or concrete, and buried hundreds of metres below the surface in a stable rock formation with the containers encased in clay or cement. The term is referred to as the “multi-barrier method”.

Recently, the All-Party Parliamentary Group on Infrastructure (APPGI) in the UK has received an industry update on GDF from Karen Wheeler, CBE, the Deputy CEO and Major Capital Programmes Director in the UK. Karen disclosed the information to the Institution of Civil Engineers (ICE) UK. The APPGI is Parliament’s leading cross-party group dedicated to economic infrastructure in the UK. According to Karen, she was thrilled to inform the APPGI about the crucial infrastructure program that her organization is in charge of this month.

Environmental Sanitization

On the environmental clean-up, she explained, “For more than 60 years, nuclear technology has been a part of our daily life. It has been used to power houses and companies, identify and cure severe ailments, and defend our nation. Nevertheless, this technique has produced radioactive waste that must be handled carefully over an extended period. Although current above-ground storage is secure, it is not a long-term solution.”

The UK government has tasked Nuclear Waste Services (NWS), a division of the Nuclear Decommissioning Authority (NDA), with finding a long-term solution for higher activity radioactive waste in order to safeguard the environment and future generations. The use of Geological Disposal has been universally accepted as the long-term and sustainable solution to nuclear waste containment.

Geological disposal requires no ongoing maintenance, and it is less vulnerable than surface storage to human activities such as terrorism or war. Furthermore, it is less vulnerable than surface storage to natural processes such as climate change. With this approach, the waste will finally be permanently sealed to assure safety without the need for additional action after being deposited into a GDF, far below earth and away from humans and the environment.

fig3 sweden nuclear waste repository skb
Proposed  final deep geological repository for 12,000 tonnes of spent nuclear fuel in Forsmark, in Sweden

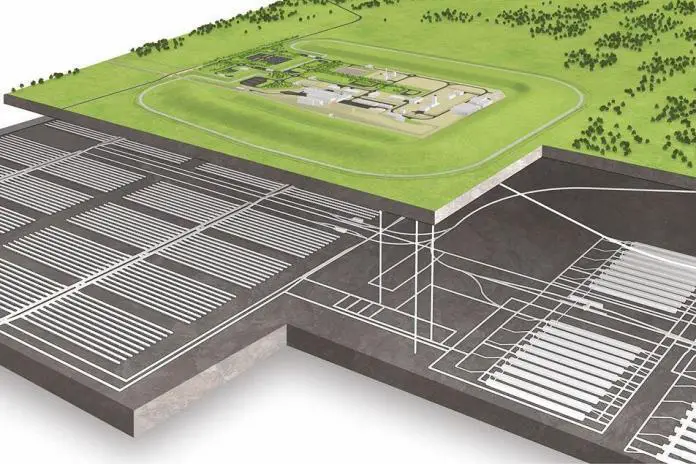
Sample Design of a Geological Disposal Facility

Kareen further discussed on locating a cooperative community and suitable location. She notes that it is necessary because the policy is consent-based and so it is important to select both a suitable site and a community that is open to it. Only having one or the other will not be sufficient.

In England or Wales, the ‘Working with Communities Policy’ outlines the procedure for interacting with potential host communities, including local decision-making to demonstrate willingness (or disinterest) to host a facility.

According to Karen, she and her team are working hard to address concerns about regional consequences, safety, security, transportation, and other challenges, both nationally and locally.

Furthermore, she added that involving locals in selecting what they want for their communities is most important. According to her, “This project is genuinely transformative. Large project of this nature, which will generate local investment, infrastructure, skills, and thousands of employment over the course of more than a century, can be advantageous to communities in the long run.”
Sample design of Geological Disposal facility.
Sample design of GDF ( Credit : Institution of Civil Engineers )

Geological Disposal Facilities: Facts and Figures

  • A GDF will be erected 200 to 1,000 meters below ground.
  • For surface amenities, it will be about 1 km2 large, or 800 Olympic-sized swimming pools.
  • Over 20 km2 will be devoted to subsurface dumping zones.
  • The GDF might build a network of disposal locations and tunnels 300–400 kilometers underground.
  • Additionally, it could have accessways and drifts that extend for miles.
  • The GDF will run for more than a century and generate a large number of employment.

Independent  Regulation

As a conclusion, Karen said “We collaborate closely with independent regulators. The suggested site, the designs for a GDF, and the underlying science will be examined by the Office for Nuclear Regulation and the Environment Agency to ensure safety.  Then the GDF can be constructed.”

Sandcrete Blocks: Production, Specifications, Uses, and Testing

Sandcrete blocks are precast composite masonry units made of cement, sand, and water and are moulded into various sizes. According to the British Standard (BS 6073: 1981 Part 1), a block is a heterogeneous building material with a unit that is larger in all dimensions than what is required for bricks, but no dimension should be larger than 650 mm or the height should be six times the thickness or greater than the length. When set in their normal aspect, sandcrete blocks are walling units whose dimensions exceed those of bricks (NIS 87: 2007).

However, it should be noted that in BS EN 771-3:2011 + A1:2005 (which replaced BS 6073:1981), the distinction between blocks and bricks has been removed, and replaced by ‘masonry units’. A masonry unit is defined as a preformed component intended for use in masonry construction. Furthermore, no standard dimensions have been provided. A manufacturer is expected to declare the dimensions of the masonry units in mm in terms of Length, Width, and Height. Therefore, the new standard serves as a performance standard, and not a recipe standard.

It has been reported by some researchers that sandcrete blocks are the major masonry units used in Nigeria’s construction industry, accounting for more than 90% of the country’s physical infrastructure. As a result, sandcrete blocks are important components in building construction. They are commonly utilised as load-bearing and non-load-bearing walling units in Nigeria, Ghana, and other African nations.

moulding of sandcrete blocks
Sandcrete blocks is used extensively in building construction

Sandcrete blocks are reasonably priced when compared to other building materials. They offer great damage resistance without the additional cost of protective equipment. Unlike other building materials, sandcrete bricks don’t rust, rot, or serve as a haven for pests that cause harm. Furthermore, they don’t contain any environmentally hazardous substances. According to the Nigeria Industrial Standard (NIS 87: 2007), sandcrete blocks must have a minimum compressive strength of 2.5 and 3.45 N/mm2 for non-load bearing and load bearing walls, respectively.

Specifications for Sandcrete Blocks

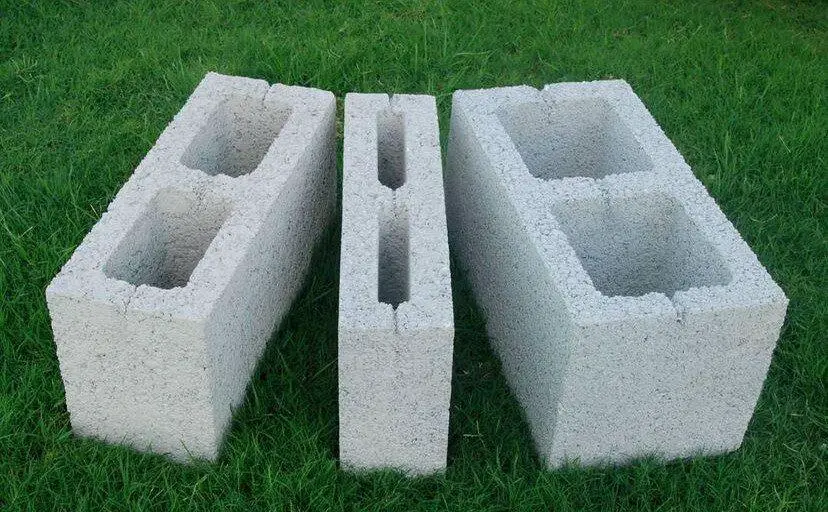
The most popular sizes for sandcrete blocks are 450mm x 225mm x 225mm and 450mm x 150mm x 225mm. Sandcrete blocks can also be rectangular and solid or hollow. The Nigerian Industrial Standards (NIS 87: 2007) defined two types of blocks:

  • Type A load bearing blocks, and
  • Type B non-load bearing blocks

They both have the option of being solid or hollow.

The approved sizes for sandcrete blocks specified by the NIS are presented in Table 1;

TypeWork size (mm)
Length x Height x Thickness
Web ThicknessUsage
Solid Block450 x 225 x 100For non-load bearing and partition walls
Hollow450 x 225 x 11325For non-load bearing and partition walls
Hollow450 x 225 x 15037.5For load bearing walls
Hollow450 x 225 x 22550For load bearing walls
Table 1: The approved sizes for sandcrete blocks

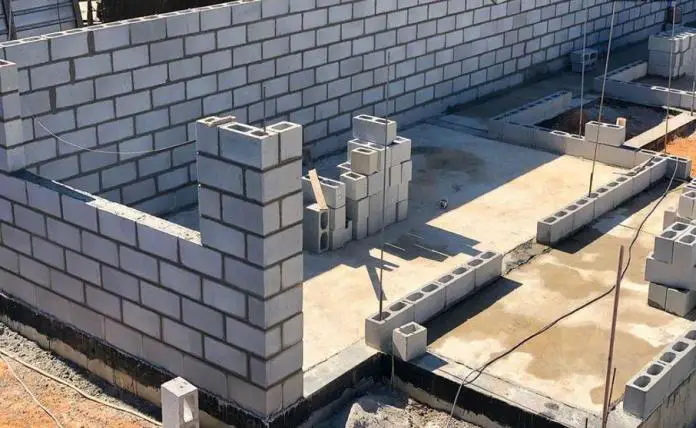
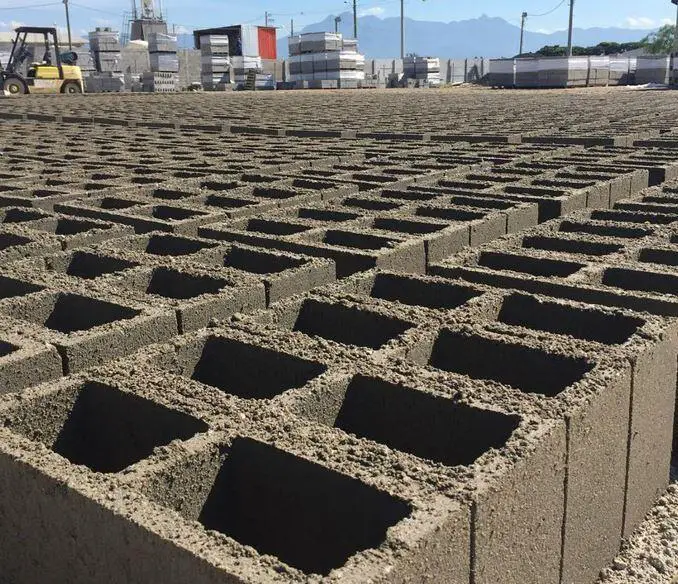
Masonry units that have a core void area larger than 25% of the gross area are considered hollow blocks. Lightweight aggregate is used to make hollow sandcrete blocks, which can be utilised to build both load-bearing and non-load-bearing walls. Blocks with two cells are typically produced in Nigerian construction factories. Sandcrete hollow blocks have a void running through them from top to bottom that takes up around one-third of their volume, yet solid blocks are completely devoid of voids.

Different sizes of sandcrete blocks

When hardened, sandcrete blocks often have significant compressive strengths, and these strengths typically increase with density. Sandcrete hollow blocks should have a minimum strength requirement of 2.5 N/mm2 for 150 mm and 3.45 N/mm2 for 225 mm, according to NIS 87:2007.

Mix Ratios for Sandcrete Blocks

Sandcrete blocks are frequently produced using cement-sand mixtures with a cement-to-sand ratio of 1:6, 1:7, 1:8, or 1:9 and coarse aggregates no larger than 10 mm (when required for concrete blocks). When properly cured, these combinations produce sandcrete blocks with a compressive strength that is significantly high enough to meet construction standards.

The typical compressive strength obtained for different mix ratios and water-cement ratio for 450 x 150 x 225 (6 inches block) are shown in Table 2;

W/C1:10
(fc at 28 days N/mm2)
1:8
(fc at 28 days N/mm2)
1:6
(fc at 28 days N/mm2)
1:4
(fc at 28 days N/mm2)
0.32.404.085.406.10
0.43.004.395.586.23
0.53.804.476.857.60
0.63.604.246.417.00
0.73.204.215.816.54
Table 2 :Compressive Strength of sandcrete block at 28 days

Therefore, the optimum water-cement ratio for maximum compressive strength in sandcrete blocks is 0.5. The mix ratio recommended by the NIS for sandcrete blocks in Nigeria is 1:8. For a 225mm hollow sandcrete block produced with a mix ratio of 1:8, the 28 days compressive strength is expected to be a minimum of 3.5 N/mm2 under laboratory controlled conditions. For 150 mm hollow block, a minimum compressive strength of 2.77 N/mm2 should be expected after 28 days of curing.

The following recommendations can be adopted in the production of 225 mm (9 inches) sandcrete blocks;

CementSandMix-RatioExpected Number of Blocks per bag (9 inches hollow)Expected Minimum Compressive Strength (N/mm2) at 28 days using Manual Compaction
One bag3 wheelbarrows (12 head pans)1:6155.6
One bag3½ wheelbarrows (14 head pans)1:7174.2
One bag4 wheelbarrows (16 head pans)1:8203.5
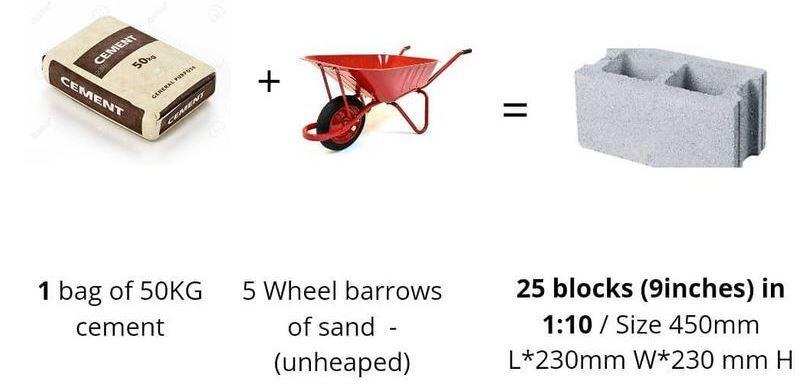
One bag5 wheelbarrows (20 head pans)1:9253.3
Quantity estimation for blocks

Materials Used in the Production of Sandcrete Blocks

The following materials are used in the production of sandcrete blocks:

Cement

Cement is a binder material that is used to hold the constituent (sand, gravels, etc) aggregates together to form a composite matrix. It is a carefully controlled combination of lime, silica, alumina and iron oxide. However, compounds of lime are the main ingredients of cement.

Cement brands in Nigeria
Different brands of Limestone Portland Cement available in Nigeria

Hydration reaction takes place whenever water is added to cement, which results in a significant heat release. When concrete hydrates, a gel is created that holds the aggregate particles together and gives concrete its strength and water tightness when it hardens. Ordinary Portland Cement (OPC) or Limestone Portland Cement are the most popular form of cement used in construction projects. When making sandcrete blocks, Portland cement must adhere to all the specifications given in EN 197-1:2011 and NIS 444-1:2003, respectively.

Fine Aggregates

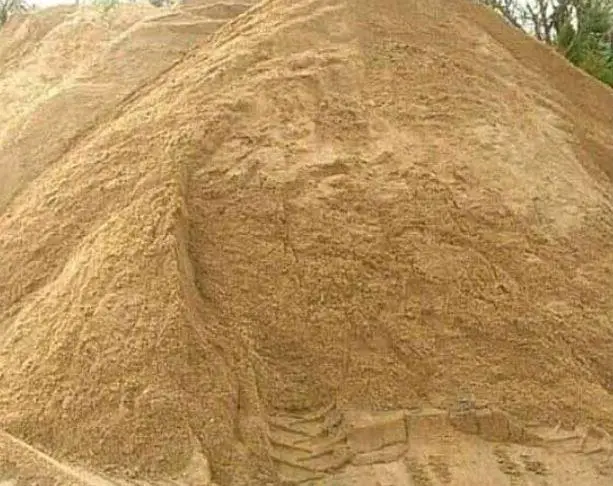
Fine aggregates are granular materials obtained by processing natural materials which pass through a sieve with a mesh size of 9.35 mm, almost totally pass through a sieve with a mesh size of 4.75 mm, and are mostly retained on a sieve with a mesh size of 200 (75 μm). For the production of sandcrete blocks, four different types of sand may be employed. They are river sand, sea sand, crushed stone sand, and pit sand. River sand is the most common in Nigeria.

In terms of volume, sand makes up around 75% of the mixture. It serves as a filler and is a reliable predictor of the sandcrete block’s anticipated compressive strength. The fundamental water to cement ratio is exceeded when using much finer sand because more cement and water are needed to coat the particles. The result is the production of weaker, more porous blocks. Too small natural dust grains can replace cement paste, cover grain surfaces, and form thin films, which hinder cement paste from lubricating the aggregates.

sharp sand for sandcrete blocks

Tests for Fine Aggregates

Sieve Analysis

Sieve analysis is a laboratory test that measures the particle size distribution of a soil by passing it through a series of sieves. Soil retained on it is termed as gravel fraction. A set of British standard (BS) sieves of sizes – 1.0mm, 0.85mm, 0.60mm, 0.50mm, 0.30, 0.25, 0.180 and pan and a weighing balance were used for the analysis. The sieves were arranged by keeping the largest aperture sieve at the top and smallest aperture at the bottom.

The grading of soil is best determined by direct observation of its particle size distribution curve. The equation below is usually adopted in calculating the Uniformity coefficient Cu.

Cu = D60/D10

Where Cu is the Uniformity coefficient, D60 is the particle diameter corresponding to 60% finer on the cumulative particle-size distribution curve and D10 is the particle diameter corresponding to 10% finer on the cumulative particle-size distribution curve. If Cu < 4.0 the soil is poorly graded; if > 4.0 the soil is well graded. Well graded sands should be used for the production of sandcrete blocks.

Specific Gravity

The weight of a particular volume of fine aggregate (sand) to the weight of an equivalent volume of water is known as its specific gravity. Sands have a specific gravity of about 2.65. Specific gravity is considered to be a measure of strength or quality of a material.

To carry out a specific gravity test, the following procedure can be adopted:
An empty density bottle will be cleaned, dried, weighed and designated (W1). The bottle will be filled with one-third of the total volume of the sand sample, weighed and designated (W2). The bottle is then filled with distilled water, weighed and designated (W3). Then the content of the bottle is discarded and rinsed thoroughly. The bottle is then filled with distilled water to the meniscus, weighed and designated (W4). The Specific gravity (G) is then calculated using the equation below;

G = (W2 – W1)/[(W4 – W1) – (W3 – W2)]

Water

Water reacts with cement to produce the hydration reaction. The amount of water utilised in the mixing process has a significant impact on the workability and strength of sandcrete. To make concrete or sandcrete, water must be devoid of suspended solids, inorganic salts, acids, and alkalis, as well as algae, oil contamination, and acids and alkalis. It is advised to use potable water that complies with NIS 554:2007 standard when making sandcrete blocks.

Mechanical Properties of Sandcrete Blocks

The mechanical properties that are frequently declared in sandcrete blocks are the bulk density, water absorption, and compressive strength.

Bulk Density

Density is the quantity of an element’s or material’s particles packed into a specific volume. The density of the substance increases with the degree of particle packing. Therefore, higher levels denote a similar level of compaction. Mathematically, this is the mass of the masonry unit divided by the dimensions volume:

Bulk Density = mass of block (kg)/dimensional volume of block (m3)

The density is masonry units is determined in accordance wit BS EN 772-13:2000. In Nigeria, a minimum density limit of 1920 kg/m3 is recommended for individual sandcrete blocks, and 2020 kg/m3 for an average of three or more blocks.

Water Absorption

This is the amount of water that a block unit will absorb when submerged for the specified amount of time in the water at room temperature. It is stated as a percentage of the dry unit of the block’s weight. The weight of water absorbed when the block unit is partially submerged in water for one minute is the absorption rate. Additionally, it is also defined as the amount of water that a brick absorbs in the first minute after coming into contact with water.

The procedure for obtaining the water absorption of masonry units is described in in EN 772-11:2011.

It is expressed mathematically as;
Water absorption = (mass of saturated block (kg) – mass of dry block (kg)) / volume of block (m3).

The water absorption rate is determined by measuring the decrease in mass of the saturated block and surface dry sample. To achieve this, block samples whose weights had been taken in the dry state and noted as (M1), were fully immersed in water. The time taken for full immersion was noted, and a period of twenty-four (24) hours was allowed to elapse. After 24 hours, the weight of the wet block samples was recorded as (M2). The difference between the dry and wet weights of each block was calculated by subtracting the dry weight from the wet weight. The percentage absorption was calculated using the Equation below.

Water absorption (%) = [(M2 – M1)/M1] × 100

The ASTM C140 recommended maximum water absorption capacity of 240 kg/m3. The maximum water absorption specified by the Nigerian Standard is 12%.

Compressive Strength

A compressive strength test is used to assess the quality of a block unit and its response to curing. It is described as the unit’s capacity to sustain an axial load that is applied to either the block’s bed face or its edge or the ratio of the crushing load that a sample can sustain to its net area. The declared compressive strength of the block by the manufacturer shall be the characteristic 5% fractile fc or the mean 50% fractile fm.

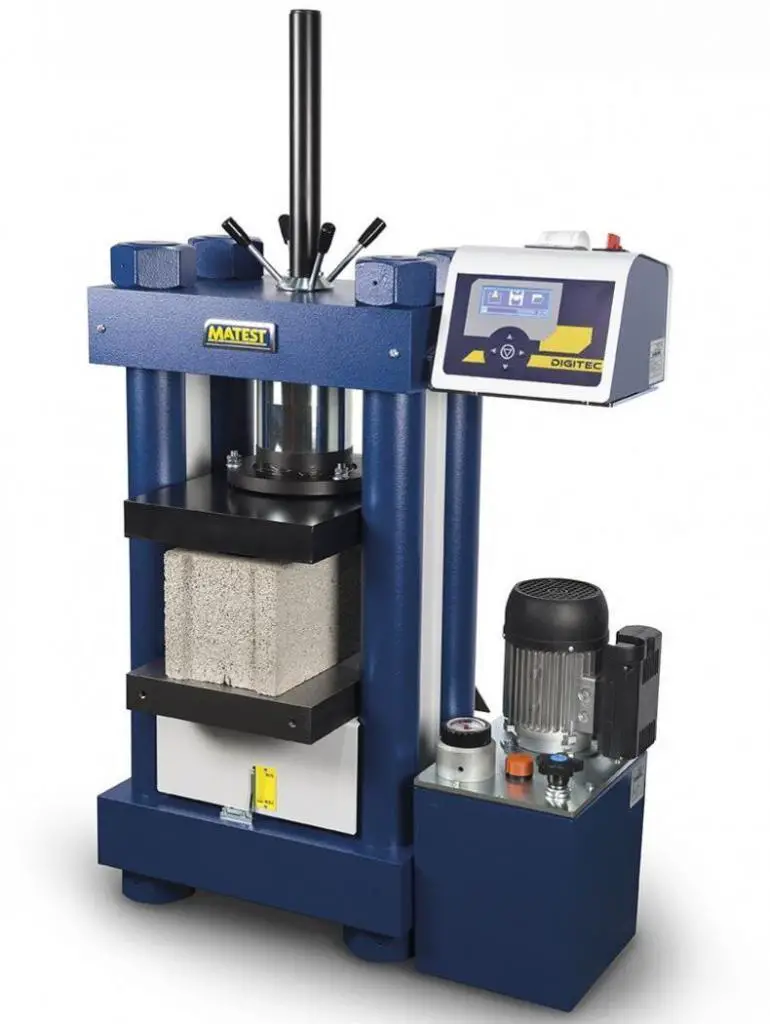
The compressive strength of sandcrete blocks should be evaluated in accordance with EN 772-1:2000. When the anticipated compressive strength is less than 10 N/mm2, the crushing machine should be loaded at a rate of 0.05 (N/mm2)/s.

sandcrete block crushing and testing 1
Sandcrete block compressive strength test

It is expressed mathematically as;

Compressive strength = maximum crushing load (N) / minimum surface area (mm2)

Sandcrete hollow blocks have a minimum strength requirement of 2.5 N/mm2 for 150 mm and 3.45 N/mm2 for 225 mm, according to NIS 87:2007. The factors affecting this property are water-cement ratio, degree of compaction, fine aggregate (grade, texture and shape characteristics), cement type, the efficiency of curing, amount of mixing water, and mix proportion.

Production of Sandcrete Blocks

The advent of various quickly assembled machines and other manually operated frameworks for the manufacture of masonry units is a significant factor contributing to this rise in the number of such production facilities. The top three methods of sandcrete blocks production are:

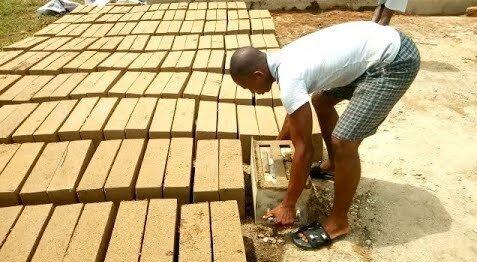
  1. Hand ramming compaction moulds.
  2. Manual tamping compaction frame.
  3. Motorised vibration machine.

All three methods employ both horizontal and vertical orientations in production. It is rare to see block manufacturing industries employing all three forms of production. Every block production industry typically uses only one orientation for the creation of block units for a specific type of compaction mechanism. During production, several manufacturers employ various compaction techniques with various orientations.

Hand Ramming Compaction Moulds

The equipment comprises of a steel mould box that has been prefabricated and moulded to the required size of the block. It is designed so that when the cement and sand mixture is rammed together to create a sandcrete block, the resulting shape precisely fits the mould and so adheres to the necessary specifications. The compressed wet unit can be removed after hand ramming thanks to a detachable steel plate sitting at the bottom. The mould box has two curved steel handles that make it easier to remove the compacted unit.

hand moulded block
Hand moulding of blocks

A wooden bat in the form of a chisel serves as the compaction tool. The cement-sand mixture is brought up against the flat end of the bat, which is then driven over it and inserted into the steel mould. The compacted unit is taken out by slamming the box upside down. In order to receive the block, the opening end is eventually supported by a wooden pallet. The unit is turned upside down, and a removable steel plate now rests on top of it.

This is the commonest approach of block moulding in the rural areas of Nigeria.

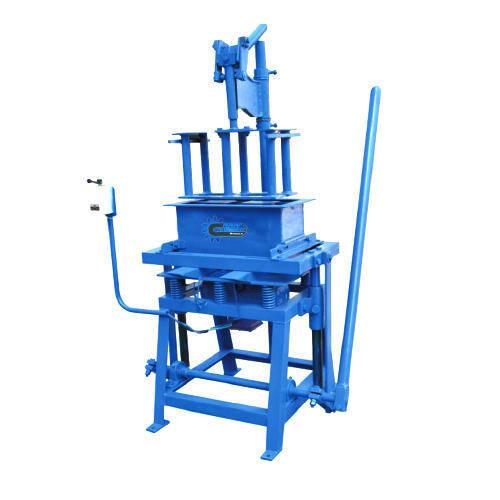
Manual Tamping Compaction Frame

This compaction technique uses a steel framework with a mould supported by four legs as its equipment. Although the exact finishing height varies depending on the manufacturer, it is often around 1.0 m high. The sole lever mechanism is attached to a base plate that accommodates the mould. The means of compaction is another plate (top plate) covering with an adjacent handle. When tamping, the top plate is always weighed down with a thick steel piece to apply pressure to the cement-sand mixture effectively.

hand operated block moulding machine
Sandcrete block production machine

Pulling down the tubular length by the frame moves the lever system. When compaction is complete, this action raises the completed product for collection. The adjacent handle is used to aid with compaction. Depending on the needed level of consolidation, the operation is repeated at least four times. For stability, the legs are braced, and the compacting pressure varies.

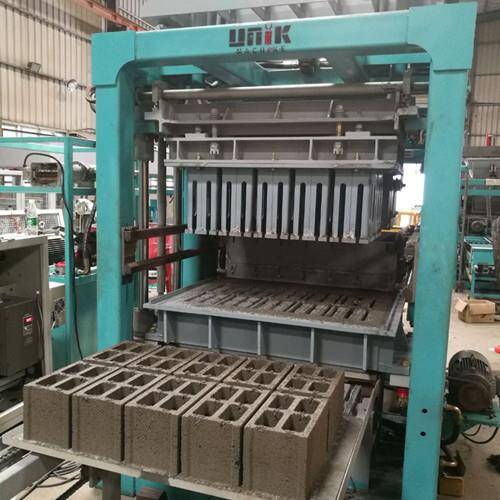
Motorised Vibration Machine

Unskilled labour can operate this equipment because it is designed to be simple to use. Because of the little maintenance it requires, the design is ideal for remote locations. Furthermore, the machine can be designed to run by diesel engines as well as electric motors. For stability and safe handling, robust frames are used in its design. It is controlled by three levers, and a constant hydraulic pressure is generated. The structure is 1.85 metres high.

It is powered by a motor that is tucked away beneath the wooden pallet on which the mould is set. The diesel variants use a roller that is turned by a fan belt that is fixed over the motor. The fixture on the motor, a metallic mass, collides with the underside of the wooden pallet, causing actual vibration. The longest lever, which is typically on the right side of the machine, is used to remove the moulded unit.

block moulding machine
Motorised Vibration Block Moulding Machine

Actual compaction is accomplished by pressing down on the cement-sand mixture in the mould below with the “presser.” The highest lever is used to achieve this. The vibration is turned off with a second lever. The final and longest lever on the right lifts the mould gradually to enable quick removal of the compacted unit. The amount of compacting pressure from the motorised vibration machine is fairly constant.

In research conducted in Nigeria, the NIS’s specified compressive strength for 150 mm (6 inches) sandcrete blocks at 28 days of curing was not met by either manually or mechanically operated methods (though a mix ratio of 1:9 was adopted in the study). Both manually and with the aid of a vibrating machine, nine (9) inches sandcrete blocks were produced, and they met all Nigerian Industrial Standards specifications.

However, blocks made using a vibrating machine had a larger compressive strength than those made by hand. The vibrating block moulding machine produces sandcrete blocks with the highest compressive strength of all the techniques used because it achieves appropriate compaction. Additionally, compared to the other two methods, the vibrating machine-produced sandcrete blocks absorbed more moisture. Another study from Ghana found that using compaction in the vertical orientation with motorised vibration satisfies the required standards.

Quality Control Tips for Block Production

  1. Water, sand, and aggregates must be clean and devoid of organic contaminants.
  2. Ideally, the sand to be used for block production should be dry. When wet, the moisture content and the water absorption should be determined to effectively control the water-cement ratio.
  3. Cement and aggregate must be mixed until the colour is uniform.
  4. Only add enough water to the mixture to make it workable.
  5. The wheelbarrows used for measurement (65-litre builder’s wheelbarrows) should not be heaped.
  6. All mixtures should never be retempered by adding more water because doing so weakens the final product and should be used up within two hours of initial mixing.
  7. Complete compaction is required. Avoid too little or inadequate compaction since it reduces the strength of the block.
  8. Blocks need to be cured after demoulding. Curing is the process of keeping the blocks at an ideal temperature and moisture level to promote the hydration of the cement and the development of maximum strength. The curing period for blocks should be at least 14 days.

Analysis of Partition Loads on Slabs | Wall Load on Slabs

The provision of partitions on suspended slabs of residential, commercial, or industrial buildings is widespread in the construction industry. Spaces in a building can be demarcated using a variety of partition materials such as sandcrete blocks, bricks, gypsum dry walls, timber stud walls, metal lath, etc. These partitions exert additional loads on a suspended slab, and should be accounted for in the design of the slab. This is necessary especially when there is no beam or wall directly under the slab supporting the partition.

It is important to note that wall and partition loads insist on suspended slabs as line loads instead of uniformly distributed loads. It is more complex to analyse line loads on plates than uniformly distributed loads. Therefore during designs, engineers usually attempt to represent line loads with equivalent uniformly distributed loads to make the computational effort easier.

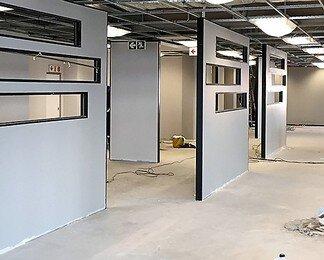
drywall partition load
Typical dry wall partitioning in an office building

There are established guides in the building code for assessing all types of loads that a building might be subjected to, and partition loads is not an exception. Typically in the design of reinforced concrete solid slabs, a partition allowance of between 1.00 kN/m2 to 1.5 kN/m2 is usually made during the analysis of dead loads (permanent actions). This is usually sufficient to allow for all lightweight movable partitions that may be placed on the slab later.

According to clause 6.3.1.2 of EN 1991-1-1:2002, provided that a floor allows a lateral distribution of loads, the self-weight of movable partitions may be taken into account by a uniformly distributed load qk which should be added to the imposed loads of floors obtained from Table 6.2. This defined uniformly distributed load is dependent on the self-weight of the partitions as follows:

  • for movable partitions with a self-weight < 1.0 kN/m wall length: qk = 0.5 kN/m2
  • for movable partitions with a self-weight > 1 ≤ 2.0 kN/m wall length: qk = 0.8 kN/m2
  • for movable partitions with a self-weight > 2 ≤ 3.0 kN/m wall length: qk = 1.2 kN/m2

However, full design consideration should be taken for heavier partitions, accounting for the locations and directions of the partitions and the structural forms of the floors.

According to BS 6399 Part 1, when the position of the wall load is not known, the equivalent uniformly distributed load that is added to the slab load should be 0.33wp (kN/m2), where wp is the weight of the wall (kN/m).

However, when the direction of the partition is normal to the span of the slab, the equivalent uniformly distributed load is given by 2wp/L for simply supported slabs and 3wp/2L for continuous slabs (Where L is the span of the slab normal to the wall load).

Said et al (2012) used finite element analysis and multiple linear regression to derive a general relation between line loads acting on two-way slab system and the equivalent uniformly distributed loads. According to them;

WUDL/WLine = 0.32193 + 0.00473α – 0.10175(L2/L1) ——– (R2 = 0.8327)

Where;
WUDL/WLine is the ratio of equivalent uniformly distributed load to actual line load,
α is the relative ratio of the stiffness of beam to slab,
L2/L1 is the aspect ratio of the slab.

Therefore, from the statistical relationship above, when the value of the line load is known, the equivalent UDL that will produce comparable bending moment values can be obtained using the aspect ratio of the slab and the ratio of the stiffness of the supporting beams to the slab.

Partitions such as sandcrete blocks exert a significant magnitude line load on reinforced concrete solid slabs. For a 225mm hollow block, the unit weight is about 2.87 kN/m2. For a 12 mm thick plaster on both sides, the total weight of finishes is about 0.6 kN/m2. This brings the total unit weight of the block to about 3.47 kN/m2, which is usually approximated to 3.5 kN/m2.

Therefore, for a wall height of 3m, the equivalent line load exerted on the supporting slab or beam is 3.5 kN/m2 × 3m = 10.5 kN/m.

So many structural engineering software design packages have the option of applying line loads directly on slabs. For software like Staad Pro, it may not be possible to assign line loads directly on plates, however a dummy beam of negligible stiffness can be used to transfer the line load to the slab.

Example on Partition Load Modelling

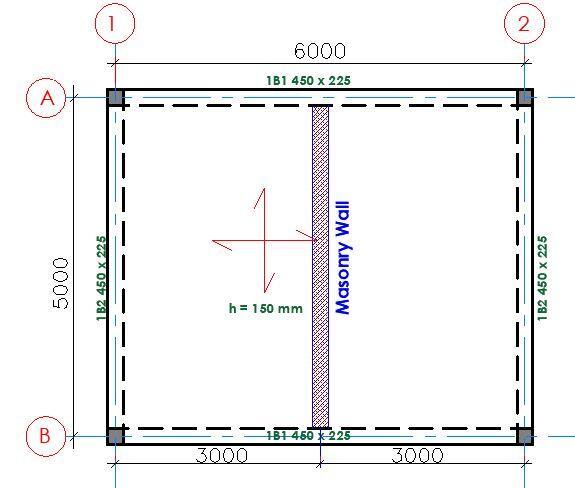
To demonstrate the effects of line loads from block wall, let us consider a 150 mm thick 5m x 6m two-way slab that is simply supported at all edges by a 450 mm x 225mm beam. The slab is supporting a line load of 10.5 kN/m coming from a 225 mm thick block wall placed at the centre parallel to the short span as shown below.

SLAB PLATE

We are going to consider several scenarios;

(a) When the slab is loaded directly with the line load (w = 10.5 kN/m)
(b) When the line load is represented with equivalent UDL given by 0.33wp = 0.33 × 10.5 = 3.15 kN/m2
(c) When the line load is represented with an equivalent UDL given by 2wp / L = (2 × 10.5)/6 = 3.5 kN/m2
(d) When the line load is represented with an equivalent UDL by Said et al (2012);
WUDL/WLine = 0.32193 + 0.00473α – 0.10175(L2/L1)

Stiffness of beam = (0.225 × 0.453)/12 = 1.70859 × 10⁻³ m4
Stiffness of slab = (1 × 0.153)/12 = 2.8125 × 10⁻⁴ m4
α = (1.70859 × 10⁻³)/(2.8125 × 10-4) = 6.075
L2/L1 = 6/5 = 1.2
WUDL/WLine = 0.32193 + 0.00473(6.075) – 0.10175(1.2) = 0.2279
Therefore WUDL = 0.2279WLine = 0.2279 × 10.5 = 2.392 kN/m2

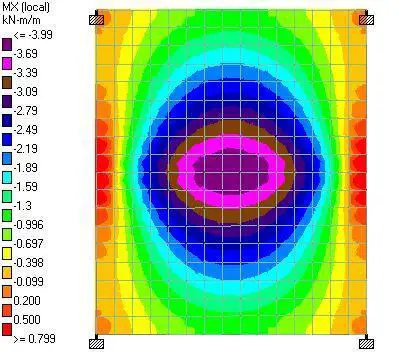
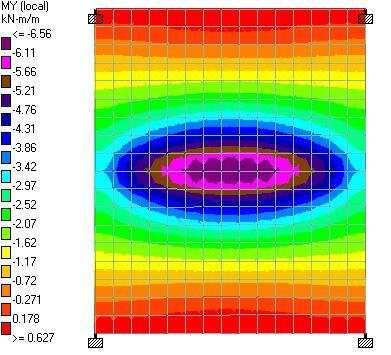
Analysis Results

(a) When the slab is loaded directly with the line load (w = 10.5 kN/m)

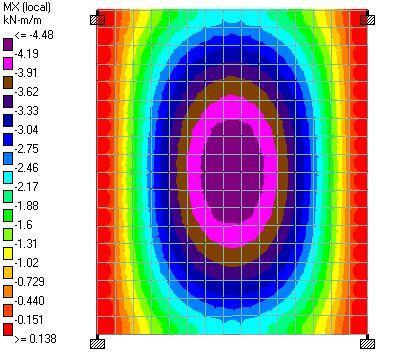
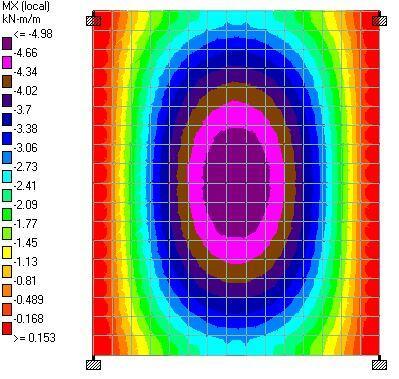
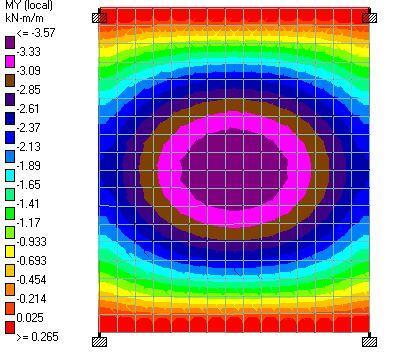
MX1
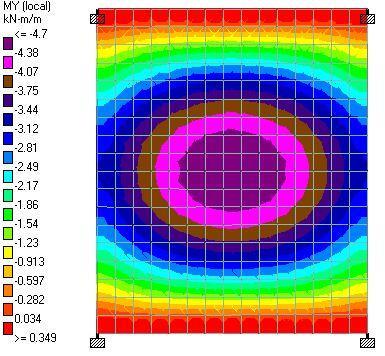
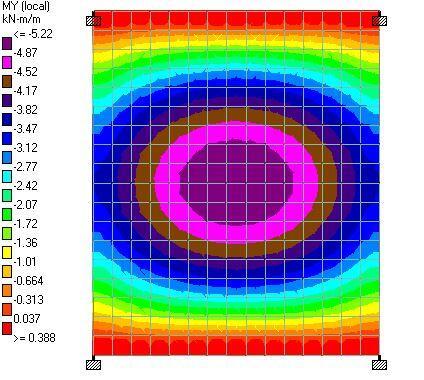
MY1
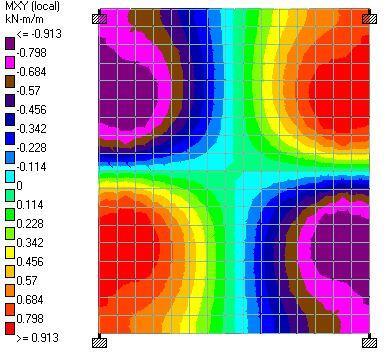
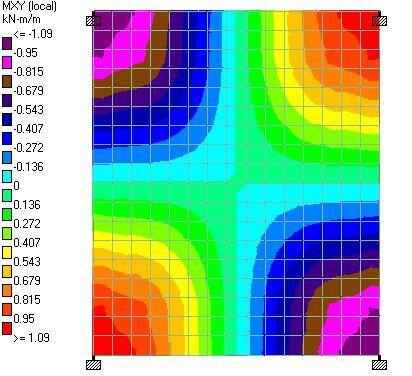
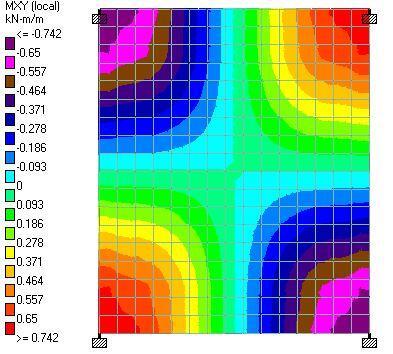
MXY1


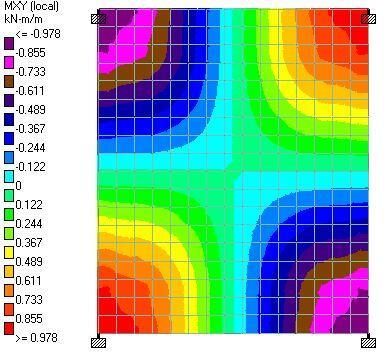
(b) When the line load is represented with equivalent UDL (we = 3.15 kN/m2)

my2

(c) When the line load is represented with equivalent UDL (we = 3.5 kN/m2)

mx3 1
my3 1
mxy3 1

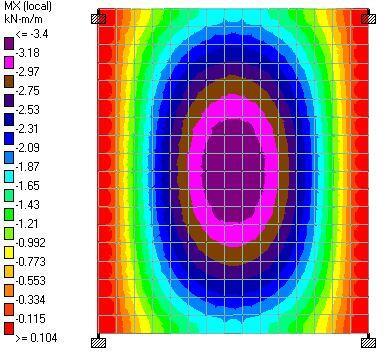
(d) When the line load is represented with equivalent UDL (we = 2.392 kN/m2)

my4
Analysis MethodMx (sagging)Mx (hogging)My (sagging)Mx (hogging)Mxy
Line Load3.99 kNm0.799 kNm6.65 kNm0.627 kNm0.913 kNm
0.33wp = 3.15 kN/m24.48 kNm0.138 kNm4.7 kNm0.349 kNm0.978 kNm
2wp / L = 3.5 kN/m24.98 kNm0.153 kNm5.22 kNm0.388 kNm1.09 kNm
WUDL = 0.2279WLine = 2.392 kN/m23.4 kNm0.104 kNm3.57 kNm0.265 kNm0.742 kNm

From the analysis result, it can be seen that none of the proposed equations was able to capture the effect of the line load adequately. Therefore, when heavy wall loads are to be supported on suspended slabs, the line load should be properly modelled on the slab instead of being converted to equivalent uniformly distributed load.

References

Said A. A, Obed S. R., and Ayez S. M. (2012): Replacement of Line Loads acting on slabs to equivalent uniformly Distributed Loads. Journal of Engineering 11(18):1193 – 1200


Design of Cantilever Stairs

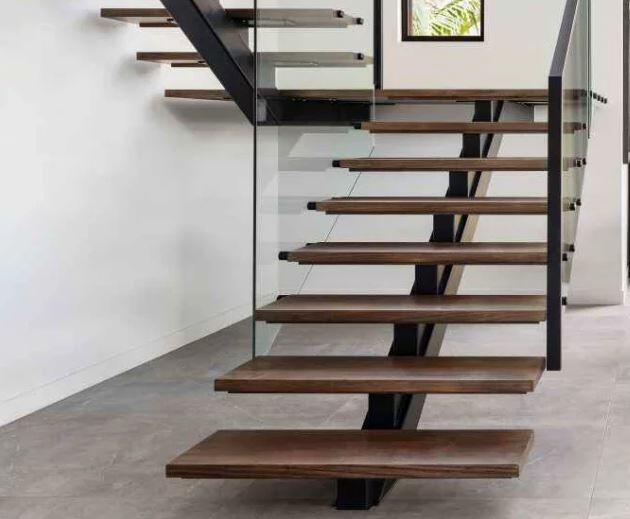
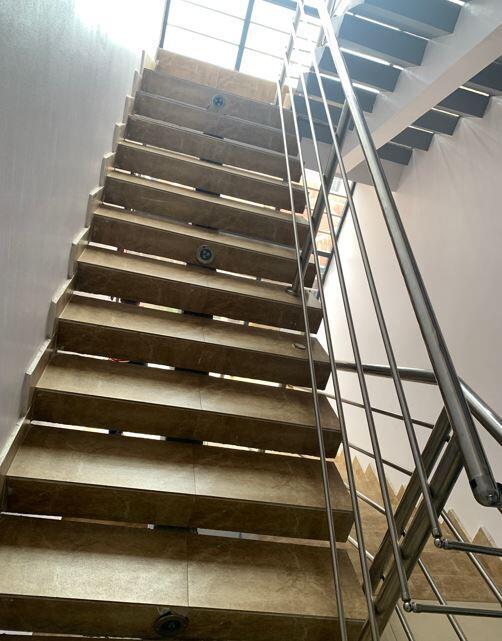
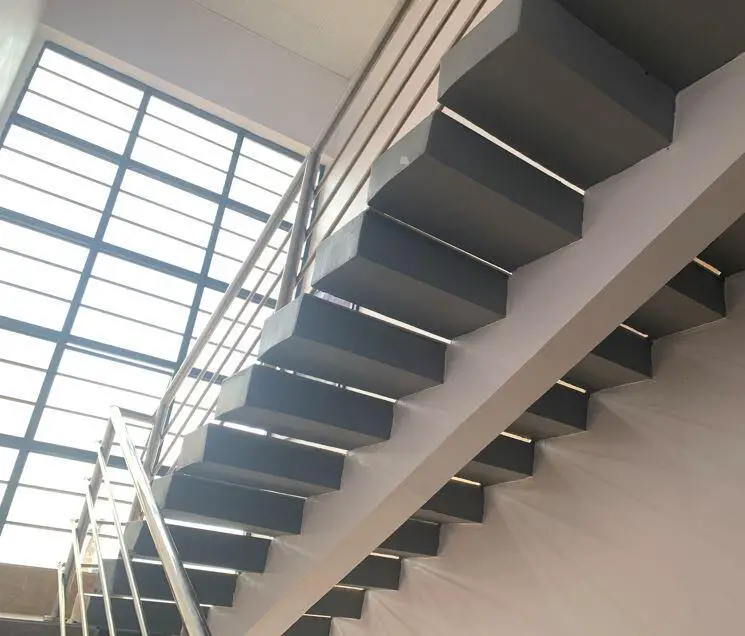
Cantilever stairs are a unique type of staircase where one end of the tread is rigidly supported by a beam or reinforced concrete wall, and the other end free. By implication, one end of the tread of the cantilever staircase appears to be floating in the air without support.

The design and construction of a cantilever staircase are expected to maintain and/or enhance the aesthetic appeal, while at the same time, ensuring that the staircase satisfies ultimate and serviceability limit state requirements.

The design of cantilever stairs, therefore, involves the selection of the adequate size of the supporting beams/walls, treads, and other accessories to support the anticipated load on the staircase and to also ensure the good performance of the staircase while in service. For reinforced concrete spine beams, the dimensions and reinforcements provided must satisfy all design requirements, while for steel spine beams, the section selected must satisfy all the requirements.

Moreover, the thickness of the tread must be adequate such that it does not undergo excessive vibration, cracking, deflection, or failure. The tread can be made of reinforced/precast concrete, timber, steel, glass, or composite sections.

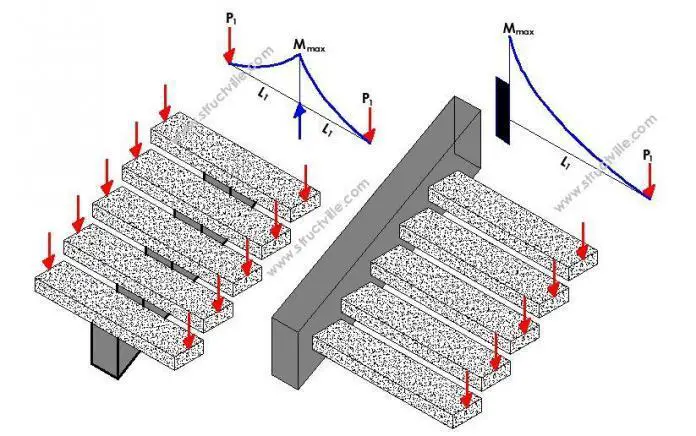
Structurally, there are two variations of cantilever staircases;

(a) Cantilever staircase supported by a central spine beam
(b) Cantilever staircase supported by a side spandrel beam or RC Wall

cantilever staircase with spine beam
(a) Cantilever staircase supported by a spine beam
cantilever staricase
(b) Cantilever staircase supported by a side spandrel beam or RC Wall

In the first case, the spine beam of the staircase is placed at the centre of the tread, with the two ends of the tread hanging free. In the second case, only one end of the tread is fixed to an adjacent wall where the spandrel beam is hidden to support the treads, and the other end is free. Alternatively, if the wall is a reinforced concrete wall, spandrel beams will no longer be required. Therefore, the latter has a longer moment arm than the former.

Cantilever stair sections

For the design of cantilever staircases, the use of uniformly distributed live loads should not be employed. Rather, the concentrated loads provided in Table 6.2 of EN 1991-1-1:2002 should be used. According to clause 6.3.1.2(5)P, the concentrated load shall be considered to act at any point on the floor, balcony or stairs over an area with a shape which is appropriate to the use and form of the floor. The shape may be assumed to be a square of 50 mm.

Furthermore, the possibility of upward loading on the cantilever staircase should also be considered.

cantilever stair with spine beam 2

Worked Example on the Design of Cantilever Stairs

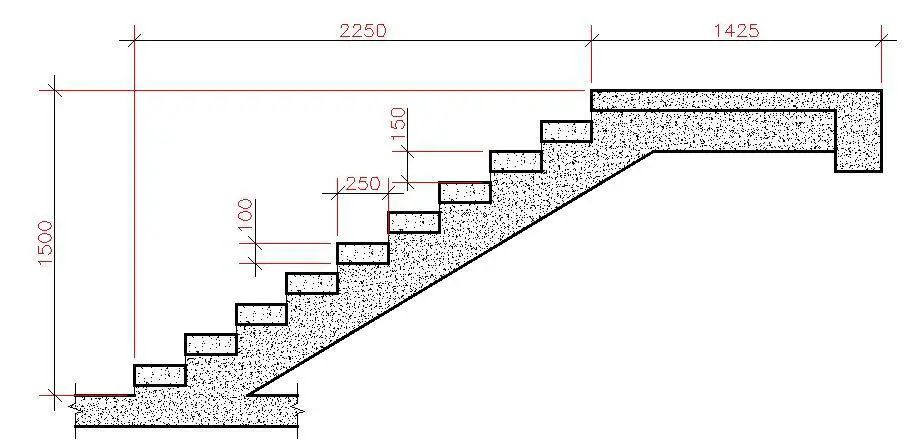
Design the treads and spine beam of the cantilever staircase in a proposed residential dwelling with the following information;

longitudinal profile of staircase

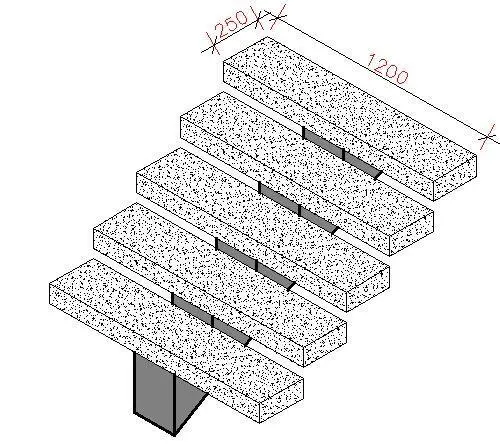
Width of staircase = 1200 mm
Going (width of riser) = 250 mm
Riser = 150 mm
Thickness of riser = 100 mm
fck = 25 N/mm2
fyk = 500 N/mm2

cantilever staircase

Load Analysis

For a staircase in a residential dwelling the uniformly distributed live load varies from 2.0 to 4.0 kN/m2, while the concentrated load (which can be used for local verification) varies from 2.0 to 4.0 kN. The exact value can be decided by the National Annex of the country.

Permanent Actions
Self weight of thread (UDL) = 25 × 0.1 × 0.25 = 0.625 kN/m
Finishes (allow 1.2 kN/m2) = 1.2 × 0.25 = 0.3 kN/m
Total UDL gk = 0.925 kN/m
Railings (allow) Gk = 0.5 kN (Concentrated load)

Variable Actions
Allow a variable concentrated load Qk of 3 kN (at the free end)

Ultimate Limit State
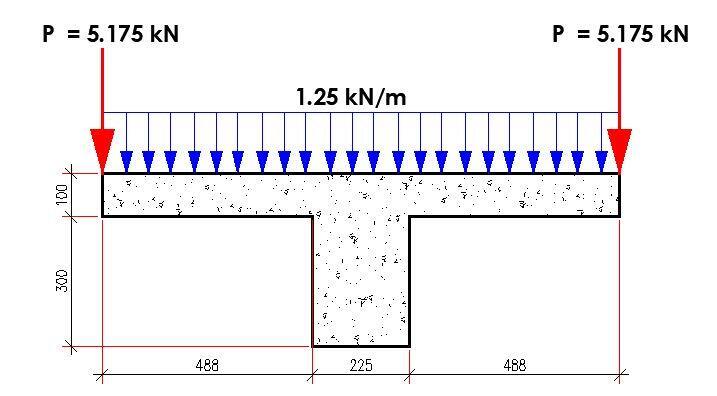
Permanent load (gk) = 1.35 × 0.925 = 1.25 kN/m
Permanent load (Gk) = 1.35 × 0.5 = 0.675 kN
Variable load (Qk) = 1.5 × 3 = 4.5 kN

LOADING ON CANTILEVER STAIRCASE

Maximum design moment (about the centreline of spine beam) = (1.25 × 0.62)/2 + (5.175 × 0.6) = 3.33 kNm
Maximum shear (about the centreline of spine beam) = (1.25 × 0.6) + (5.175) = 5.925 kN

Flexural Design

Design bending moment; M = 3.3 kNm
Effective depth of tension reinforcement; d = 68 mm
Redistribution ratio;  d = min(Mneg_red_z3 / Mneg_z3, 1) = 1.000

K = M / (b × d2 × fck) = 0.115
K’ = 0.207
K’ > K – No compression reinforcement is required
Lever arm;  z = min(0.5 × d × [1 + (1 – 2 × K / (h × acc / γC))0.5], 0.95 × d) = 60 mm
Depth of neutral axis; x = 2 × (d – z) / λ = 20 mm
Area of tension reinforcement required; As,req = M / (fyd × z) = 127 mm2

Tension reinforcement provided; 3H12  As,prov = 339 mm2
Minimum area of reinforcement – exp.9.1N; As,min = max(0.26 × fctm / fyk, 0.0013) × b × d = 23 mm2
Maximum area of reinforcement – cl.9.2.1.1(3); As,max = 0.04 × b × h = 1000 mm2
PASS – Area of reinforcement provided is greater than area of reinforcement required

Crack control

Maximum crack width;  wk = 0.3 mm
Design value modulus of elasticity reinf – 3.2.7(4);  Es = 200000 N/mm2
Mean value of concrete tensile strength; fct,eff = fctm = 2.6 N/mm2
Stress distribution coefficient; kc = 0.4
Non-uniform self-equilibrating stress coefficient;     k = min(max(1 + (300 mm – min(h, b)) × 0.35 / 500 mm, 0.65), 1) = 1.00

Actual tension bar spacing;  sbar = 93 mm

Maximum stress permitted – Table 7.3N; ss = 326 N/mm2
Steel to concrete modulus of elast. ratio; acr = Es / Ecm = 6.35
Distance of the Elastic NA from bottom of beam; y = (b × h2 / 2 + As,prov × (acr – 1) × (h – d)) / (b × h + As,prov × (acr – 1)) = 49 mm
Area of concrete in the tensile zone; Act = b × y = 12195 mm2
Minimum area of reinforcement required – exp.7.1; Asc,min = kc × k × fct,eff × Act / ss = 38 mm2
PASS – Area of tension reinforcement provided exceeds minimum required for crack control

Quasi-permanent moment; MQP = 1.0 kNm
Permanent load ratio;  RPL = MQP / M = 0.30
Service stress in reinforcement; ssr = fyd × As,req / As,prov × RPL = 49 N/mm2
Maximum bar spacing – Tables 7.3N; sbar,max = 300 mm
PASS – Maximum bar spacing exceeds actual bar spacing for crack control

Deflection control

Reference reinforcement ratio;  ρm0 = (fck)0.5 / 1000 = 0.00500
Required tension reinforcement ratio; ρm = As,req / (b × d) = 0.00748
Required compression reinforcement ratio; ρ’m = As2,req / (b × d) = 0.00000
Structural system factor – Table 7.4N; Kb = 0.4

Basic allowable span to depth ratio ; span_to_depthbasic = Kb × [11 + 1.5 × (fck)0.5 × ρm0 / (ρm – ρ’m) + (fck)0.5 × (ρ’m / ρm0)0.5 / 12] = 6.404

Reinforcement factor – exp.7.17; Ks = min(As,prov / As,req × 500/ fyk, 1.5) = 1.500
Flange width factor; F1 = 1.000
Long span supporting brittle partition factor; F2 = 1.000

Allowable span to depth ratio; span_to_depthallow = min(span_to_depthbasic × Ks × F1 × F2, 40 × Kb) = 9.606
Actual span to depth ratio;  span_to_depthactual = Lm1_s1 / d = 8.824

Shear Design

Using the maximum shear force for all the spans
Support A; VEd (say) = 6 kN
VRd,c = [CRd,c.k. (100ρ1 fck)1/3 + k1cp]bw.d ≥ (Vmin + k1cp)bw.d
CRd,c = 0.18/γc = 0.18/1.5 = 0.12
k = 1 + √(200/d) = 1 + √(200/68) = 2.714 < 2.0, therefore, k = 2.00
Vmin = 0.035k3/2fck1/2
Vmin = 0.035 × 2.003/2 × 251/2 = 0.494 N/mm2
ρ1 = As/bd = 339/(250 × 68) = 0.0199 < 0.02;

σcp = NEd/Ac < 0.2fcd
(Where NEd is the axial force at the section, Ac = cross sectional area of the concrete), fcd = design compressive strength of the concrete.) Take NEd = 0

VRd,c = [0.12 × 2 × (100 × 0.0199 × 25 )1/3] × 250 × 68 = 15005.755 N = 15 kN

Since VRd,c (15 kN) < VEd (6 kN), No shear reinforcement is required.

However, nominal shear reinforcement can be provided as H8 @ 150 c/c.

Summary of the tread (going) design
Thickness = 100 mm
Reinforcement = 3H12 (Top and Bottom)
Links = H8 @ 150 c/c.

Design of the Spine Beam

To design the spine beam, it is very important to transfer the load from the treads to the top of the spine beam. In other words, the spine beam will be subjected to its self-weight and the load from the treads. It will be very important to also consider the effects of asymmetric loading (when the live load is acting only on side of the staircase). This can lead to the development of torsional stresses on the beam.

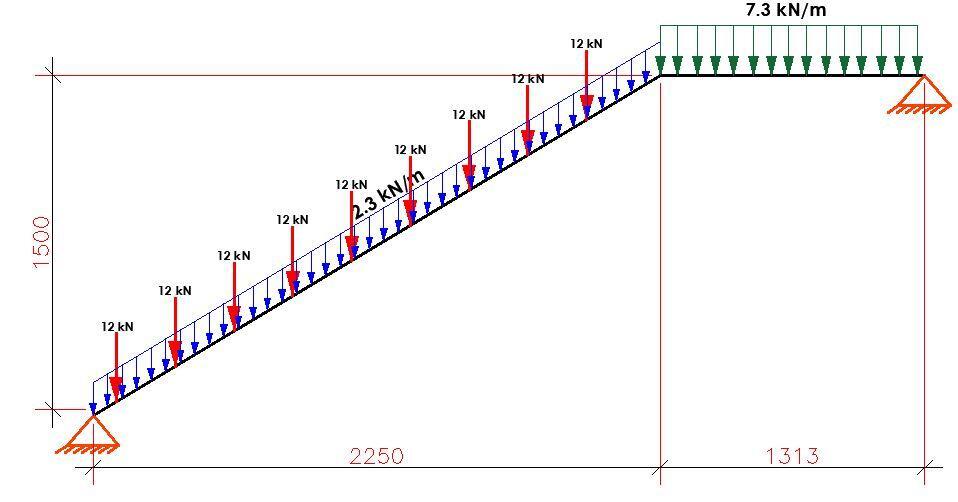
Ultimate limit state load transferred from treads to beam = 6 kN + 6 kN = 12 kN (concentrated loads)
Load transferred from the landing area (say) = 5 kN/m

Width of spine beam = 225 mm
Depth = 300 mm
Self weight of spine beam (drop) = 1.35 × 25 × 0.225 × 0.3 = 2.278 kN/m
Self weight of the stepped area = 1.35 × 0.5 × 0.15 × 0.225 = 0.02278 kN/m

Total uniformly distributed load on the flight = 2.3 kN/m
Total uniformly distributed load on the landing = 2.278 + 5 = 7.278 kN/m

The spine beam was loaded as shown below;

staircase loading

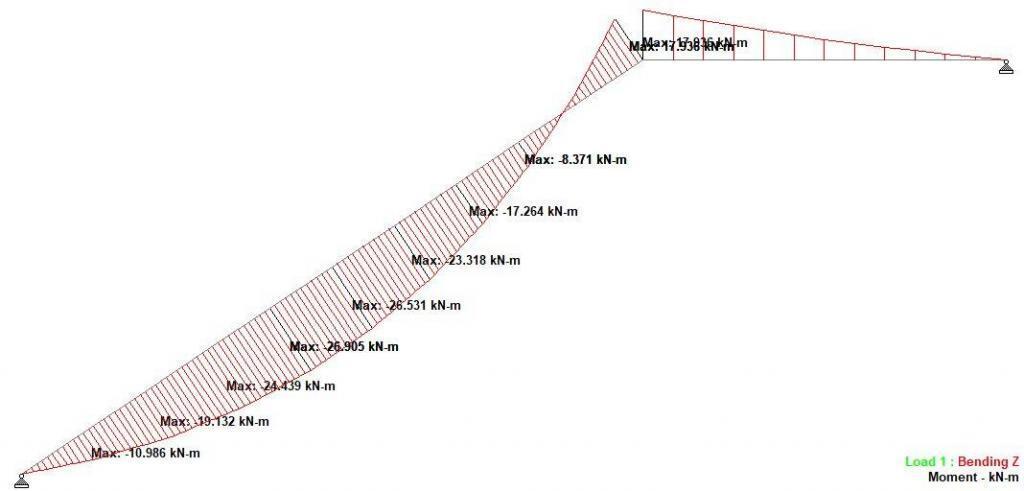
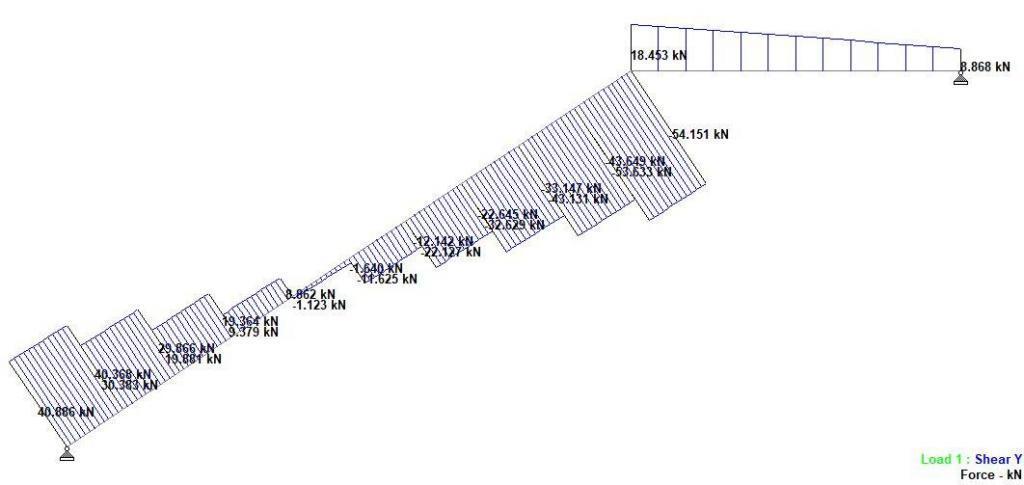
The analysis results are shown below;

Maximum bending
shear

Flexural Design

Design bending moment; M = 26.9 kNm
Effective depth of tension reinforcement; d = 264 mm
K = M / (b × d2 × fck) = 0.086
K’ = 0.207

K’ > K – No compression reinforcement is required
Lever arm; z = min(0.5 × d × [1 + (1 – 2 × K / (h × acc / γC))0.5], 0.95 × d) = 242 mm
Depth of neutral axis;  x = 2 × (d – z) / λ = 54 mm

Area of tension reinforcement required; As,req = M / (fyd × z) = 255 mm2
Tension reinforcement provided;  2H16  As,prov = 402 mm2
Minimum area of reinforcement – exp.9.1N; As,min = max(0.26 × fctm / fyk, 0.0013) × b × d = 77 mm2
Maximum area of reinforcement – cl.9.2.1.1(3); As,max = 0.04 × b × h = 2700 mm2
PASS – Area of reinforcement provided is greater than area of reinforcement required

Shear Design

Angle of comp. shear strut for maximum shear; θmax = 45 deg
Strength reduction factor – cl.6.2.3(3); v1 = 0.6 × (1 – fck / 250) = 0.552
Compression chord coefficient – cl.6.2.3(3); αcw = 1.00
Minimum area of shear reinforcement – exp.9.5N;   Asv,min = 0.08 N/mm2 × b × (fck)0.5 / fyk = 161 mm2/m

Design shear force at support ; VEd,max = VEd,max_s1 = 54 kN
Min lever arm in shear zone;  z = 242 mm
Maximum design shear resistance – exp.6.9; VRd,max = αcw × b × z × v1 × fcwd / (cot(θmax) + tan(θmax)) = 201 kN

PASS – Design shear force at support is less than maximum design shear resistance

Design shear force ;  VEd = 54 kN
Design shear stress;  vEd = VEd / (b × z) = 0.994 N/mm2
Angle of concrete compression strut – cl.6.2.3; θ = min[max(0.5 × sin-1(min(2 × vEd / (acw × fcwd × v1),1)), 21.8 deg), 45deg] = 21.8 deg
Area of shear reinforcement required – exp.6.8; Asv,des = vEd × b / (fyd × cot(θ)) = 206 mm2/m
Area of shear reinforcement required;  Asv,req = max(Asv,min, Asv,des) = 206 mm2/m

Shear reinforcement provided;   2H8 @ 175 c/c
Area of shear reinforcement provided;  Asv,prov = 574 mm2/m
PASS – Area of shear reinforcement provided exceeds minimum required
Maximum longitudinal spacing – exp.9.6N;  svl,max = 0.75 × d = 198 mm

cantilever stair with spine beam

EXTRA:
The structural analysis result revealed a high compressive axial load on the spline beam. As a result, it will be important to check the interaction of bending moment and axial force, as typically will be done in the design of reinforced concrete columns. This was checked and found satisfactory.

Furthermore, the possibility of a torsional moment on the spline beam when the live load is asymmetrically loaded should also be checked.


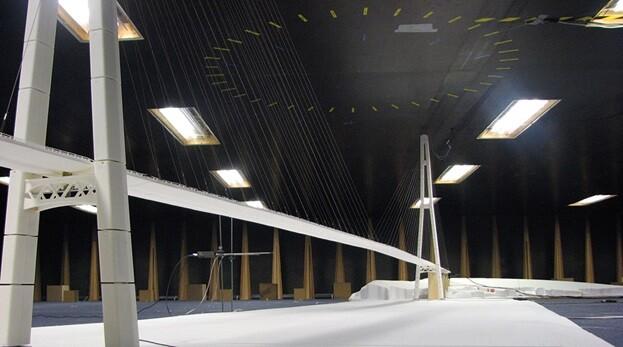
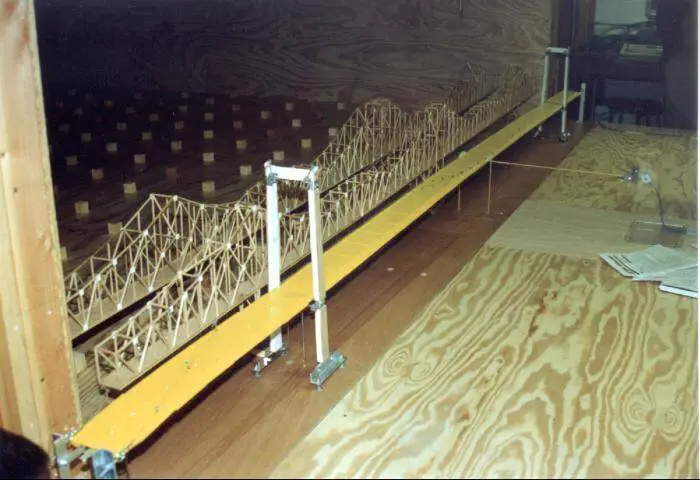
Wind Tunnel Testing for Bridges

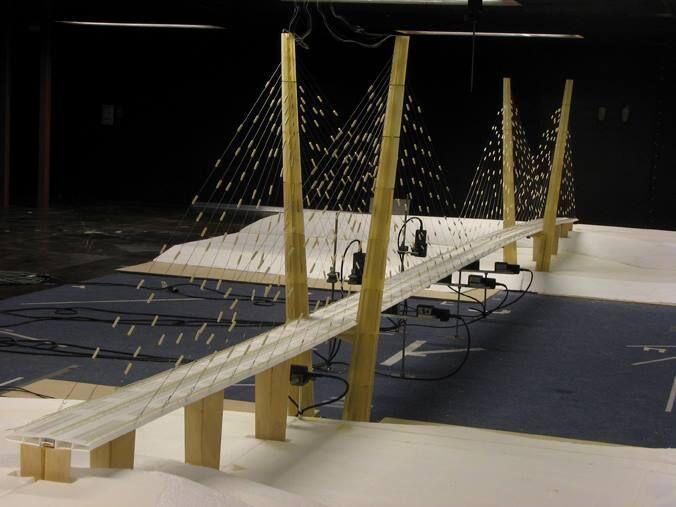
It is common practise to test bridges with lengthy or unusually flexible decks in wind tunnels. In order to fully comprehend the structure’s aerodynamic behaviour, wind tunnel testing may occasionally be necessary, as described in BD 49/01 (Department of Transport, 2001a). The aerodynamics and wind-induced reaction of vehicles can be impacted by the wind field on a bridge deck. Studies of wind fields on bridge decks can be used as a guide when designing a bridge to guarantee the safety of moving vehicles.

For long span bridges, the use of wind tunnel testing is imperative. The term “long span bridges” typically refers to structures with a span length of between 1000 and 1500 metres. The first natural frequencies for these bridges are of the order of 0.1 Hz or lower, and the structure possesses very high flexibility. Bridges with span lengths over 1.5 km are categorised as “extremely long span bridges,” and their natural frequencies decrease in inverse proportion of the span length.

Objectives of Wind Tunnel Testing

There are three main objectives for the use of wind tunnel testing during bridge design.

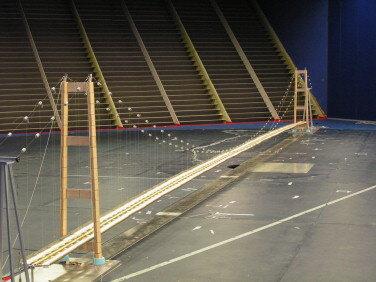
Wind Tunnel Testing for Bridges

First, wind tunnel testing is utilised to estimate structure-specific drag and lift coefficients if bridge decks or piers do not conform to the conventional cross-sections specified in design regulations. The mean lateral force, mean normal force, and pitching moment near the centre of the deck are used to measure static wind loads, which are then given as static wind load coefficients. Depending on the location of the bridge site, measurements are made in both smooth and turbulent flow conditions.

The second objective is to determine whether a structure is vulnerable to vortex shedding and divergent amplitude responses. These evaluations are typically carried out under conditions of uniform flow at various test wind incidence angles.

The third objective is to examine how nearby terrain or structures affect the structure’s dynamic reaction. The main impact of such obstructions is to change the wind’s angle of action on the structure. The wind field in built-up areas is frequently extremely complicated, and it is feasible for the wind to be directed around nearby structures, increasing the mean velocity on the bridge’s under-review zones.

Modelling for Wind Tunnel Testing

For prismatic (two-dimensional) constructions like long-span bridge decks, section model investigations are carried out. To simulate the attributes of the structure, a rigid model is fixed to a dynamic test rig made of a set of springs. The dynamic response caused by phenomena like vortex shedding and the wind speeds for the development of aerodynamic instabilities like galloping and flutter are measured.

The failure of the Tacoma Narrows Bridge demonstrated the catastrophic failure that flutter can cause, which motivated engineers to carefully consider the aerodynamic analysis inside bridge design procedures.

The section model for wind tunnel testing can be made from materials such balsa wood, carbon fibre sheet, and steel sections, and it is designed to correctly replicate the prototype’s scaled mass as well as its lowest torsional and bending frequencies. Handrails, parapets, guiding vanes, maintenance gantry rails, stay pipes, and any other non-structural accessories that may have an impact on the deck’s aerodynamic behaviour should be included in sectional models.

wind tunnel testing of a suspension bridge

Aerodynamically comparable representations may be employed when these elements are too small to be scale-modelled. Typically, dimensions must be accurate to ±0.05 mm. The target spectral density function must be closely matched where turbulent atmospheric conditions are required.

A two-dimensional grid of vertical and horizontal strips is usually placed at the entrance of the wind tunnel test section to create turbulent conditions in low-speed aeronautical wind tunnels. It is possible to recreate the necessary turbulence conditions by adjusting the grid spacing.

BLWTL

Hot-wire anemometry is used to measure the wind parameters immediately upstream of the test section’s installation, including mean wind speed, turbulence intensity, and wind spectra. These turbulence characteristics are measured at various wind speeds that reflect the anticipated experimental circumstances. The u– and w-component spectra, as well as the longitudinal and vertical turbulence intensities, are used to display the results of the turbulence simulation.

The produced by the Engineering Sciences Data Unit standards, as well as the measured and target spectra, should be compared (ESDU). Smoke visualisation can be used during tests to study the vortex-shedding reaction to see how the airflow over the structure is changing.

The model forces and moments observed in the wind tunnel are used to generate the static load coefficients in the wind axis system as follows:

Drag coefficient, CD = D/0.5ρVm2B
Lift coefficient, CL = L/0.5ρVm2B
Pitching coefficient, CM = M/0.5ρVm2B

where D, L and M are the wind axis along- and across-wind force and pitching moment. Vm is the mean wind speed, ρ is the density of air (in the UK taken as 1.225 kg/m3) and B is the reference dimension which is usually the deck width.

Force coefficients must however be adjusted to take into account blockage effects brought on by the wind tunnel’s constriction. There are several approaches for computing correction factors, hence it is advised to consult specialised literature like ESDU 80024 (ESDU, 1980) to determine which method is best for the specific blockage ratio being taken into account.

The Reynolds number (Re) is likely to be sensitive to sections with round section members or curved surfaces, therefore adjustments based on full-scale data or theoretical considerations may be required.

Analysis of Wind Tunnel Test Models

A whole bridge’s aerodynamic model is also known as an aero-elastic model. For structures with considerable wind-induced motions that have an impact on the aerodynamic forces and subsequently the dynamic response, aero-elastic tests are carried out. These structures usually behave as three dimensional structures.

By simulating the structure’s mass and stiffness distribution, models are created to replicate the essential dynamic properties. Particularly, the basic modes that control the structure’s dynamic response must be accurately modelled at the model-scale frequency. Transducers that measure displacement or acceleration are used to directly measure modal responses.

The modal responses measured are then used to calculate dynamic loads, or in the case of vertical structures, they are directly measured. The models for long-span bridges may be quite large because, typically, models for aeroelastic tests are constructed at either 1:200 or 1:100 scales.

wind tunnel test on cable stayed bridge

Boundary layer wind tunnels (BLWT) with wide sections are therefore necessary for the experiments. A 1:100 scale aeroelastic replica of the Japanese Akashi-Kaiko bridge was constructed, having an overall length of about 40 m. Figure 19 depicts an instance of an aeroelastic model in a BLWT.

In a BLWT, turbulent boundary conditions are produced by placing a configuration of roughness elements across the wind tunnel’s floor and placing a two-dimensional barrier with square vortex-generating posts at the test section’s entry. These elements’ size, form, and distribution are planned to produce the specific turbulence characteristic needed for the testing.

Calibration of the wind-tunnel-generated turbulence attributes should be carried out with reference to the target spectrum, just like the section model testing. At crucial locations on the structure, displacement transducers and accelerometers measure the time histories of acceleration and acceleration during the testing.

Mean, root mean square (RMS) background, and RMS resonant components are calculated from the displacement time histories. The RMS resonant components of the movement are determined using acceleration time histories. In order to provide enough coverage of the design wind speed range representative of the bridge site, time records are recorded at small wind speed increments.

The Fourier transformation is used to analyse each time history in order to identify the spectrum, allowing for the isolation of narrowband responses that are indicative of structural resonance. By removing the peaks that correspond to the resonant components of displacement, background components can be extracted from displacement spectra.

The elements of a typical measured wind spectrum are shown below. The mean displacements plus or minus a sum of the standard deviations of the background and resonant components of displacement due to each mode are then used to determine the peak displacements.

Spectral density of a response to wind

The following expression is commonly used for calculating the measured peak displacements:

Dpeak = Dmean ± √(g0Dsdev)2 + ∑(gkDmodek)2

where;
Dpeak = peak displacement
Dmean = mean displacement
Dsdev = standard deviation of background displacement
Dmode = RMS inertial displacement due to response in mode k
g0 = peak factor to apply to background standard deviation (typically 3.4 to 3.5)
gk = peak factor to apply to narrow band displacement due to motion in mode k.

The required peak factors across the modal responses are determined for the modal or narrow band displacements using the Davenport gust factor, which is given as:

gk = √[2In(fkT0) + 0.577/2In(fkT0)]

where;
fk = natural frequency of kth mode (in hertz)
T0 = storm duration (typically 3600 seconds).

Correction factors may also be required within the calculation of the peak displacements in order to account for scaling inaccuracies necessitated by virtue of the model scale, e.g. cable diameters.

Wind Tunnel Testing of Cable Stays

Similar to the static testing of deck sections, testing of stay cables in wind tunnels is done to determine the drag coefficient and check for any potential divergent instabilities. Stay cables are often tested at full scale to guarantee Reynolds number similarity between model and prototype.

The surface characteristics of the prototype, such as any helical fillets or dimple patterns, should be precisely reflected in the cable models. Using calibrated spring balances and turntables in the test section’s ceiling and floor, cable models are dynamically mounted. This makes it possible to test the cable model in a variety of wind directions and wind-inclination angles. Spray heads positioned in the tunnel ceiling in some specialised wind tunnels can imitate a variety of rain conditions, making it possible to analyse rain-induced cable vibrations.

Best Hydraulic Cross-section of Roadside Drains

Drains are one of the components of the drainage system of residential areas and/or public infrastructures. Generically, roadside drains are structures used for collecting and conveying surface water to their discharge point, and in many cases, are artificial. Furthermore, drains are essential in road construction as stormwater ponding on pavement surfaces can cause premature pavement failure especially when unevaporated and undrained water seeps into the pavements.

The main objective of road drainage is to keep the road surface and foundation as dry as possible to maintain its stability. Thus, a good drainage system is essential for efficient highway transportation with minimum maintenance costs. Similarly, proper planning and design of road drainage systems are very important to prevent water from in-filtering the road surface, removing it from driving lanes, and carrying it away from the roadway.

pavement with no roadside drains
Water ponding on highway due to poor drainage

Common Roadside Drain Cross-sections

The common cross-sections used for roadside drains construction are rectangular and trapezoidal sections. Trapezoidal drains have sloped sides and can be formed by excavating in-situ materials. The sloped sides and channel bottom may require paving for protection, depending on the stability of the sides and the resistance of the in-situ materials to erosion. However, trapezoidal drains are now formed with reinforced concrete, which may be precast units or cast-in-place.

trapezoidal drain
Trapezoidal drain
rectangular drain
Rectangular drain

Similarly, rectangular drains have vertical or near-vertical sides, formed with reinforced concrete retaining walls, I-walls, or U-frame structures. The bottom of the channel may be paved or unpaved depending on the resistance of the in situ material to erosion.

Picture3 102454
Typical cross-sections for roadside drain
Cross-section Flow Area (A)Wetted Perimeter (P)Top width (T) Hydraulic Radius (R)
Rectangularbyb + 2ybA/P
Trapezoidaly(b + yz)b + 2y√(1 + z2)b + 2yzA/P
Geometric dimensions of drain cross-sections

Best Hydraulic Cross-section

The best cross-section for a drainage channel provides adequate hydraulic capacity at the minimum cost. Economic considerations for selecting the channel section include design and construction costs, right-of-way, required relocations, maintenance and operation.

A trapezoidal channel is usually the most economical channel when right-of-way is available. In contrast, a rectangular channel may be required for channels located in urban areas where the right-of-way is severely restricted or available at a high cost. Furthermore, site developments, existing geophysical site conditions, and performance or service requirements affect the selection of channel type and the resulting construction costs.

For discharge to be maximum or for the best hydraulic cross-section in a rectangular channel;
b = 2y and R = y/2

For trapezoidal channel;
T + 2yz = 2y√(z2 + 1)
R = y/2
A = 3(1/2) × y2
b = 2y/3(1/2)
Z = 1/3(1/2) = 0.577

Freeboard for Drains

In open channels or drains, freeboard is of great importance. The provision of freeboard in open drains ensures enough room for wave action and flow surges not to overtopping or overflow the drain. Many uncontrolled causes may create wave action or water surface fluctuation, but mostly because of changes in specific energy of the flow in a channel.

Therefore, a freeboard is provided to ensure the drain is not filled with water. In addition, the calculated discharge rate does not consider deposited solids and lack of maintenance, which will usually reduce the system’s efficiency.

A table for minimum freeboard for ditches is provided below;

Picture2 102454 1
Freeboards for roadside drains

Worked Example

It was estimated from hydrological analysis that the peak discharge from a catchment area is 1.351m3/s. Using Manning’s equation, determine the best hydraulic cross-section for a rectangular and trapezoidal roadside drain. Other assumptions for computation are provided below.

Q = VA
V= 1/n x R2/3 × S1/2

Where:
Q = Discharge (m3/s)
A = Flow area (m2)
V = Allowable velocity (m/s)
R = Hydraulic radius (m)

Manning’s roughness coefficient (n) = 0.014
Bed slope of channel (S) = 3% (0.03)

Solution

From
Q = VA ——– (1)
Q = 1/n × R2/3 × S1/2 × A ——– (2)

(a) For the best hydraulic section for the rectangular drain;
b = 2y and R = y/2

Cross-sectional area of drain (A) = by
Substituting b = 2y into the area formula;
Cross-sectional area of drain (A) = (2y)y = 2y2

Substituting Q, n, R, S and A into Equation (2);

1.351= 1/0.014 × (y/2)2/3 × 0.031/2 × 2y2
1.351= 1/0.014 × (y/2)2/3 × 0.1732 × 2y2
1.351= 1/0.014 × y2/3/1.5874 × 0.1732 × 2 × y2

y8/3 = 0.087m

y = 0.0873/8 = 0.4 m

Cross-sectional area of drain (A) = 2y2 = 2 × 0.42 = 0.32m2
Width of drain (b) = 2y = 2 × 0.4 = 0.8 m

It is necessary to provide freeboard of at least 1 ft (0.3 m)
Therefore, drain depth = 0.4 + 0.3 = 0.7 m

Capture 102452

(b) For the best hydraulic section for the trapezoidal drain;

Area of drain (A) = 31/2 × y2
R = y/2
Bottom width (b) = 2y/31/2
Z = 1/31/2 = 0.577

Substituting Q, n, R, S and A into Equation (2)

1.351 = 1/0.014 × (y/2)2/3 × 0.031/2 × (31/2 × y2)
1.351 = 1/0.014 × (y/2)2/3 × 0.1732 × 1.7321 x y2
1.351 = 1/0.014 × y2/3/1.5874 × 0.1732 × 1.7321 x y2

y8/3 = 0.1 m
y = 0.0873/8 = 0.422 m (approximated to 0.45 m)

Cross-sectional area of drain (A) = 31/2 × y2 = 31/2 × 0.4222 = 0.308 m2
Depth of drain = 0.422 + 0.3 = 0.722 m (approximated to 0.75 m)
Bottom width of drain (b) = 2y/31/2 = 2 x 0.422/31/2 = 0.487 m (approximated to 0.5m)
Top width (T) = b + 2yz = 0.487 + (2 x 0.722 x 0.577) = 1.32 m (approximated to 1.35m)

Picture6 102455

Conclusion

The best hydraulic section of a roadside drain is characterized by the provision of maximum discharge with a given cross-sectional area. Other advantages than the hydraulic performance, for instance, for a given discharge rate, the best hydraulic section could guarantee the least cross-sectional area of the channel. Substantial savings could be made by reducing excavation and using fewer channel linings such as reinforced concrete.

Lastly, any roadside drain section selected should be large enough to permit the required discharge, as deep as required to provide a satisfactory outlet for both surface and subsurface drainage needs of the area served, and of a width-depth ratio and side slopes which will result in a stable channel which can be maintained in a satisfactory condition at a reasonable cost.

Reference(s)

King, H. W. and Brater, E. F. (1963). Handbook of Hydraulics, Fifth Edition. McGraw-Hill Book Company, Inc,, New York.

Cost Comparison of Solid and Ribbed Slabs

Cost is a major controlling factor in civil engineering construction projects. Different types of floor systems are adopted in reinforced concrete slab designs such as solid slabs, waffle slabs, ribbed slabs, flat slabs, etc. Each floor system has its advantages, applications, and cost implications in construction. This article aims to evaluate the cost comparison of solid and ribbed slabs.

The idea behind the adoption of the ribbed slab system is the need to reduce the volume of concrete in the tension zone of a concrete slab. Theoretically, the tensile strength of concrete is assumed to be zero during the structural design of flexural structural elements such as beams and slabs. By implication, all the tensile stresses from bending are assumed to be resisted by the reinforcements (see the stress block of flexural concrete sections in Figure 1).

stress block
Figure 1: Eurocode 2 concrete stress block

If concrete is assumed to do no work in the tension zone, it then makes economical sense to reduce the volume of concrete in that zone (bottom of the slab). To achieve this, beams of relatively shallow depths (ribs) are spaced at intervals to resist the flexural stresses due to the bending of the floor, with a thin topping (of about 50 mm). When this is done, a thick volume of concrete is no longer uniformly provided in the tensile zone of the concrete.

As the span of a floor increases, the thickness of the concrete and the quantity of reinforcements required to satisfy ultimate and serviceability limit state requirements also increase. However, by introducing ribbed slabs, longer spans can be economically spanned.

To reduce the cost and labour of constructing ribbed slabs, clay hollow pots, sandcrete blocks, or polystyrene are usually provided as infills between the ribs. While clay hollow pots and sandcrete blocks will improve the stiffness of the floor, the same, however, cannot be confidently said about polystyrenes.

7F6AEF68 146A 483E 83FB D44806FDE5E0
Figure 2: Use of polystyrene as infill in ribbed slab

There are significant cost implications of adopting either solid or ribbed slabs. In a study by Ajema and Abeyo (2018), they observed that frames with solid slabs are more economical than frames with a ribbed slab when subjected to seismic action. In another study by Nassar and Al-Qasem (2020) on the cost of different slab systems, they observed that the flat slab system reduces the total cost of construction by 7% compared to the solid slab system, 4 % compared to the one-way ribbed slab system, and 3.33% compared to the two-way ribbed slab system.

Mashri et al (2020) compared the cost of constructing solid slabs and hollow block ribbed slabs and concluded that ribbed slabs are cheaper than solid slabs. In a study on the assessment of the cost difference between solid and hollow floors, Dosumu and Adenuga (2013) observed that the cost of in-situ solid slabs are higher than that of hollow slab provided the hollow slab is a one-way hollow floor and not a waffle floor.

However, it is important to note that the scenario on the issue of cost can vary depending on the size and geometry of the slab. For short one-way slabs, solid slabs may be cheaper than ribbed slabs, while in large-span two-way slabs, ribbed slabs may be cheaper than solid slabs.

ribbed slab construction
Figure 3: Ribbed slab construction

With the aid of design examples and quantity estimation, let us compare the cost of constructing a two-way slab of dimensions 5.225m x 7.426m that is discontinuous at all edges using ribbed slab and solid slab. The slab is to support a live load of 2.5 kN/m2.

Design of Ribbed Slab

Reinforcement details
Characteristic yield strength of reinforcement;  fyk = 410 N/mm2
Partial factor for reinforcing steel – Table 2.1N; γS = 1.15
Design yield strength of reinforcement; fyd = fykS = 357 N/mm2

Concrete details
Concrete strength class; C25/30
Aggregate type;   Quartzite
Aggregate adjustment factor – cl.3.1.3(2); AAF = 1.0
Characteristic compressive cylinder strength;  fck = 25 N/mm2
Mean value of compressive cylinder strength;  fcm = fck + 8 N/mm2 = 33 N/mm2
Mean value of axial tensile strength; fctm = 0.3 N/mm2 × (fck)2/3 = 2.6 N/mm2
Secant modulus of elasticity of concrete;   Ecm = 22 kN/mm2 × (fcm/10)0.3 × AAF = 31476 N/mm2

ribbed slab
Figure 4: Typical ribbed slab panel

Design Information
Spacing of ribs = 450 mm
Topping = 50 mm
Rib width = 150 mm
Span = 5.225 m (simply supported)
Total depth of slab = 250 mm
Design live load qk = 2.5 kN/m2
Weight of finishes = 1.2 kN/m2
Partition allowance = 1.5 kN/m2

Load Analysis

Dead Load
Self-weight of topping = 24 × 0.05 × 0.45 = 0.54 kN/m
Self-weight of ribs = 24 × 0.15 × 0.2 = 0.72 kN/m
Weight of finishes = 1.2 × 0.45 = 0.54 kN/m
Partition allowance = 1.5 × 0.45 = 0.675 kN/m
Self-weight of heavy duty EPS = (0.156 × 0.2 × 0.45) = 0.014 kN/m
Total dead load per rib gk = 2.489 kN/m

Live Load
Characteristic live load = 2.5 kN/m2
Total live load per rib = 2.5 × 0.45 = 1.125 kN/m

At ultimate limit state;
PEd = 1.35gk + 1.5qk = 1.35(2.489) + 1.5(1.125) = 5.047 kN/m

Flexural Design
Design bending moment; MEd = 17.2 kNm
Effective flange width; beff = 2 × beff,1 + b = 450 mm
Effective depth of tension reinforcement; d = 209 mm
K = M / (beff × d2 × fck) = 0.035
K’ = 0.207
Lever arm;  z = 199 mm
Depth of neutral axis; x = 2 × (d – z) / l = 26 mm

lx <= hf – Compression block wholly within the depth of flange
K’ > K – No compression reinforcement is required

Area of tension reinforcement required; As,req = M / (fyd × z) = 243 mm2
Tension reinforcement provided; 2Y16 (As,prov = 402 mm2)
Minimum area of reinforcement – exp.9.1N; As,min = max(0.26 × fctm / fyk, 0.0013) × b × d = 51 mm2
Maximum area of reinforcement – cl.9.2.1.1(3); As,max = 0.04 × b × h = 1500 mm2
PASS – Area of reinforcement provided is greater than area of reinforcement required

Deflection control
Reference reinforcement ratio; ρm0 = (fck )0.5 / 1000 = 0.00500
Required tension reinforcement ratio;  ρm = As,req / (beff × d) = 0.00259
Required compression reinforcement ratio; ρ’m = As2,req / (beff × d) = 0.00000

Structural system factor – Table 7.4N;  Kb = 1.0
Basic allowable span to depth ratio ; span_to_depthbasic = Kb × [11 + 1.5 × (fck)0.5 × ρm0 / ρm + 3.2 × (fck)0.5 × (ρm0 / ρm – 1)1.5] = 39.900

Reinforcement factor – exp.7.17; Ks = min(As,prov / As,req × 500 N/mm2 / fyk, 1.5) = 1.500
Flange width factor; F1 = if(beff / b > 3, 0.8, 1) = 1.000
Long span supporting brittle partition factor; F2 = 1.000

Allowable span to depth ratio; span_to_depthallow = min(span_to_depthbasic × Ks × F1 × F2, 40 × Kb) = 40.000
Actual span to depth ratio; span_to_depthactual = Lm1_s1 / d = 25.000
PASS – Actual span to depth ratio is within the allowable limit

Shear Design
Angle of comp. shear strut for maximum shear; θmax = 45 deg
Strength reduction factor – cl.6.2.3(3);  v1 = 0.6 × (1 – fck / 250 N/mm2) = 0.540
Compression chord coefficient – cl.6.2.3(3); acw = 1.00
Minimum area of shear reinforcement – exp.9.5N;   Asv,min = 0.08 N/mm2 × b × (fck )0.5 / fyk = 146 mm2/m

Design shear force at support ; VEd,max = 13 kN
Min lever arm in shear zone;  z = 199 mm
Maximum design shear resistance – exp.6.9; VRd,max = acw × b × z × v1 × fcwd / (cot(θmax) + tan(θmax)) = 134 kN
PASS – Design shear force at support is less than maximum design shear resistance

Design shear force at 209 mm from support; VEd = 12 kN
Design shear stress;  vEd = VEd / (b × z) = 0.407 N/mm2

Area of shear reinforcement required – exp.6.8; Asv,des = vEd × b / (fyd × cot(θ)) = 69 mm2/m
Area of shear reinforcement required; Asv,req = max(Asv,min, Asv,des) = 146 mm2/m
Shear reinforcement provided;  2Y 8 legs @ 150 c/c
Area of shear reinforcement provided; Asv,prov = 670 mm2/m
PASS – Area of shear reinforcement provided exceeds minimum required

Maximum longitudinal spacing – exp.9.6N; svl,max = 0.75 × d = 157 mm
PASS – Longitudinal spacing of shear reinforcement provided is less than maximum

However, calculations have shown that shear reinforcements are not required since VEd (13 kN) is less than VRdc (25.2 kN). According to clause 6.2.1(4) of EN 1992-1-1:2004, when, on the basis of the design shear calculation, no shear reinforcement is required, minimum shear reinforcement should nevertheless be provided according to clause 9.2.2. The minimum shear reinforcement may be omitted in members such as slabs (solid, ribbed or hollow core slabs) where transverse redistribution of loads is possible.

Therefore to save cost, let us provide a triangular pattern link spaced at 300mm c/c, and 1Y12 (Asprov = 113 mm2) at the top of the rib.

RIB BEAM ELEVATION VIEW
Figure 5: Rib beam elevation view
RIB BEAM SECTION
Figure 6: Ribbed slab section

Design of Solid Slab

RC slab design

In accordance with EN1992-1-1:2004 incorporating corrigendum January 2008 and the UK national annex

solid slab
Figure 7: Solid slab panel

Slab definition                                                                                          
Type of slab;  Two way spanning with restrained edges
Overall slab depth;   h = 200 mm
Shorter effective span of panel; lx = 5225 mm
Longer effective span of panel;  ly = 7426 mm
Support conditions; Four edges discontinuous

Loading
Characteristic permanent action;  Gk = 6.5 kN/m2
Characteristic variable action; Qk = 2.5 kN/m2
Partial factor for permanent action; γG = 1.35
Partial factor for variable action;  γQ = 1.50
Quasi-permanent value of variable action;  ψ2 = 0.30
Design ultimate load;  q = γG × Gk + γQ × Qk = 12.5 kN/m2
Quasi-permanent load;  qSLS = 1.0 × Gk + ψ2 × Qk = 7.2 kN/m2

Concrete properties
Concrete strength class; C25/30
Characteristic cylinder strength;  fck = 25 N/mm2
Partial factor (Table 2.1N);  γC = 1.50
Compressive strength factor (cl. 3.1.6); acc = 0.85
Design compressive strength (cl. 3.1.6);  fcd = 14.2 N/mm2
Mean axial tensile strength (Table 3.1); fctm = 0.30 N/mm2 × (fck )2/3 = 2.6 N/mm2
Maximum aggregate size;   dg = 20 mm

Reinforcement properties
Characteristic yield strength; fyk = 410 N/mm2
Partial factor (Table 2.1N);  γS = 1.15
Design yield strength (fig. 3.8);fyd = fyk / γS = 356.5 N/mm2

Concrete cover to reinforcement
Nominal cover to outer bottom reinforcement;  cnom_b = 25 mm
Fire resistance period to bottom of slab; Rbtm = 60 min
Axial distance to bottom reinft (Table 5.8); afi_b = 10 mm
Min. btm cover requirement with regard to bond;  cmin,b_b = 12 mm
Reinforcement fabrication; Not subject to QA system
Cover allowance for deviation;  Dcdev = 10 mm
Min. required nominal cover to bottom reinft;  cnom_b_min = 22.0 mm
PASS – There is sufficient cover to the bottom reinforcement

Reinforcement design at midspan in short span direction (cl.6.1)

Bending moment coefficient; bsx_p = 0.0881
Design bending moment;  Mx_p = bsx_p × q × lx2 = 29.9 kNm/m
Reinforcement provided; 12 mm dia. bars at 200 mm centres
Area provided; Asx_p = 565 mm2/m
Effective depth to tension reinforcement; dx_p = h – cnom_b – fx_p / 2 = 169.0 mm

K factor; K = Mx_p / (b × dx_p2 × fck) = 0.042
Redistribution ratio;  δ = 1.0
K’ factor;  K’ = 0.598 × d – 0.18 × d2 – 0.21 = 0.208
K < K’ – Compression reinforcement is not required

Lever arm; z = min(0.95 × dx_p, dx_p/2 × (1 + √(1 – 3.53 × K))) = 160.5 mm
Area of reinforcement required for bending; Asx_p_m = Mx_p / (fyd × z) = 523 mm2/m
Minimum area of reinforcement required; Asx_p_min = max(0.26 × (fctm/fyk) × b × dx_p, 0.0013 × b × dx_p) = 275 mm2/m
Area of reinforcement required;  Asx_p_req = max(Asx_p_m, Asx_p_min) = 523 mm2/m

Check reinforcement spacing
Reinforcement service stress;  ssx_p = (fyk / gS) × min((Asx_p_m/Asx_p), 1.0) × qSLS / q = 190.7 N/mm2
Maximum allowable spacing (Table 7.3N); smax_x_p = 262 mm
Actual bar spacing;  sx_p = 200 mm
PASS – The reinforcement spacing is acceptable

Reinforcement design at midspan in long span direction (cl.6.1)
Bending moment coefficient; bsy_p = 0.0560
Design bending moment; My_p = bsy_p × q × lx2 = 19.0 kNm/m
Reinforcement provided; 12 mm dia. bars at 250 mm centres
Area provided; Asy_p = 452 mm2/m
Effective depth to tension reinforcement;  dy_p = h – cnom_b – fx_p – fy_p / 2 = 157.0 mm
K factor; K = My_p / (b × dy_p2 × fck) = 0.031
Redistribution ratio; d = 1.0
K’ factor;    K’ = 0.598 × d – 0.18 × d2 – 0.21 = 0.208
K < K’ – Compression reinforcement is not required

Lever arm; z = min(0.95 × dy_p, dy_p/2 × (1 + √(1 – 3.53 × K))) = 149.2 mm

Area of reinforcement required for bending; Asy_p_m = My_p / (fyd × z) = 358 mm2/m
Minimum area of reinforcement required;  Asy_p_min = max(0.26 × (fctm/fyk) × b × dy_p, 0.0013 × b × dy_p) = 255 mm2/m
Area of reinforcement required; Asy_p_req = max(Asy_p_m, Asy_p_min) = 358 mm2/m
PASS – Area of reinforcement provided exceeds area required

Check reinforcement spacing
Reinforcement service stress; ssy_p = (fyk / γS) × min((Asy_p_m/Asy_p), 1.0) × qSLS / q = 163.1 N/mm2
Maximum allowable spacing (Table 7.3N);  smax_y_p = 296 mm
Actual bar spacing;  sy_p = 250 mm
PASS – The reinforcement spacing is acceptable

Basic span-to-depth deflection ratio check (cl. 7.4.2)
Reference reinforcement ratio;  ρ0 = (fck)0.5 / 1000 = 0.0050
Required tension reinforcement ratio; ρ = max(0.0035, Asx_p_req / (b × dx_p)) = 0.0035
Required compression reinforcement ratio;  ρ’ = Ascx_p_req / (b × dx_p) = 0.0000
Structural system factor (Table 7.4N); Kd = 1.0

Basic limit span-to-depth ratio (Exp. 7.16);                                     
ratiolim_x_bas = Kd × [11 +1.5 × (fck)0.5 × ρ0/ρ + 3.2 × (fck)0.5 × (ρ0/ρ -1)1.5] = 26.20

Mod span-to-depth ratio limit;   
ratiolim_x = min(40 × Kd, min(1.5, (500 N/mm2/ fyk) × (Asx_p / Asx_p_m)) × ratiolim_x_bas) = 34.54
Actual span-to-eff. depth ratio; ratioact_x = lx / dx_p = 30.92
PASS – Actual span-to-effective depth ratio is acceptable

Reinforcement summary
Midspan in short span direction;  12 mm dia. bars at 200 mm centres B1
Midspan in long span direction; 12 mm dia. bars at 250 mm centres B2
Discontinuous support in short span direction; 12 mm dia. bars at 200 mm centres B1
Discontinuous support in long span direction; 12 mm dia. bars at 250 mm centres B2

solid slab reinforcement detailing
Figure 8: Solid slab reinforcement detailing (plan)
SOLID SLAB SECTION
Figure 9: Solid slab section

Cost Comparison of Solid and Ribbed Slabs

In this section, we are going to consider the cost of constructing ribbed slab and the cost of constructing solid slabs (considering the cost of materials only). In this case, the cost of labour is assumed to be directly proportional to the quantity of materials.

Cost analysis of solid slab

Concrete
Volume of concrete required for the slab = 5.45 × 7.65 × 0.2 = 8.3385 m3
Current unit cost of concrete materials = ₦55,000/m3
Cost of concrete materials = 8.3385 × 55000 = ₦ 458,618

Quantity of steel required
Bar mark 1 = 37 × 7.645 × 0.888 = 251.184 kg
Bar mark 2 = 21 × 10.485 × 0.888 = 195.524 kg
Bar mark 3 = 12 × 4.225× 0.617 = 31.28 kg
Bar mark 3 = 8 × 6.625 × 0.617 = 32.701kg
Total = 510.689 kg

Unit cost of reinforcement = ₦ 450/kg
Cost of reinforcement = 510.689 × 450 = ₦ 229,810

Formwork Required
Soffit of slab = 36 m2 (treated as a constant)

Cost of constructing solid slab = ₦ 229,810 + ₦ 458,618 = ₦ 688,428

Cost Analysis of Ribbed Slab

Concrete
Volume of concrete required for the topping = 5.45 × 7.65 × 0.05 = 2.084 m3
Volume of concrete required for the ribs = 12 × 0.2 × 0.15 × 5 = 1.8 m3
Total volume of concrete = 3.884 m3
Cost of concrete materials = 3.884 × 55,000 = ₦ 213,620

Quantity of steel required
Bar mark 1 = 2 × 12 × 5.7 × 1.579 = 216 kg
Bar mark 2 = 1 × 12 × 5.8 × 0.888 = 61.8 kg
Bar mark 3 (triangular links) = 17 × 12 × 0.612 × 0.395 = 49.314 kg
Total = 327.114 kg
Cost of reinforcement = 327.114 × 450 = ₦ 147,205

BRC Mesh for Topping (A142) – 41.7 m2
Unit cost of BRC mesh = ₦ 1580/m2
Cost of BRC mesh = 41.7 × 1580 = ₦ 65,886

Total cost of reinforcement works = 147,205 + 65,886 = ₦ 213,620

Clay hollow pot/Sandcrete Blocks/Polystyrene
Number of block units required = 240 units
Unit price of hollow blocks = NGN 400 per unit
Cost of hollow blocks = 240 × 400 = ₦ 96,000

Formwork Required
Soffit of slab = 36 m2 (treated as a constant)

Cost of constructing ribbed slab = ₦ 213,620 + ₦ 213,091 + ₦ 96,000 = ₦ 522,711

The Table for comparison is shown below;

MaterialSolid SlabRibbed SlabPercentage Reduction
Concrete₦ 458,618₦ 213,62053.42%
Reinforcement₦ 229,810₦ 213,6207.04%
Hollow Pots/Blocks₦ 96,000
Total₦ 688,428₦ 522,71124.07%

Conclusion

From the analysis of the two-way slab carried out, it can be seen that the volume of concrete required for a ribbed slab is 53.42% less than that required for a solid slab. Furthermore, the reinforcement required in the ribbed slab is 7.04% less than that required for a solid slab. If the same type of formwork is adopted (completely flat soffit supported with props), and if the cost of labour is directly related to the quantity of materials, then the adoption of the ribbed slab is expected to save cost by about 24.07% compared to solid slab.

References

[1] Ajema D. and Abeyo A. (2018): Cost Comparison between Frames with Solid Slab and Ribbed Slab using HCB under Seismic Loading. International Research Journal of Engineering and Technology 05(01):109-116
[2] Dosumu O. S. and Adenuga O. A.(2013): Assessment of Cost Variation in Solid and Hollow Floor Construction in Lagos State. Journal of Design and Built Environment 13(1):1-11
[3] Mashri M., Al-Ghosni K., Abdulrahman A., Ismaeil M., Abdussalam A. and Elbasir O. M. M. (2020):Design and cost comparison of the Solid Slabs and Hollow Block Slabs. GSJ 8(1):110-118 www.globalscientificjournal.com
[4] Reema R. Nassar 1, Imad A. Al-Qasem 2 (2020): Comparative Cost Study for A residential Building Using Different Types of Floor System. International Journal of Engineering Research and Technology 13(8): 1983-1991