8.7 C
New York
Sunday, June 15, 2025
Home Blog Page 26

Design of Steel Columns for Biaxial Bending | Eurocode 3

When a column section is subjected to bending moment in the two axes in addition to a compressive axial force, the column is said to be biaxially loaded. The design of steel columns for biaxial bending involves the verification of the steel section’s capacity in bending, shear, compression, flexural buckling, and interaction of all these forces. Interaction formulas are available in EN 1993-1-1:2005 (Eurocode 3) for the design of members that are biaxially loaded.

Clause 6.2.9 of EN 1993-1-1:2005 describes the design of cross-sections subjected to combined bending and axial force (such as steel columns). Bending can occur along one or both major axes, with tensile or compressive axial forces (with no difference in treatment). Eurocode 3 provides several approaches for designing Class 1 and 2, Class 3, and Class 4 cross-sections in order to deal with the combined effects.

A basic linear interaction presented below and in equation (1) can be applied to all cross-sections (clause 6.2.1(7)). Although Class 4 cross-section resistances must be based on effective section properties. Furthermore, any additional moments arising from the resulting shift in neutral axis should be allowed for in class 4 sections. These extra moments necessitate the use of the expanded linear interaction expression.

NEd/NRd + My;Ed/My;Rd + Mz;Ed/Mz;Rd ≤ 1.0 ———— (1)

where NRd, My,Rd, and Mz,Rd are the design cross-sectional resistances, and any required reduction due to shear effects should be included (clause 6.2.8). The goal of equation (1) is to allow a designer to obtain a quick, approximate, and safe solution, possibly for initial member sizing, with the option to refine the calculations for final design.

Bi-axial bending with or without axial force (Class 1 and 2 sections)

EN 1993-1-1, like BS 5950: Part 1, treats bi-axial bending as a subset of the combined bending and axial force regulations. Clause 6.2.9.1 specifies the checks for Class 1 and 2 cross-sections subjected to bi-axial bending with or without axial forces (6). Although equation (1) shows a simple linear interaction expression, equation (2) represents a more sophisticated convex interaction expression that can result in large efficiency gains:

(My;Ed/MN;y;Rd)α + (Mz;Ed /MN;z;Rd)β ≤ 1.0 ———- (2)

in which α and β are constants, as defined below. Clause 6.2.9(6) allows α and β to be taken as unity, thus reverting to a conservative linear interaction.

For I- and H-sections:
α = 2 and β = 5n but β ≤ 1.0

For circular hollow sections:
α = 2 and β = 1

Rectangular hollow sections
α = β = 1.66/(1 – 1.13n2) but α = β ≤ 6.0

n = NEd / Nc,Rd

Worked Example

Verify the capacity of a 3500 mm tall column of UKC 254x254x89 in a commercial complex to withstand the following ultimate limit state actions;
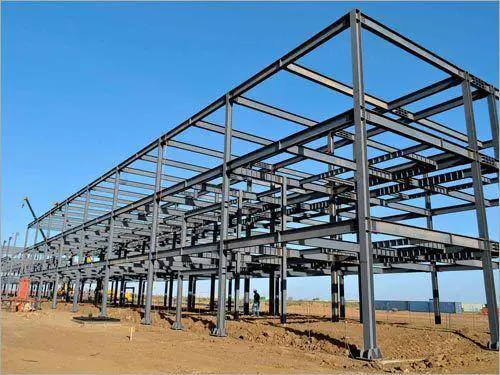
Design of Steel Columns for Biaxial Bending

Axial load; NEd = 1500 kN; (Compression)
Major axis moment at end 1 – Bottom; My,Ed1 = 89.0 kNm
Major axis moment at end 2 – Top; My,Ed2 = 77.0 kNm
Minor axis moment at end 1 – Bottom; Mz,Ed1 = 7.9 kNm
Minor axis moment at end 2 – Top; Mz,Ed2 = 2.4 kNm
Major axis shear force; Vy,Ed = 56 kN
Minor axis shear force;Vz,Ed = 14 kN

Solution

Partial factors
Resistance of cross-sections; γM0 = 1
Resistance of members to instability; γM1 = 1
Resistance of cross-sections in tension to fracture;  γM2 = 1.1

Column details
Column section; UKC 254x254x89
Steel grade; S275
Yield strength; fy = 265 N/mm2
Ultimate strength;  fu = 410 N/mm2
Modulus of elasticity;  E = 210 kN/mm2
Poisson’s ratio;  υ = 0.3
Shear modulus; G = E / [2 × (1 + υ)] = 80.8 kN/mm2

Column geometry
System length for buckling – Major axis; Ly = 3500 mm
System length for buckling – Minor axis; Lz = 3500 mm

The column is part of a sway frame in the direction of the minor axis
The column is part of a sway frame in the direction of the major axis

Column loading
Axial load; NEd = 1500 kN; (Compression)
Major axis moment at end 1 – Bottom; My,Ed1 = 89.0 kNm
Major axis moment at end 2 – Top; My,Ed2 = 77.0 kNm

Minor axis moment at end 1 – Bottom; Mz,Ed1 = 7.9 kNm
Minor axis moment at end 2 – Top; Mz,Ed2 = 2.4 kNm
Major axis shear force; Vy,Ed = 56 kN
Minor axis shear force;Vz,Ed = 14 kN

Buckling length for flexural buckling – Major axis
End restraint factor; Ky = 1.000
Buckling length; Lcr_y = Ly × Ky = 3500 mm

Buckling length for flexural buckling – Minor axis
End restraint factor;  Kz = 1.000
Buckling length;  Lcr_z = Lz × Kz = 3500 mm

Web section classification (Table 5.2)
fy = 265 N/mm2
Coefficient depending on fy; ε = √(235/ fy) = 0.942
Depth between fillets; cw = h – 2 × (tf + r) = 200.3 mm
Ratio of c/t;  ratiow = cw / tw = 19.45
Length of web taken by axial load; lw = min(NEd / (fy × tw), cw) = 200.3 mm
For class 1 & 2 proportion in compression; α = (cw/2 + lw/2) / cw = 1.000

Limit for class 1 web;                                                     
Limit1w = (396 × e) / (13 × a – 1) = 31.08
The web is class 1

Flange section classification (Table 5.2)
Outstand length; cf = (b – tw) / 2 – r = 110.3; mm
Ratio of c/t; ratiof = cf / tf = 6.38

Conservatively assume uniform compression in flange

Limit for class 1 flange; Limit1f = 9 × e = 8.48
Limit for class 2 flange; Limit2f = 10 × e = 9.42
Limit for class 3 flange; Limit3f = 14 × e = 13.18

The section is class 1

Resistance of cross section (cl. 6.2)

Shear – Major axis (cl. 6.2.6)
Design shear force; Vy,Ed = 56.0 kN
Shear area; Avy = max((h – 2tf) × tw, A – 2 × b × tf + (tw + 2 × r) × tf) = 3081 mm2
fy = 265 N/mm2
Plastic shear resistance;  Vpl,y,Rd = Avy × (fy/√3)/ γM0 = 471.4 kN
Vy,Ed / Vpl,y,Rd = 0.119
PASS – Shear resistance exceeds the design shear force

Vy,Ed ≤ 0.5×Vpl,y,Rd – No reduction in fy required for bending/axial force

Shear – Minor axis (cl. 6.2.6)
Design shear force; Vz,Ed = 13.5 kN
Shear area; Avz = 2 × b × tf – (tw + 2 × r) × tf = 8250 mm2
Plastic shear resistance; Vpl,z,Rd = Avz × (fy /√3) / γM0 = 1262.3 kN
Vz,Ed / Vpl,z,Rd = 0.011
PASS – Shear resistance exceeds the design shear force
Vz,Ed ≤ 0.5×Vpl,z,Rd – No reduction in fy required for bending/axial force

Compression (cl. 6.2.4)
Design force; NEd = 1500 kN
Design resistance; Nc,Rd = Npl,Rd = A × fy / γM0 = 3003 kN
NEd / Nc,Rd = 0.5
PASS – The compression design resistance exceeds the design force

Bending – Major axis (cl. 6.2.5)
Design bending moment;  My,Ed = max(abs(My,Ed1), abs(My,Ed2)) = 89.0 kNm
Section modulus;  Wy = Wpl.y = 1223.9; cm3
Design resistance; Mc,y,Rd = Wy × fy / γM0 = 324.3 kNm
My,Ed / Mc,y,Rd = 0.274
PASS – The bending design resistance exceeds the design moment

Bending – Major axis(cl. 6.2.5)
Design bending moment; Mz,Ed = max(abs(Mz,Ed1), abs(Mz,Ed2)) = 7.9 kNm
Section modulus; Wz = Wpl.z = 575.3; cm3
Design resistance; Mc,z,Rd = Wz × fy / γM0 = 152.5 kNm
Mz,Ed / Mc,z,Rd = 0.052
PASS – The bending design resistance exceeds the design moment

Combined bending and axial force (cl. 6.2.9)
fy = 265 N/mm2;
Npl,Rd = A × fy / γM0 = 3003 kN
Ratio design axial to design plastic resistance; n = abs(NEd) / Npl,Rd = 0.500
Ratio web area to gross area; a = min(0.5, (A – 2 × b × tf) / A) = 0.217

Bending – Major axis (cl. 6.2.9.1)
Design bending moment; My,Ed = max(abs(My,Ed1), abs(My,Ed2)) = 89.0 kNm
Plastic design resistance; Mpl,y,Rd = Wpl.y × fy / γM0 = 324.3 kNm
Modified design resistance; MN,y,Rd = Mpl,y,Rd × min(1, (1 – n) / (1 – 0.5 × a)) = 182.1 kNm
My,Ed / MN,y,Rd = 0.489
PASS – Bending resistance in presence of axial load exceeds the design moment

Bending – Minor axis (cl. 6.2.9.1)
Design bending moment;Mz,Ed = max(abs(Mz,Ed1), abs(Mz,Ed2)) = 7.9 kNm
Plastic design resistance;  Mpl,z,Rd = Wpl.z × fy / γM0 = 152.5 kNm
Modified design resistance;MN,z,Rd = Mpl,z,Rd × [1 – ((n – a) / (1 – a))2] = 132.6; kNm
Mz,Ed / MN,z,Rd = 0.059
PASS – Bending resistance in presence of axial load exceeds the design moment

Biaxial bending
Exponent α; α = 2.00
Exponent β;  β = max(1, 5 × n) = 2.50

Section utilisation at end 1; URCS_1 = [abs(My,Ed1) / MN,y,Rd] α + [abs(Mz,Ed1) / MN,z,Rd] β = 0.240
Section utilisation at end 2; URCS_2 = [abs(My,Ed2) / MN,y,Rd] α + [abs(Mz,Ed2) / MN,z,Rd] β = 0.179
PASS – The cross-section resistance is adequate

Buckling resistance (cl. 6.3)
Yield strength for buckling resistance;  fy = 265 N/mm2

Flexural buckling – Major axis
Elastic critical buckling force; Ncr,y = π2 × E × Iy / Lcr_y2 = 24140 kN
Non-dimensional slenderness; λy = √(A × fy / Ncr,y) = 0.353
Buckling curve (Table 6.2);  b
Imperfection factor (Table 6.1); αy = 0.34
Parameter Φ;  Φy = 0.5 × [1 + αy × (λy – 0.2) + λy2] = 0.588
Reduction factor;  χy = min(1.0, 1 / [Φy + √(Φy 2 – λy2)]) = 0.944
Design buckling resistance; Nb,y,Rd = χy × A × fy  / γM1 = 2835.9 kN
NEd / Nb,y,Rd = 0.529
PASS – The flexural buckling resistance exceeds the design axial load

Flexural buckling – Minor axis
Elastic critical buckling force; Ncr,z = π2 × E × Iz / Lcr_z2 = 8219 kN
Non-dimensional slenderness; λz = √(A × fy / Ncr,z) = 0.604
Buckling curve (Table 6.2);  c
Imperfection factor (Table 6.1); αz = 0.49
Parameter Φ; Φz = 0.5 × [1 + αz × (λz – 0.2) + λz2] = 0.782
Reduction factor; χz = min(1.0, 1 / [Φz + √(Φz2 – λz2)]) = 0.783
Design buckling resistance; Nb,z,Rd = χz × A × fy  / γM1 = 2350.4 kN
NEd / Nb,z,Rd = 0.638
PASS – The flexural buckling resistance exceeds the design axial load

Torsional and torsional-flexural buckling (cl. 6.3.1.4)

Torsional buckling length factor; KT = 1.00
Effective buckling length; Lcr_T = KT × max(Ly, Lz) = 3500 mm
Distance from shear ctr to centroid along major axis;  y0 = 0.0 mm
z0 = 0 mm
Distance from shear ctr to centroid along minor axis; z0 = 0.0 mm

i0 = √(iy2 + iz2 + y02 + z02) = 129.9 mm
bT = 1 – (y0 / i0)2 = 1.000

Elastic critical torsional buckling force; Ncr,T = 1 / i02 × (G × It + π2 × E × Iw / Lcr_T2) = 12085 kN
Elastic critical torsional-flexural buckling force; Ncr,TF = Ncr,y/(2 × bT) × [1 + Ncr,T/Ncr,y – √[(1 – Ncr,T/Ncr,y)2 + 4 × (y0/i0)2 × Ncr,T/Ncr,y]]
Ncr,TF = 12085 kN

Non-dimensional slenderness; λT = √(A × fy / min(Ncr,T, Ncr,TF)) = 0.498
Buckling curve (Table 6.2); c
Imperfection factor (Table 6.1); αT = 0.49
Parameter Φ; ΦT = 0.5 × [1 + αT × (λT – 0.2) + λT2] = 0.697
Reduction factor; χT = min(1.0, 1 / [ΦT + √(ΦT 2 – λT2)]) = 0.844
Design buckling resistance; Nb,T,Rd = χT × A × fy  / γM1 = 2533.9 kN
NEd / Nb,T,Rd = 0.592
PASS – The torsional/torsional-flexural buckling resistance exceeds the design axial load

Minimum buckling resistance
Minimum buckling resistance; Nb,Rd = min(Nb,y,Rd, Nb,z,Rd, Nb,T,Rd) = 2350.4 kN
NEd / Nb,Rd = 0.638
PASS – The axial load buckling resistance exceeds the design axial load

Buckling resistance moment (cl.6.3.2.1)
Lateral torsional buckling length factor;  KLT = 1.00
Effective buckling length; Lcr_LT = KLT × Lz = 3500 mm
End moment factor; y = My,Ed2 / My,Ed1 = 0.865
Moment distribution correction factor (Table 6.6);  kc = 1 / (1.33 – 0.33 × y) = 0.957
C1 = 1 / kc2 = 1.091
Curvature factor;  g = √[1 – (Iz / Iy)] = 0.812
Poissons ratio;  υ = 0.3
Shear modulus;  G = E / [2 × (1 + υ)] = 80769 N/mm2

Elastic critical buckling moment; Mcr = C1 × π2 × E × Iz × √[Iw / Iz + Lcr_LT2 × G × It /(π2 × E × Iz)]/(Lcr_LT2 × g)
Mcr = 1739.3 kNm

Slenderness ratio for lateral torsional buckling; λLT = √[Wy × fy / Mcr] = 0.432
Limiting slenderness ratio; λLT,0 = 0.40
Correction factor for rolled sections; βr = 0.75
Buckling curve (Table 6.5); b
Imperfection factor (Table 6.1); αLT = 0.34

Parameter ΦLT;   ΦLT = 0.5 × [1 + αLT × (λLT – λLT,0) + βr × λLT2] = 0.575
Reduction factor; χLT = min(1.0, 1/λLT2, 1 / [ΦLT + √(ΦLT2 – βr × λLT2)]) = 0.988
Modification factor;   f = min(1 – 0.5 × (1 – kc) × [1 – 2 × (λLT – 0.8)2], 1) = 0.984
Modified LTB reduction factor – eq 6.58; χLT,mod = min(χLT / f, 1, 1/λLT2) = 1.000

Design buckling resistance moment; Mb,Rd = χLT,mod × Wy × fy / γM1 = 324.3 kNm
Design bending moment; My,Ed = max(abs(My,Ed1), abs(My,Ed2)) = 89.0 kNm
My,Ed / Mb,Rd = 0.274
PASS – The design buckling resistance moment exceeds the maximum design moment

Combined bending and axial compression (cl. 6.3.3)
Characteristic resistance to normal force;  NRk = A × fy = 3003 kN
Characteristic moment resistance – Major axis; My,Rk = Wpl.y × fy = 324.3 kNm
Characteristic moment resistance – Minor axis; Mz,Rk = Wpl.z × fy = 152.5 kNm

Moment factor – Major axis; Cmy = 0.9
Moment factor – Minor axis; Cmz = 0.9

Moment distribution factor for LTB;  yLT = My,Ed2 / My,Ed1 = 0.865
Moment factor for LTB;  CmLT = max(0.4, 0.6 + 0.4 × yLT) = 0.946

Interaction factor kyy; kyy = Cmy × [1 + min(0.8, λy – 0.2) × NEd / (χy × NRk / γM1)] = 0.973
Interaction factor kzy;  kzy = 1 – min(0.1, 0.1 × λz) × NEd / ((CmLT – 0.25) × (χz × NRkM1)) = 0.945
Interaction factor kzz; kzz = Cmz × [1 + min(1.4, 2 × λz – 0.6) × NEd / (χz × NRk / γM1)] = 1.250
Interaction factor kyz; kyz =  0.6 × kzz = 0.750

Section utilisation;                       
URB_1 = NEd / (χy × NRk / γM1) + kyy × My,Ed / (χLT × My,Rk / γM1) + kyz × Mz,Ed / (Mz,Rk / γM1)
URB_1 = 0.838

URB_2 = NEd / (χz × NRk / γM1) + kzy × My,Ed / (χLT × My,Rk / γM1) + kzz × Mz,Ed / (Mz,Rk / γM1)
URB_2 = 0.965

PASS – The buckling resistance is adequate

Alternatives to the Construction of Foundation of Duplexes on Good Soil

Simple duplex buildings that are founded on soil with an allowable bearing capacity of 100 kN/m2 and above can be safely and economically supported on pad foundations. This article is aimed at proposing an alternative to the method of construction of foundations of duplexes on good soil (say, safe bearing capacity of 100 kN/m2 and above) in Nigeria.

In Nigeria, the most popular approach to the construction of the foundation of duplexes is the combination of pad foundation and strip foundation. Pad foundations are used to support the columns of the building, while the strip foundation is used to support the block wall (sandcrete masonry units).

step down of column base
Fig 1: Combination of a pad and strip foundation for a duplex

Typically, the size of a pad foundation depends on the expected service load coming from the column, the safe bearing capacity of the soil, and the allowable settlement (whichever governs the design). The thickness of the foundation and the reinforcements required is determined from ultimate limit state considerations such as bending, one-way shear, and punching shear.

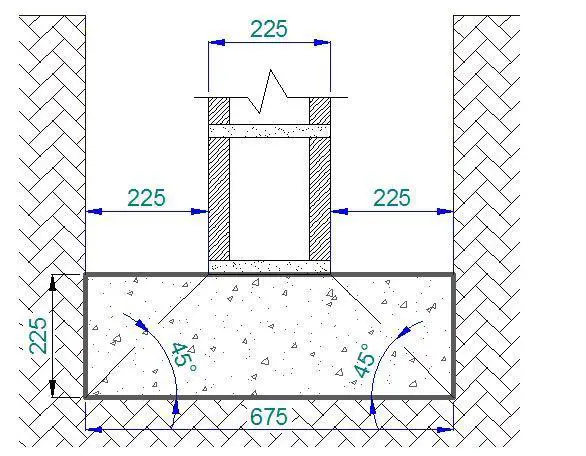
On the other hand, the width of strip footings in the foundation of duplexes is usually kept between 675mm – 700 mm. The thickness of the concrete ranges from 150 mm to 225 mm if 9 inches hollow blocks are used. When the depth of the water table is very low below the surface, the depth of the foundation is usually kept between 900 mm and 1200 mm.

Since the strips are usually unreinforced, the recommended thickness of the strip foundation for 9 inches blocks (225 mm blocks) is about 225 mm, such that the pressure dispersal (at 45 degrees) will hit the edges of the foundation without introducing any punching shear (see Figure 2). This recommended option can be economically challenging during the construction of strips for duplexes and the advice of a structural engineer should be sought before a decision is taken.

Unreinforced strip footing construction
Fig 2: Schematics of a strip foundation for a duplex

During the structural design of residential duplexes, it is usually assumed that masonry units (block walls) do not carry any load (framed structure) even though sometimes construction methodology may suggest otherwise. Therefore at the foundation, we expect the strip footing to carry at most the self-weight of the ground floor wall and finishes, which is usually about 10.5 kN/m for a 3m high wall. The ground floor slab load may be transmitted to the strip foundation too.

Generically, the total load transmitted to the strip footing depends on the structural scheme and the construction methodology. For instance, some designers/builders prefer to chain foundations at the damp-proof course (DPC) level. In this case, the entire block wall load of the ground floor is not expected to be transmitted to the strip foundation, but to the columns through the plinth beams.

The Conventional Process of Constructing the Foundation of Duplexes in Nigeria

(a) Setting out
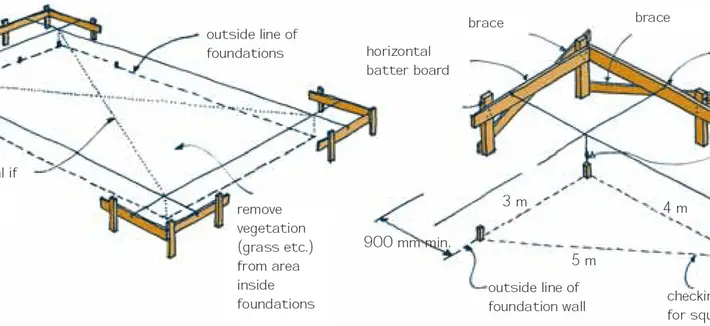
When it has been determined that pad foundations can be used to support a duplex in an area of low water table, the first step in the construction of the foundation is the ‘setting out’. For a regular duplex building, setting out can be achieved using wooden pegs and 2″ x 3″ softwood as the profile board (See Figure 3).

setting out
Fig 3: Typical setting out of a building using the 3-4-5 rule

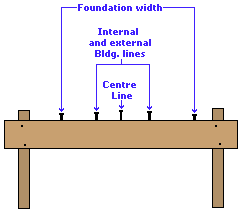
Using the 3-4-5 method, builders’ square, and lines, the building can be set out accurately. Where available, total stations and laser setting out/levelling equipment can be used to make the job faster. The width of excavation, building lines, and wall centrelines are all established on the profile board using nails as shown in Figure 4.

foundation marker
Fig 4: Typical markings on a profile board

It is important to keep the profile board in place until the ground floor slab is cast. Furthermore, it can also be helpful to transfer reference levels and at least two coordinates (building lines/axes in both directions) to a permanent place peradventure you will need them later after the removal of the profile board.

(b) Excavation
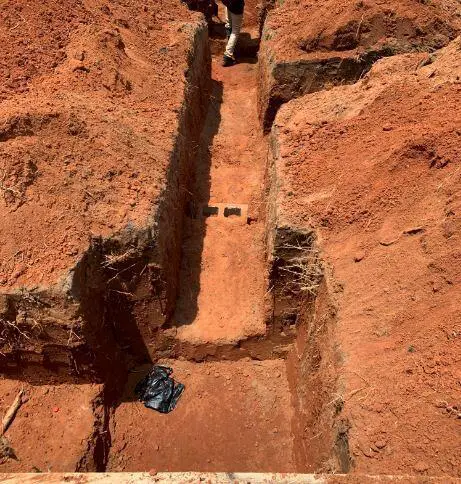
After setting out the building, the next step is to commence excavation. The width of excavation is transferred from the profile board, while the depth of the foundation is determined from the design drawings. Using the reference level, the depth of the foundation is established by the site engineer. If the ground is sloping, the foundation can be stepped with the approval of the design engineer.

It may be possible to excavate the column bases first before the strip or vice versa. But in each case, some portion of the excavated soil must be moved away in order to accommodate the other. From experience, it may be handier to excavate the strips first before excavating the column bases.

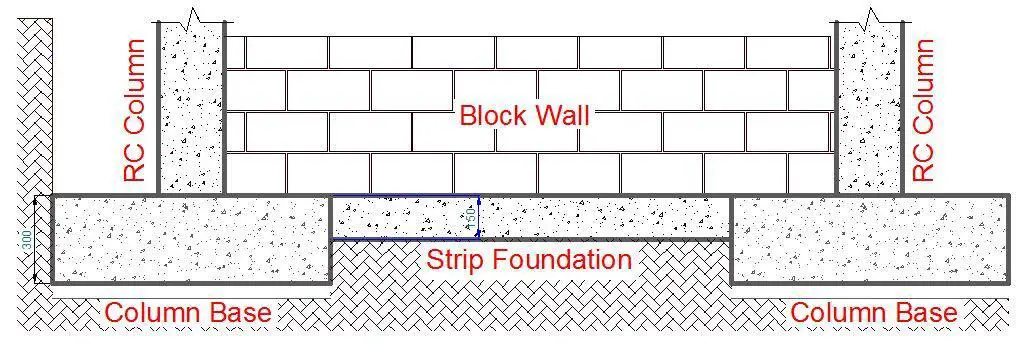
In order to have a flat surface for laying blocks, the column bases may have to go deeper than the strips. For instance, if the column base is 300 mm thick, and the strip 150 mm thick, the column base may be stepped down by 200 mm (an additional 50 mm for the blinding) so that when it is cast, it will flush with the level of the strip as shown in Figure 5. For the foundation layout being considered, the excavation works should cost about ₦130,400 using manual labour.

Strip foundation and column base
Fig 5: Schematics of pad and strip foundation construction

(c) Leveling and Compaction of the Excavated Trenches
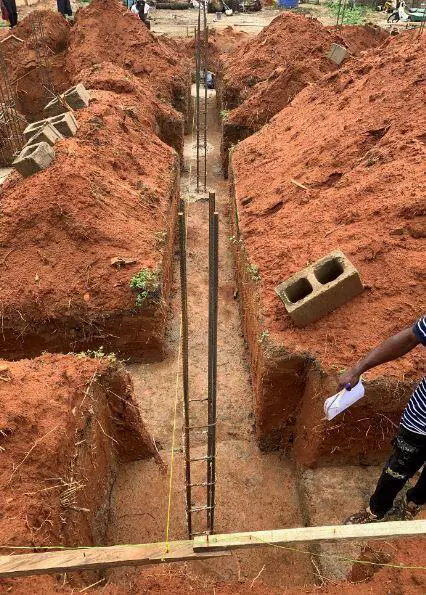
After the excavation of the trenches, the foundation base should be properly compacted and levelled to receive concrete. The levelling should ensure that the thickness of the concrete is the same wherever required. Wooden pegs or short reinforcement offcuts can be used to establish the required levels. Range and spirit level or laser can be used to transfer the levels from one point to another. For shallow foundations in lateritic or cohesive soils, the excavation should be able to stand on its own without caving in within the 900 – 1200 mm depth. If the foundation is founded on sand, side supports for the excavation will be required.

(d) Blinding
The column base should be blinded using concrete of the same strength as the foundation. The thickness of the blinding should be about 50 mm thick and should be properly consolidated.

(e) Reinforcement Works
The column base reinforcements and the starter bars should be prepared according to the structural drawing. Using the profile board and lines, the starter bars should be mounted in their correct position to avoid cranking of reinforcement later. The site engineer should ensure that the column starter bars are plumb and properly braced to prevent movement during concreting.

typical alignment of columns in duplex construction
Fig 6: Typical alignment of columns in duplex construction

The design engineer and the consulting architect should sign off the placement of the reinforcements after the iron benders are done. While the architect should check setting out and positioning, the structural engineer should check out the following;

(1) The blinding was properly done
(2) The correct bar size, yield strength, and spacing were used for the reinforcements. The Consulting Engineer should request the reinforcement tensile strength test result.
(3) Adequate concrete cover (50 mm) has been provided under the column base reinforcement, away from the blinding.
(4) The column starter bars are centrally positioned on the basket (or according to the drawings) to avoid eccentric loading on the foundation.
(5) The foundation has been pegged and excavated such that the thickness of the concrete when poured will meet the design specifications.

If the reinforcement placement is found satisfactory, approval should be given for concreting.

(f) Concreting
The strip foundation and the column bases should be poured to the specified thickness using the recommended concrete grade. The concrete should be properly vibrated to ensure that minimal voids exist in the concrete mass. An experienced mason should dress the surface and ensure that the established casting levels are properly followed.

(g) Blockwork
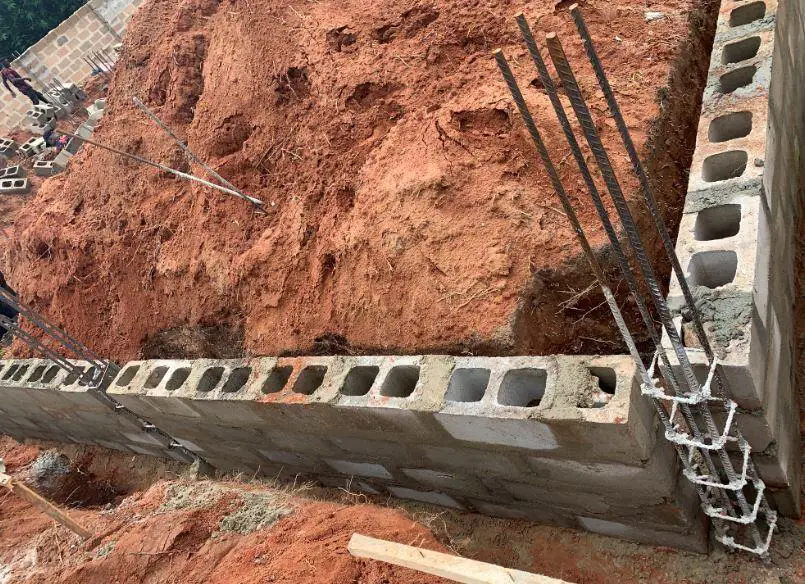
After the concreting, the blockwork should be done according to the drawings from the foundation up to the DPC level. The site engineer should ensure that the edges of the block adjacent to the column maintain a concrete cover of about 35 mm. Furthermore, the size of the column obtained should be consistent with the design specifications, since the blocks act as part of the permanent formwork for the column. The edges of the block close to the column should be perfectly aligned and plumb. Some engineers recommend filling the hollow sandcrete blocks with weak concrete.

block work in a foundation
Fig 7: Typical blockwork in the foundation of a duplex

(h) Casting of the column stubs
After the blockwork is complete, the column stubs should be cast. Before this is done, it is important to clean up all the soil that must have entered the base of the column preferably using a high-pressure water jet. This must be done before the carpenter places the formwork. The formwork for the column stubs must be properly braced to avoid bursting during the concrete pouring. The recommended concrete mix should be used, and be properly vibrated to avoid honeycombs.

(i) Backfilling and Compaction
The foundation is usually backfilled using the material excavated from the foundation. To make up level up to the DPC, high-quality lateritic materials or sand should be imported, placed, and compacted up to the required level. The earth material to be used should be non-expansive or problematic. After this process, the damp proof membrane should be installed, and hardcore/BRC wire mesh installed as recommended in the design specification.

(j) Casting of the ground-floor slab
Carpenters should prepare the edge formwork of the building and ensure that it is perfectly level. Levels should also be established internally so that the final surface of the ground floor slab will be flat. After this, the ground floor concrete is poured and finished as appropriate.

The casting of the ground-floor slab process completes the substructure works.

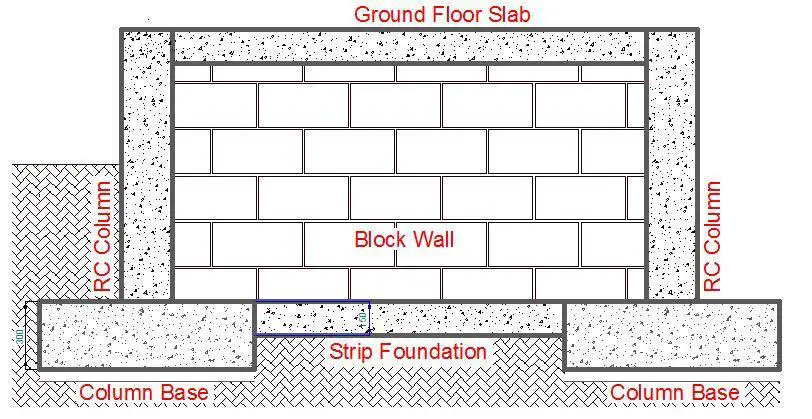
We can see that the process can be quite lengthy, and normally takes about one week to complete if there are no unnecessary delays and if an adequate workforce is used. A schematic representation of the final output is shown in Figure 8.
Conventional Duplex Foundation Construction Schematics
Fig 8: Schematics of complete substructure works in a building using strip foundation

Alternative Approach to Duplex Foundation Construction

If we theoretically assume that block walls do not carry any load, why do we go through the lengthy process of excavating the strips, casting the strip, and forming block walls from the foundation up to the DPC level? The new approach to be recommended in this section intends to boycott this process and probably save cost, and make the construction process faster. This approach may already be in practice somewhere else. The new approach is outlined below;

(1) Setting out
The setting out process is the same as outlined above, but the excavation lines for the width of the strip may be omitted.

(2) Excavation and blinding
At this stage, only the column bases will be excavated to the required depth, and the concrete for blinding poured as technically specified.

(3) Reinforcement Works
The reinforcement works for the column base and column starter bars should be prepared and installed as described in the approach above.

(4) Casting of the column base and stubs
The column base concrete should be poured first and the following day, 75mm thick kickers that depicts the dimensions and orientation of the columns should be formed. The column stub formwork should be installed and properly braced before the concreting of the column stub is done. The height of the column should be up to the grade level or as technically recommended.

(5) Casting of plinth beams
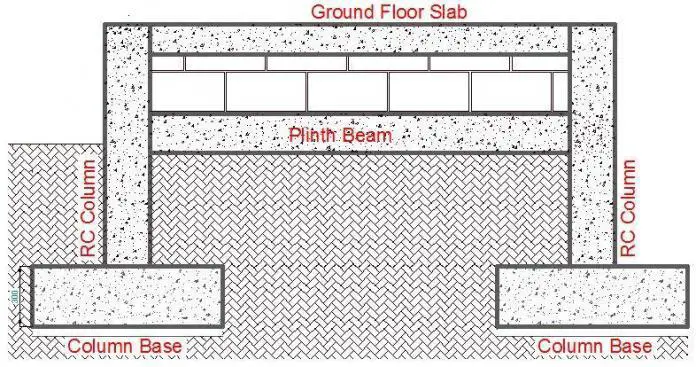
Reinforced concrete plinth beams should be cast near the ground level surface to receive the block walls that will go up to the required ground floor level. The ground to receive the plinth beams should be well prepared, levelled, and made firm to receive the blinding before the beam is cast. The plinth beams should run from column to column and to areas where blockwork is expected. The width of the beam should be the same width as the block to be used or larger. The depth can be determined by the structural engineer but is not expected to exceed 300 mm.

(6) Blockwork
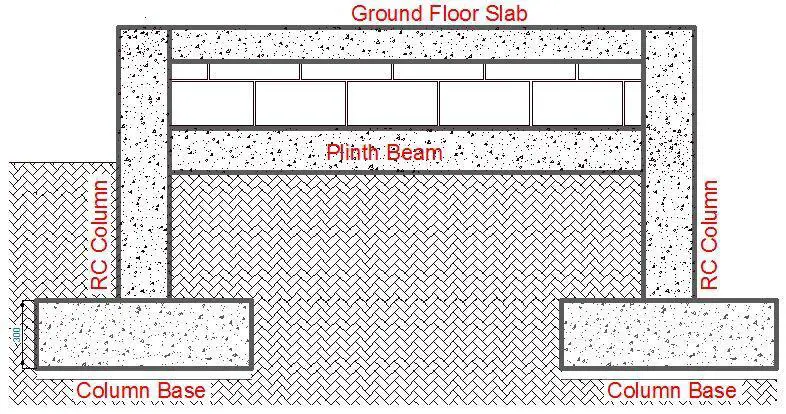
Blockwork is laid from the plinth beam to the required DPC level. After which the filling, compaction, and casting of the ground floor are done. A schematic representation of the final output is shown in Figure 8.

Alternative to duplex construction
Fig 9: Schematics of complete substructure works in a building using plinth beams

Cost Comparison of both Alternatives

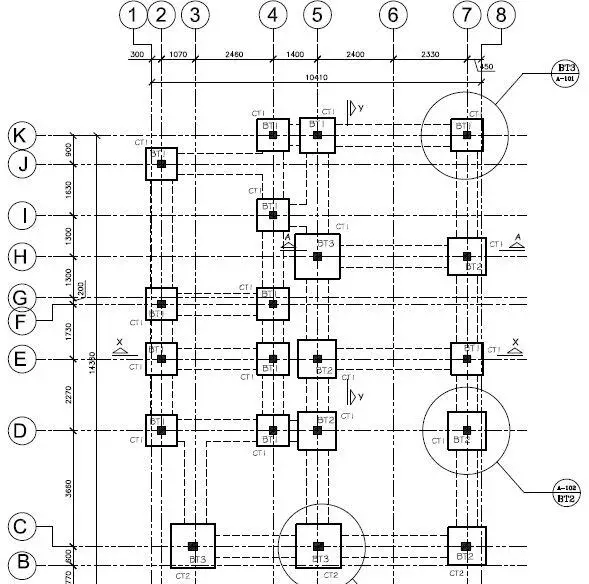
Let us now compare the cost of adopting both approaches in the construction of a duplex with the foundation layout shown in Figure 10.

foundation layout
Fig 10: Foundation layout of a typical duplex building

Constructing a plinth beam and ignoring strip foundation for the substructure layout shown in Figure 10 will incur the following costs;

(1) Cost of minor excavation and leveling of ground (say) = ₦20,000
(2) Concrete required = 6m3 × ₦42,500 = ₦255,000
(3) Y12 mm reinforcement required = 405 kg × ₦450 = ₦182,250
(4) Y8 mm required as links = 162 kg × ₦450 = ₦72,900
(5) Binding wire (say) = ₦13,000
(6) Formwork required 58 m2 of 1″ x 12″ planks = 58 m2 × ₦1905 = ₦110,490
(7) Bracing required 20 pcs pf 2″ x 3″ wood = 20 × ₦400 = ₦8000
(8) Total Labour and supervision cost = ₦120,000
Total cost of construction = ₦781,640

Alternatively, when the strip foundation is used, the likely costs are as follows;
(1) Excavation of strip foundation = ₦100,000
(2) Concrete required for the strip = 13.5 m3 × ₦42,500 = ₦573,750
(3) Blockwork to the ground level = 103 m2 × ₦3,700 = ₦381,100
(4) Backfilling of strip foundation (say) = ₦10,000
(5) Total Labour cost (concrete and block work) = ₦149,900
(6) Supervision cost (say) = ₦50,000
Total cost of construction = ₦1,264,750

Therefore using grade supported plinth beams to support blockwork instead of strip foundation in the substructure of a duplex can lead to savings in the cost of the substructure by about 38%.


Deflection of Beams

When loads are applied on beams, they deflect. Deflection of beams is the downward movement a beam makes from its initial unloaded position to another deformed position when a load is applied to it. Since beams are usually treated as two-dimensional elements, the neutral axis of a beam is usually taken as the reference point for measuring the deflection of beams. The sag or curve that the deflected beam makes with the original neutral axis is called the elastic curve of the beam, while the angle of the elastic curve (in radians) is called the slope.

Calculation of deflection is very important in beams since it is a very important serviceability check in the design of structures. If deflection is excessive or beyond permissible limits, it may lead to cracks, damage to finishes, and misalignment of building services/fittings. Furthermore, the knowledge of deflections is the key in the analysis of statically indeterminate structures, since the equations of equilibrium are not sufficient for resolving such structures.

Relationship between Slope, Deflection, and Radius of Curvature

deflection of beams

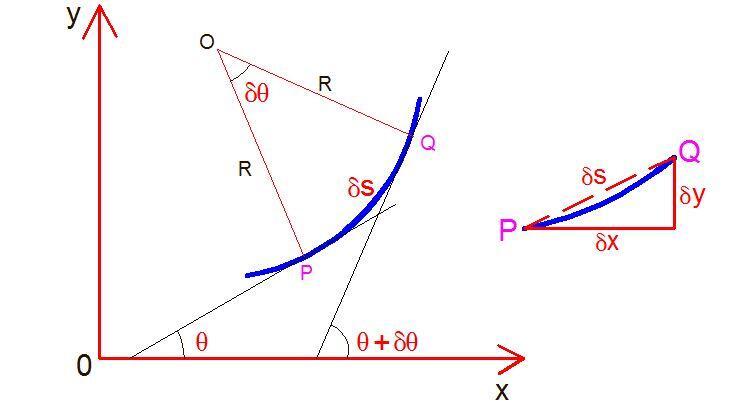
The figure above shows a small portion of a beam bent into an arc. Let us consider a small portion of the beam PQ

Let
δs = Length of the beam PQ
O = Centre of the arc unto which the beam has been bent
θ = The angle which the tangent at P makes with the x-axis
θ + δθ = The angle which the tangent at Q makes with the x-axis

From geometry;
δs = Rδθ
Therefore R = δs/δθ = dx/δθ (assuming δs = dx)
1/R = dθ/dx —- (1)

If the coordinates of points P and Q are x and y;
tan θ = dy/dx or θ = dy/dx (taking tan θ = θ since θ is very small).

Differentiatign the above equation with respect to x, we get;

dθ/dx = d2y/dx2
1/R = d2y/dx2 —- (2)

From the bending equation of beams, we know that;
M/I = E/R —– (3)

Substituing equation (2) into (3), we obtain;

M = – EI d2y/dx2 —- (4)

Equation (4) is known as the elastic curve equation and represents to the relationship between the bending moment and the displacements of the structure without considering shear deformation.

Methods of Assessing Deflection of Beams

The slope and deflection of beams can be calculated using the following methods;

(1) Double integration method
(2) Macaulays’ method
(3) Moment Area method
(4) Castigliano’s theorem
(5) Virtual work method (unit load method)
(6) Vereschagin’s rule (graphical method)

Solved Examples on Deflection of Beams

The deflection of cantilever and simply supported beams can be easily calculated using the double integration method or Vereschagin’s rule. Let us consider the above-named methods with the examples below;

Cantilever with a concentrated load at the free end

Deflection of a cantilever beam with a point load at the free end

Let us consider the bending moment equation of a section x-x at a distance x from the fixed end A

Mx = -P(L – x)
From the elastic curve equation;

EI d2y/dx2 = P(L – x)

On integrating, we obtain;
EI dy/dx = P(Lx – x2/2) + C1
At A (fixed end), x = 0 and dy/dx = 0
Therefore C1 = 0

Hence;
EI dy/dx = P(Lx – x2/2) —- (a) is the equation for the slope

At x = L (free end, point B);
θB = EI dy/dx = P(L × L – L2/2) = P(L2 – L2/2) = PL2/2
Therefore;
θB = PL2/2EI

To get the deflection, let us integrate equation (a);
EIy = P(L·x2/2 – x3/6) + C2

At A (fixed end), x = 0 and y = 0;
Therefore, C2 = 0

EIy = P(L·x2/2 – x3/6) —- (b) is the equation for the deflection

At x = L (free end, point B);
yB = EI y = P(L·L2/2 – L3/6) = PL3/3
Therefore;
yB = PL3/3EI

This same problem can be solved by combining two different bending moment diagrams according to Vereschagin’s rule. The first bending moment diagram is produced by the externally applied load, while the second bending moment diagram is produced by a unit load applied at the point where the deflection is sought. In order to obtain the deflection at that point, the area of the first bending moment diagram is multiplied by the ordinate that its centroid makes with the second bending moment diagram.

This is based on the famous Mohr’s integral which is given by;

δ = 1/EIMṀ ds

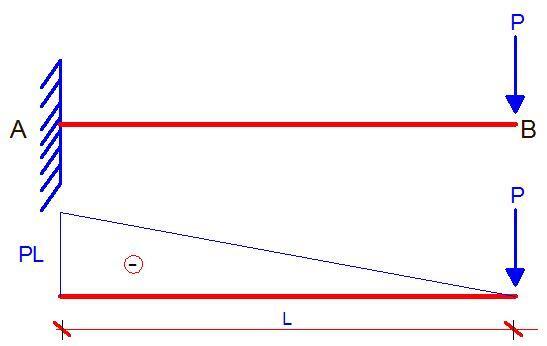
For the problem above, the bending moment due to the externally applied load is given below;

Bending moment due to externally applied load

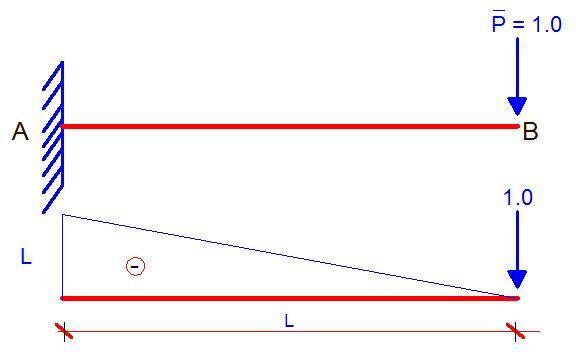
In order to obtain the deflection at point B, the external load P is replaced by a unit vertical load, and the bending moment diagram is plotted as shown below;

bending moment due to unit load

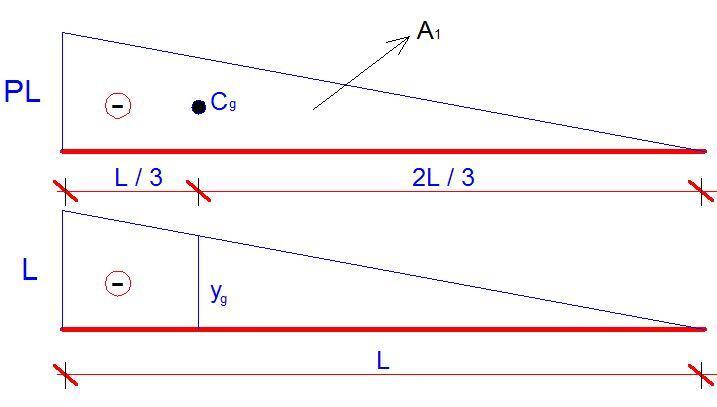
The deflection at point B is now obtained by combining the two bending moment diagrams according to Vereschagin’s rule.

diagram combination

As we all know, the area of the main diagram is given by A1 = bh/2 = (PL × L)/2 = PL2/2. Since the shape is a triangle, the centroid will occur at L/3 from point A. If the location of the centroid is traced down to the second diagram, the ordinate it makes (yg) can easily be calculated using similar triangles as 2L/3.

Note: When forming the flexibility matrix of structures using force method of structural analysis, the value obtained from the multiplication of A1 and yg is known as the ‘influence coefficient‘.

Therefore;
A1 = PL2/2
yg = 2L/3

δB = A1yg/EI = (PL2/2) × (2L/3) = PL3/3EI (This answer is the same as the one obtained using the double integration method).

To calculate the slope at point B, the vertical unit force at point B is replaced with a unit rotation (a unit moment), and the bending moment diagram obtained is combined accordingly with the bending moment diagram due to the externally applied load.

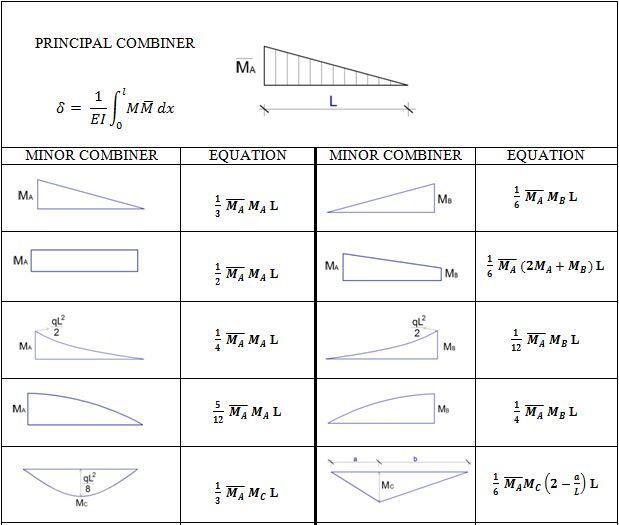
However, you may not need to bother so much about calculating the area, centroid, and ordinates of every shape since standard tables are available for different kinds of bending moment diagram combinations. You can download a copy HERE. An excerpt from the publication is given in the Table below.

diagram combination table

For instance, when a triangle is combined with a triangle, the influence coefficient is given by (1/3 × MA ×A × L).

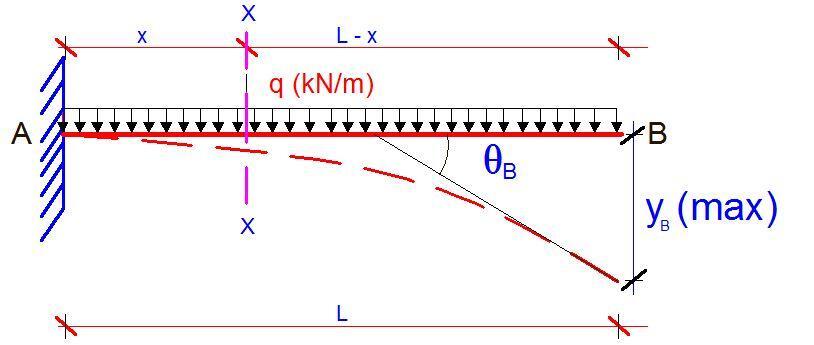
Cantilever with a uniformly distributed load

Deflection of a cantilever beam with a uniformly distributed load


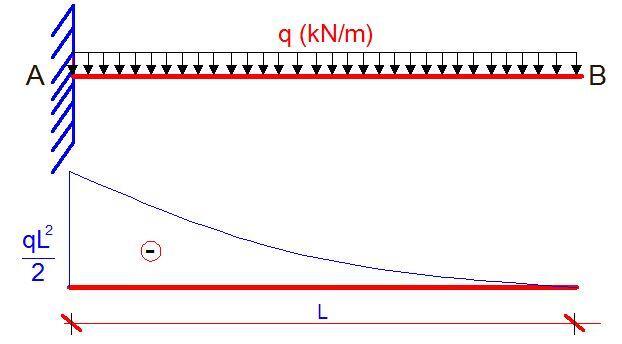
Let us consider the bending moment equation of a section X-X at a distance x from support A. The bending moment is given by;

Mx = -q(L – x)2/2
EI d2y/dx2 = q(L – x)2/2

On integrating;
EI dy/dx = -q(L – x)3/6 + C1

At x = 0, dy/dx = 0
Therefore, C1 = qL3/6

The general equation for slope is therefore given by;
EI dy/dx = -q(L – x)3/6 + qL3/6 —– (c)

At x = L (point B);
θB = qL3/6EI

To get the equation for deflection, we integrate equation (c);
EI y = q(L – x)4/24 + (qL3/6)x + C2

At x = 0, y = 0
Therefore, C2 = -qL4/24

The general deflection equation is therefore given by;
EI y = q(L – x)4/24 + (qL3/6)x – qL4/24 —– (d)

At x = L (point B);
yB = qL4/8EI

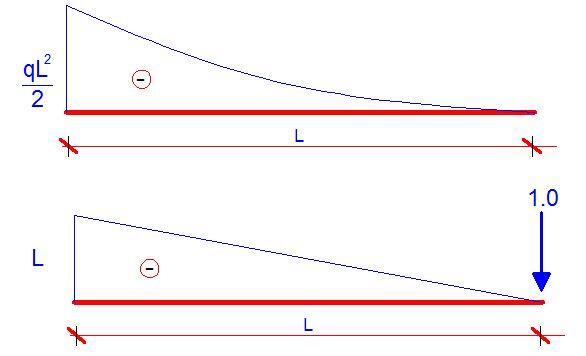
Using Vereschagin’s rule;

cantilever with UDL

The external load q (kN/m) is replaced by a unit vertical load placed at point B, and the bending moment diagram is plotted as shown below;

bending moment due to unit load

The deflection at point B is now obtained by combining the two bending moment diagrams according to Vereschagin’s rule.

diagram combination for UDL

δB = (1/4 × MA ×A × L) = (1/4 × qL2/2 × L × L) = qL4/8EI

Simply supported beam with a concentrated load at the mid-span

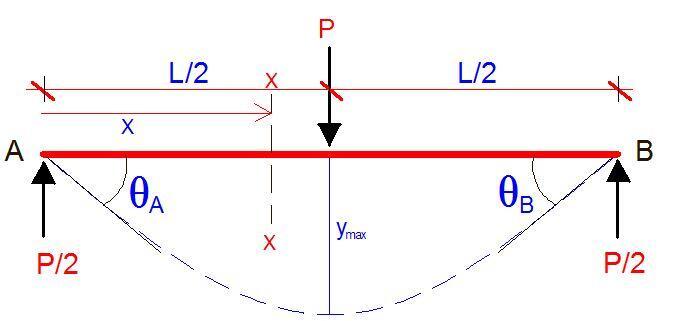
Deflection of a simply supported beam with a point load at the centre

At a section X-X from support A, the bending moment equation is given by;

Mx = Px/2
EI d2y/dx2 = -Px/2

Integrating;
EI dy/dx = -Px2/4 + C1

At x = L/2, dy/dx = 0 (slope is zero at the point of maximum deflection);
Therefore C1 = PL2/16

The general equation for slope is therefore given by;
EI dy/dx = -Px2/4 + PL2/16 ——- (e)

At x = 0;
θA = PL2/16EI (radians)

Integrating equation (e), we obtain;
EI y = -Px3/12 + (PL2/16)x + C2

At x= 0, y = 0
Therefore, C2 = 0

The general equation for deflection is therefore given by;
EI y = -Px3/12 + (PL2/16)x ——- (f)

At x = L/2;
ymax = PL3/48EI

Using Vereschagin’s rule;

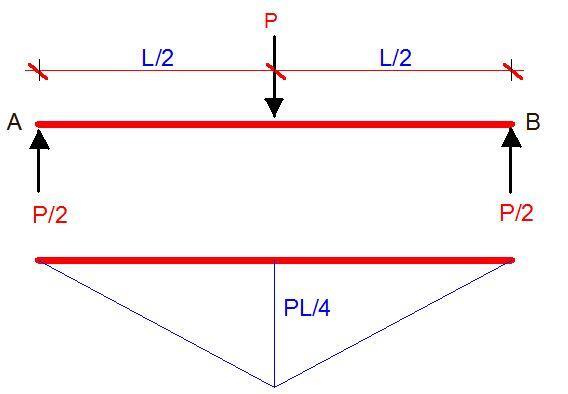
SIMPLY SUPPORTED BEAM WITH POINT LOAD BMD

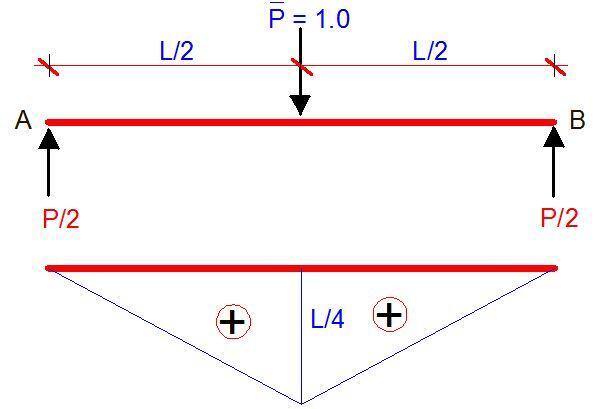
Let us replace the load P with a virtual unit load and plot the bending moment diagram;

UNIT LOAD ON SIMPLY SUPPORTED BEAM


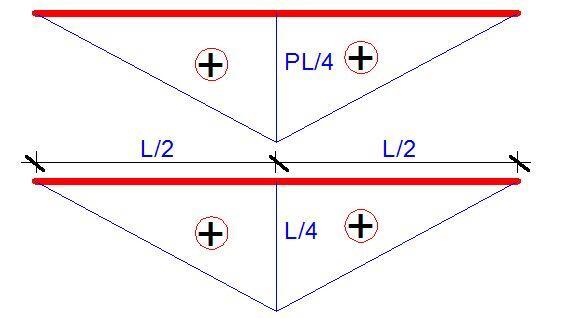
On the combination of the two diagrams;

D COMB

δmax = 2(1/3 × PL/4 × L/4 × L/2) = 2(PL3/96) = PL3/48EI

Simply supported beam with a uniformly distributed load

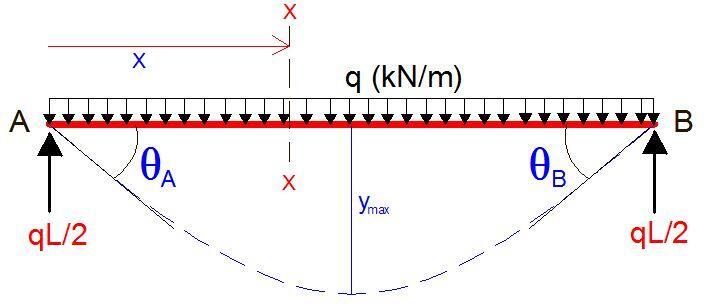
Deflection of a simply supported beam with a UDL

At a section X-X from support A, the bending moment equation is given by;

Mx = (qL/2)x – qx2/2
EI d2y/dx2 = -(qL/2)x + qx2/2

On integrating;
EI dy/dx= -qLx2/4 + qx3/6 + C1

At x = L/2; dy/dx = 0;
C1 = qL3/24

Therefore, the general slope equation is given by;
EI dy/dx= -qLx2/4 + qx3/6 + qL3/24 —– (g)

At x = 0;
θA = PL3/24EI (radians)

On integrating the equation for slope;
EI y= -qLx3/12 + qx4/24 + (qL3/24)x + C2

At x = 0, y= 0;
C2 = 0

Therefore the general deflection equation;
EI y= -qLx3/12 + qx4/24 + (qL3/24)x —– (h)

At x = L/2;
ymax = 5qL4/384EI

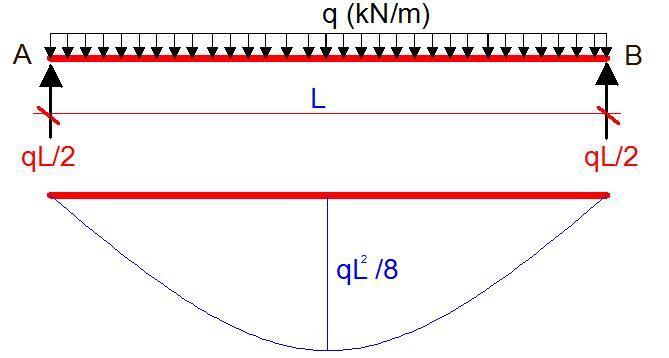
Using Vereschagin’s rule;

udl

Let us replace the UDL with a virtual unit load and plot the bending moment diagram;

UNIT LOAD ON SIMPLY SUPPORTED BEAM

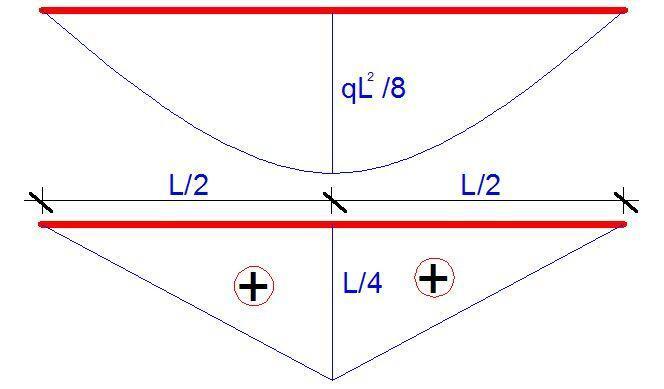
The diagram combination is now given by;

combination ty

δmax = 2(5/12 × qL2/8 × L/4 × L/2) = 2(5qL4/768) = 5qL4/384EI


Design of Deep Beams

A deep beam is a beam with a depth that is comparable to the span length. As a result, deep beam theory is required for the design of such elements due to the shear warping of the cross-section and a combination of diagonal and flexural tension strains in the body of a deep beam.

In BS 8110, the designer is directed to specialist literature for the design of beams with a clear span less than twice the effective depth. A deep beam is defined in Eurocode 2 (EN 1992-1-1:2004) as one whose effective span is less than three times its entire depth.

The fundamental principle underlying the design of slender beams is that stress distribution across the section is proportional to the distance from the bending’s neutral axis, i.e. plane sections of the cross-section of a beam perpendicular to its axis remain plane after the beam is bent. However, this notion only applies to deep beams to a limited extent, resulting in designs that are often not conservative.

For beams with short span-to-depth ratios, section warpage is important, and the smaller the span-to-depth ratio, the more apparent the deviation from the linear stress theory. For beams with span-to-depth ratios less than 2.5, the divergence from the fundamental linear stress hypothesis should be considered. The load is carried to the supports via a compression force that combines the load and the reaction, according to deep beam theory.

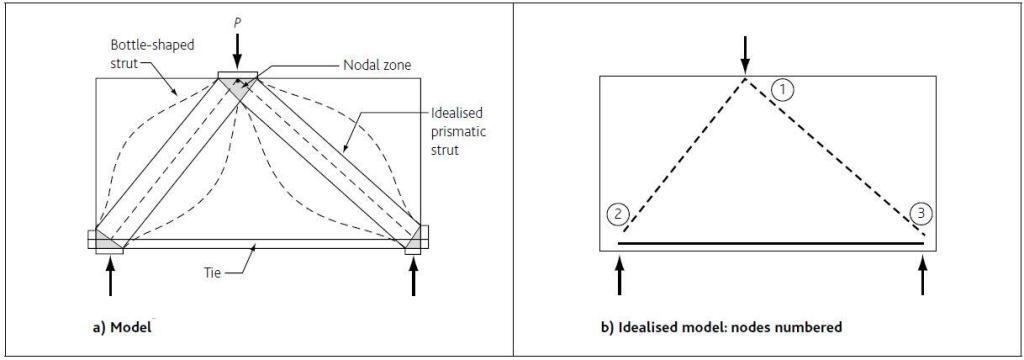
Strut and tie model for simply supported deep beams
Fig 1: Strut and tie model for deep beam (Hanoon et al, 2016)

By implication, when compared to pure bending, the strain distribution in deep beams is no longer regarded linear, and shear deformations become prominent. Many countries have included design rules for these aspects in their design regulations as a result of the knowledge that a deep beam behaves differently from a slender beam.

The structural behaviour of a single-span deep beam after the concrete in tension has cracked is similar to that of a tied arch (Reynolds et al, 2008). The compression force at the centre of the arch rises from the support to a height at the crown equal to roughly half the beam’s span. Because the bending moment and the lever arm vary similarly along the length of the beam, the tension force in the tie is essentially constant along its length. The structural behaviour of a continuous deep beam is similar to that of a separate tied arch system for each span, paired with a suspension system centred over each internal support.

For deep beam reinforcement and detailing, Eurocode 2 recommends using one of two design techniques. The first methodology is connected to the strut-and-tie model application and the second methodology is related to a linear elastic analysis using the finite element method.

Strut and Tie Method (STM) for Deep Beams

Strut and Tie Modelling is an effective way of representing complex stress patterns as triangulated models. STM is based on the truss analogy concept and can be applied to numerous concrete structural parts. Essentially, strut-and-tie models (STM) are trusses consisting of struts, ties and nodes. It is commonly used to design non-standard concrete construction elements or parts of elements like pile caps, corbels, deep beams (depth > span/3), beams with holes, connections, and so on, where typical beam theory doesn’t always apply.

Strut and Tie Model for a Simple deep beam
Fig 2: Strut and Tie Model for a Simple deep beam (Source: Goodchild et al, 2014)

STM is a lower bound plastic theory, which implies it is safe as long as the following conditions are met:

  • The equilibrium has been satisfied
  • The structure is sufficiently ductile to allow the struts and connections to form.
  • Struts and ties are proportioned to withstand the forces they are designed to withstand.

The strut-and-tie model design method can be broken down into four stages:

  1. Define and isolate the B- and D-regions
  2. Develop an STM – a truss system to represent the stress flow through the D-region and calculate the member forces in the truss
  3. Dimension and design the STM members, as well as the truss members, to resist the design forces.
  4. Iterate as needed to optimise the STM to reduce strain energy.

Note: B (or beam or Bernoulli) regions in which plane sections remain plane and design is based on ‘normal’ beam theory. D (or discontinuity or disturbed) regions in which plane sections do not remain plane; so ‘normal’ beam theory may be considered inappropriate. D-regions arise as a result of discontinuities in loading or geometry and can be designed using STMs. Typical examples of D-regions include connections between beams and columns, corbels, openings in beams, deep beams and pile caps, etc.

For more information on strut and tie models, see ‘How to design concrete members using strut-and-tie models in accordance with Eurocode 2‘.

Worked Example on Deep Beam Design

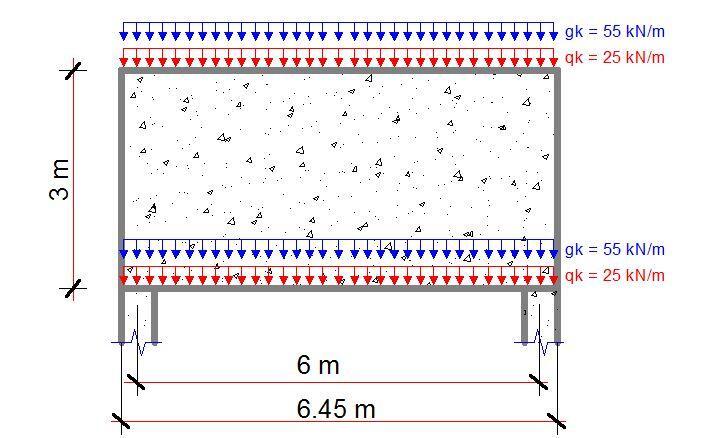
A 6450 x 3000 beam, 225 mm thick is supported on 450 x 225 columns. As shown below, it spans 6.0 m and supports actions of gk = 55 kN/m and qk = 25 kN/m at the top and bottom of the beam. Assume C25/30 concrete, fyk = 500 MPa and cnom = 30 mm.

deep beam design

Solution

Bottle-shaped Strut and tie model
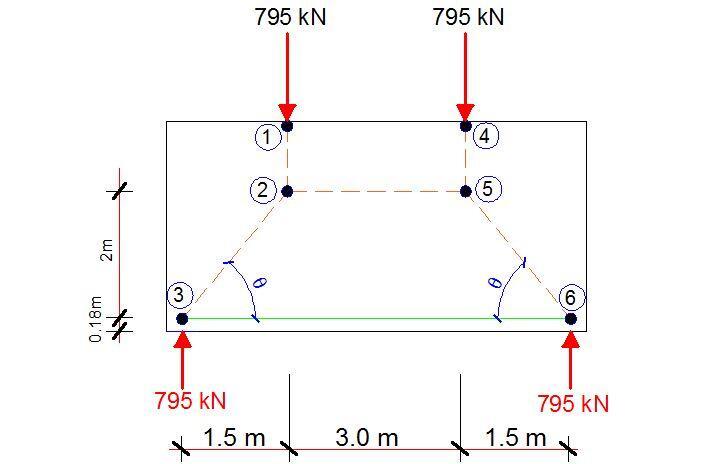
At ULS, a strut and tie model may be constructed to determine strut-and-tie forces: see Figure below. Here the UDLs top and bottom are resolved into two-point loads applied at ¼ spans at the top of the wall.

Total applied load = [2 × ( 55 × 1.35 + 25 × 1.5 )] = 223.5 kN/m × 6.45m = 1441.575 kN
Self weight = [3.0 × 0.225 × 25 × 1.35] × 6.45 = 146.939 kN
Total = 1588.51 kN (say 2 × 795 kN)

STRUT AND TIE MODEL FOR DEEP BEAM 1

MC90 gives z = 0.6-0.7 × minimum (h, L) = 0.67 × 3000 = 2000 mm
MC90 gives u ≈ 0.12 × minimum (h, L) = 0.12 × 3000 = 360 mm (i.e 180 mm to centreline)

Check θ
tan θ = 2000/1500 = 1.33 i.e. < 2/1 ∴ OK
θ = 53.13o

Forces
C12 = 795 kN
Length of C23 = (20002 + 15002)0.5 = 2500 mm

By trigonometry:
C23 = (2500/2000) × 795 = 993.75 kN
T35 = (1500/2500) × 993.75 = 596.25 kN

Choice
A fan-shaped stress field is appropriate for the ULS but not necessarily for the SLS where the lever arm can be determined from elastic analysis or alternatively in accordance with the recommendations of MC90. Designed reinforcement will not be required if the design bearing stress is less than σRdmax = 0.85υ’fcd: in that case the design loads will be safely transmitted to the supports through the fan-shaped stress field. Suspension reinforcement is required to transmit the bottom loading to the top of the beam. In addition, minimal horizontal reinforcement is required for crack control.

Check (fan) strut at node 3
Strut in bearing, C32
For CCT Node (and fan-shaped strut)
σRdmax = 0.85υ’fcd
where
υ’ = 1 – fck/250 = 1 – (25/250) = 0.90
fcd = αccfckm = 0.85 × 25 / 1.5 = 14.2
σRdmax = 10.8 MPa

σEd32 = Fc / ab

where
Fc = 993.75 kN
a = width of strut = (acol – cnom – 2so) sin 53.13 + u cos 53.13
= (450 – 30 + 2 × (30 + say 12 + 30/2)) sin 53.13 + 360 cos 53.13
= (450 – 144) sin 53.13 + 360 cos 53.13 = 532.799 mm

b = thickness = 225 mm
σEd32 = 993.75 × 10³ / (532.799 × 225) = 8.289 MPa
i.e. < 10.8 MPa ∴ OK
NB: As σEd32 < σRdmax no further checks on strut 2-3 are necessary since the stress field is fan-shaped at the ULS.

Ties
a) Main tie
As,req = Ft / fyd = 596.25 × 10³ / (500 / 1.15) = 1371 mm2
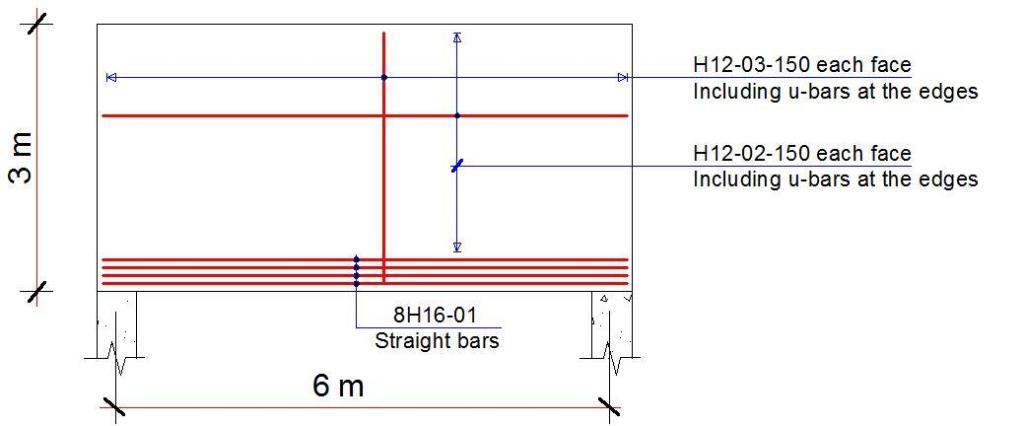
Try 8H16 (1608 mm2)

Check anchorage:
Assuming straight bar
lbd = αlbrqd = α(ϕ/4) (σsd/fbd)

where
α = 1.0 (assumed)
ϕ = diameter of bar = 16 mm
σsd= 500 / 1.15 = 435 MPa
fbd = 2.25η1fctk / γm = 2.25 × 1.0 × 1.0 × (1.8 / 1.5) = 2.7 MPa

lbd = 1.0 x (16/4) × (435/2.7) = 644 mm

Average length available = 450 – 30 + cot 53.13° × (360 / 2) = 555 mm – no good

lbd = 644 x 1371/1608 = 549 mm: OK
∴ Provide 8H16 (1608 mm2)

Vertical tie steel
Vertical tie steel is required to take loads from bottom level to top level.
As,req = (55 x 1.35 + 25 × 1.5) / (500/1.15) = 111.75 × 10³ / ( 434.783) = 257 mm2/m


Minimum areas of reinforcement
Consider as a wall
Asvmin = 0.002Ac = 0.002 × 1000 × 225 = 450 mm2/m

Vertically, say minimum area and tie steel additive. Therefore provide
257 + 450 mm2/m = 707 mm2/m

Consider as a deep beam
Asdb,min = 0.2% Ac each surface: i.e. require 675 mm2/m
∴ Use H12@150 between each face (753 mm2/m each way each side)

Detailing Sketches

detailing sketches of deep beam

References
[1] Goodchild, C. H., Morrison, J., and Vollum, R. L. (2014): Strut-and-tie models: How to design concrete members using strut-and-tie models in accordance with Eurocode 2. The Concrete Centre, UK
[2] Hanoon, A. N., Jaafar, M. S., Hejazi F., and Abd Aziz F.N.A. (2016): Strut effectiveness factor for reinforced concrete deep beams under dynamic loading conditions, Case Studies in Structural Engineering, (6): 84-102, https://doi.org/10.1016/j.csse.2016.08.001.
[3] Reynolds C. E., Steedman J. C., and Threlfall A. J. (2008): Reynolds’s Reinforced Concrete Designer’s Handbook (11th Edition). Taylor and Francis

Sequence and Method of Erection of Steel Structures

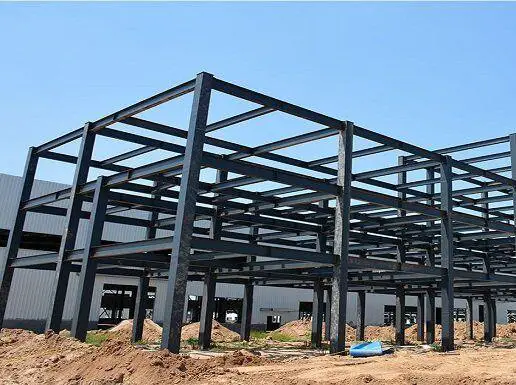
The sequence and methods of erection of steel structures are generally dependent on the layout and arrangement of the structural components. Erection of steel structures involves the on-site installation of steel members into a frame. Lifting and positioning the individual components into position, then joining them together, are all part of the process. Bolting is the most common method, however, site welding is also employed.

Generically, the erection of steel structures consists primarily of four tasks:

  1. Ensure that the foundations are suitable and safe before starting the erection process.
  2. Generally, cranes are used to lift and place components into place, however, jacking is also used. Bolted connections can be used to secure components in place, but they will not be fully tightened. Similarly, bracings may not be completely secure.
  3. Aligning the building, primarily by making sure that the column bases are lined and level, and that the steel columns/stanchions are plumb. To allow for column plumb adjustment, the packing in beam-to-column connections may need to be modified.
  4. Bolting-up the frame by ensuring that all bolted connections are fully installed in order to secure and make the frame rigid.
steel structure construction
Steel structure construction

Normally, the following sequence and method of erection are followed;

Sequence for Erection of Steel Structures

Stage 1:
Before the steelwork erection commences, the sizes and exact locations of the holding-down bolts on the foundation and base plates are double-checked. Sometimes, discrepancies can occur due to errors from setting out thereby causing the erection timetable to be delayed. Following these checks, the following procedures are carried out:

  • Install the columns on the base plates.
  • Align the columns properly to be straight and plumb.
  • Under the base plate, adjust the holding-down bolts with adjustable screws to maintain the required grout gap between the bottom of the base plate and the foundation.
  • Use temporary bracings to keep the columns true to their vertical position and prevent them from swaying in any direction.
  • The columns or stanchions are erected in parts and fastened together on site when they are quite long.

Stage 2:
Install the central portion of each rafter. When trusses are to be used, the whole section may be erected in one piece after fabrication on the ground.
Connect the truss to the column ends with bolts to form the full structural frame.

Stage 3:
After final alignments and adjustments of the frame placements, install the vertical column bracing and roof bracings to make the entire structure stable.

Stage 4:
Use bolted connections to secure all roof purlins and sheeting rails to the framework.

Stage 5:
If necessary, erect gantry crane girders (for industrial buildings and warehouses).

Stage 6:
Install the overhead cranes on the crane girders where required.

Stage 7:
Install the roof and side panels.

Stage 8:
After the erection is complete, fill the undersides of the base plates with non-shrink grout.

Normal construction follows the erection sequence outlined above. After preparing an erection program, a special sequence should be followed in the case of special constructions.

Lifting of Steel Members

Cranes and Mobile Elevating Work Platforms (MEWPs) are commonly used for the erection of steel structures, even though other methods may be utilized for steel bridge construction. Cranes are generally categorized into two categories: mobile and non-mobile. Truck-mounted cranes, crawler cranes, and all-terrain cranes fall into the first group, whereas tower cranes fall into the second.

crane lifting
Crane lifting a heavy steel member

The number of crane lifts required determines typical erection speeds and, as a result, the site programme of works. Pre-assembled units should be used to the maximum extent possible to reduce the number of crane lifts. If crane availability is an issue, steel decking, which can be installed by hand, is a better option than precast concrete units, which require a crane for individual placement. The designer can utilize a ‘piece count’ to estimate the number of lifts required and thus the erection time.

Alignment and Plumbing

Lining, leveling, and plumbing involve collaboration between the site engineer, who uses a survey instrument, and the erection crew, who tightens and shimmies the last bolts. The erection gang persuades the frame to move to a position acceptable to the checking engineer by using wedges, jacks, pull-lifts, and proprietary pulling devices such as Tirfors, and then bolts it up firmly. Some misalignment is overcome, and some are produced, as a result of this process. If the latter is unfavorable, local adjustments are made.

Connections

Bolted Connections
Bolted connections are preferable to site welding because it is faster, less sensitive to bad weather, and have less access restrictions and inspection requirements.

Property class 4.6 and 8.8 non-preloaded bolts to BS EN 15048 are commonly used in 2 mm clearance holes in structural bolting operations (for buildings) in the UK. M20 8.8 completely threaded bolts, which are the recommended solution, are widely accessible. Bolts with property class 4.6 are typically used only for fixing lighter components like purlins or sheeting rails, when 12 mm or 16 mm bolts can be used instead.

Bolting during erection of steel structures
Bolting of steel beams on site

Fully threaded bolts are commonly specified, implying that one bolt size can be used for a wide range of connections. It is advised that M20, 8.8 completely threaded bolts 60 mm long be used, as they can be used to make roughly 90% of basic connections. Preloaded bolts should only be utilized in situations where relative movement of linked parts (slip) is objectionable or if dynamic loading is a possibility.

It is best to avoid using different grade bolts of the same diameter on the same project. With non-preloaded bolts in typical clearance holes, washers are not required for strength. Bolts, nuts, and washers should be supplied with a corrosion-resistant coating that does not require further protection on-site when possible.

Welded Connections
If bolted connections can be made, site welding is usually avoided. When site welding is used, it is necessary to provide cover from bad weather as well as good access for both welding and inspection. Apart from the extra cost implications, providing such protection and access may have program consequences.

Erection Handover

The final goal of the erection process is to hand over the frame in good working order to the subsequent trades. The crucial criterion here is the erected frame’s positional precision, which is dependent on an understanding of how a steel frame’s erected position is regulated.

A steel-framed structure is a massive structure made up of a huge number of relatively thin and flexible components. Plumb and line accuracies of about 1 part in 1000 are targeted for the completed construction, employing components that can be fabricated with greater variability than 1 part in 1000 separately. Deformations such as the flexure of the structure under the self-weight of steel also have an impact on its real position.

Tests performed upon handover of a built steel structure could be deemed final under an inspection and test plan. All tests must have the following information in order to be meaningful:

  • The testing procedure
  • The test’s location and frequency
  • Criteria for Acceptance
  • Actions to be taken if compliance criteria is not obtained

How to Apply Wind Load on Roofs of Buildings

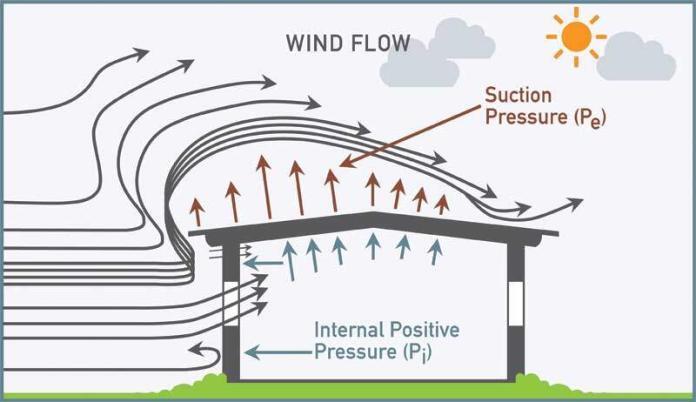
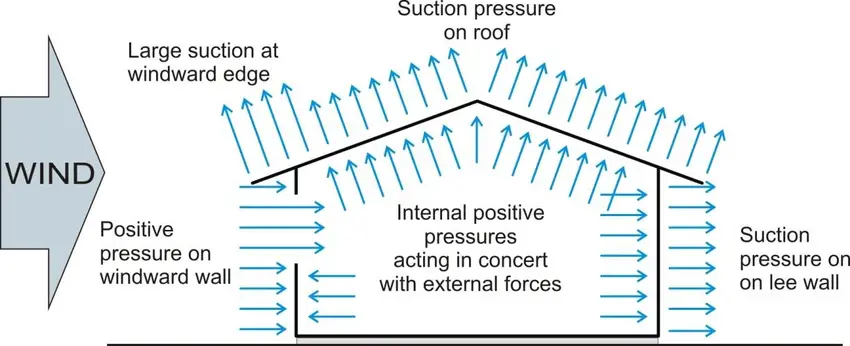
Wind load is one of the significant actions on roofs. While other loads such as the self-weight of materials, imposed loads, service loads, and snow loads are pointed downwards, wind load on roofs tends to pull the roof upwards. As a result, when wind load is acting on roofs, there is a possibility of the reversal of internal forces in the members of the roofs trusses or rafters from tensile to compressive or vice versa. This is why the application of wind load on roofs is so important.

The method for the application of wind load on roofs is given in EN 1991-1-4:2005 (Eurocode 1 Part 4). The effect of wind on any structure (i.e. the response of the structure), depends on the size, shape, and dynamic properties of the structure. Wind action is represented by a simplified set of pressures or forces whose effects are equivalent to the extreme effects of the turbulent wind. It is important to note that the wind actions calculated using EN 1991-1-4 are characteristic values and are determined from the basic values of wind velocity or velocity pressure. Unless otherwise specified, wind actions are classified as variable fixed actions.

Simplified representation of wind pressures acting on building
Simplified representation of wind load on buildings

Procedure for the calculation of Wind Load on Roofs

(1) Determine the peak velocity pressure qp by calculating/obtaining the following values;

  • basic wind velocity Vb
  • reference height Ze
  • terrain category
  • characteristic peak velocity pressure qp
  • turbulence intensity Iv
  • mean wind velocity Vm
  • orography coefficient co(z)
  • roughness coefficient cr(z)

(2) Calculate the wind pressures using the pressure coefficients;

  • external pressure coefficient cpe
  • internal pressure coefficient Cpi
  • net pressure coefficient cp,net
  • external wind pressure: we = qp cpe
  • internal wind pressure: Wi = qp Cp

(3) Calculate the wind force

  • determine the structural factor: CsCd
  • wind force Fw calculated from force coefficients
  • wind force Fw calculated from pressure coefficients
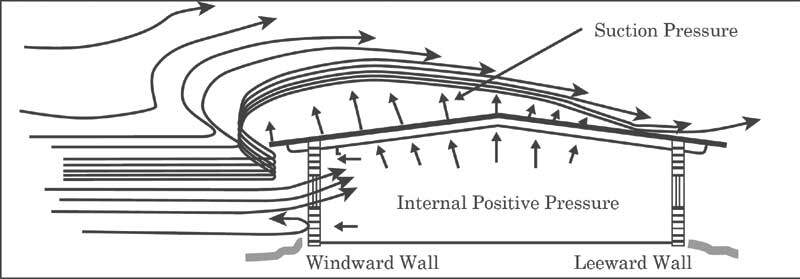
wind pressure on roofs of buildings
Typical wind pressure on roofs

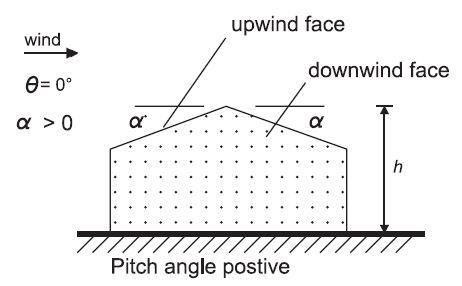
A pioneering wind tunnel experiment (Stanton, 1908) showed that when the roof slope is greater than 70 degrees from horizontal on the windward side, the roof surface can be treated as a vertical surface, with the external pressure coefficient cpe equal to +0.5 (positive). The positive normal wind pressure reduces as the roof slope lowers. The pressure drops to zero when the roof slope approaches 30 degrees. A negative normal pressure (suction) acts upwardly normal to the slope when the roof slope falls below 30°.

As the slope declines, the suction pressure increases until it reaches its maximum value when the slope is zero (i.e. a flat roof). If the roof slope is 45 degrees, for example, cpe = (45/100 – 0.2) = +0.25. If the roof slope is 30°, cpe = (30/60 – 0.5) = 0.0. If the roof slope is 10° cpe = (10/30 – 1.0) = -0.67 (upwards suction). If the roof slope is 0°, cpe = (0/30 – 1) = 1.0 (upwards suction).

Based on the same experiment results, cpe = -1.0 (upwards suction) for all roof slopes on the leeward roof slope. Thus, cpe = 1.0 (upwards suction) for the windward part of a flat roof and cpe = -0.5 (upwards suction) for the leeward side.

A building is subjected to internal pressures due to apertures in the walls, in addition to external wind pressures. Therefore, we have to also consider the internal pressure coefficients cpi. The result of wind blowing into a building through an opening facing the opposite direction as the wind blowing onto the building is the formation of internal pressure within the structure.

Positive internal pressure: When wind blows into an open-sided building or into a workshop through a large open door, the internal pressure seeks to force the roof and side coverings outwards, resulting in positive internal pressure.

Negative internal pressure (suction): This is formed within a building when the wind blows in the opposite direction, tending to pull the roof and side coverings inwards.

The coefficient of internal suction cpi = ±0.2 in normal permeability shops (covered with corrugated sheets), and ±0.5 in buildings with extensive apertures (in the case of industrial buildings). Internal suction, or pressure away from the interior surfaces, is shown by a negative number, whereas internal pressure is indicated by a positive value.

Worked Example

Calculate the wind action on the walls and roof of a building with the data given below. Consider when the wind is coming perpendicular (0°) to the length of the building, and normal to it (90°).

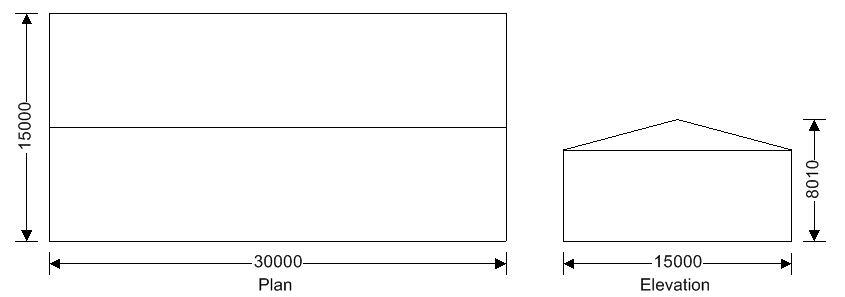
building details

Building data
Type of roof; Duopitch
Length of building;  L = 30000 mm
Width of building;  W = 15000 mm
Height to eaves; H = 6000 mm
Pitch of roof;  α0 = 15.0°
Total height;  h = 8010 mm

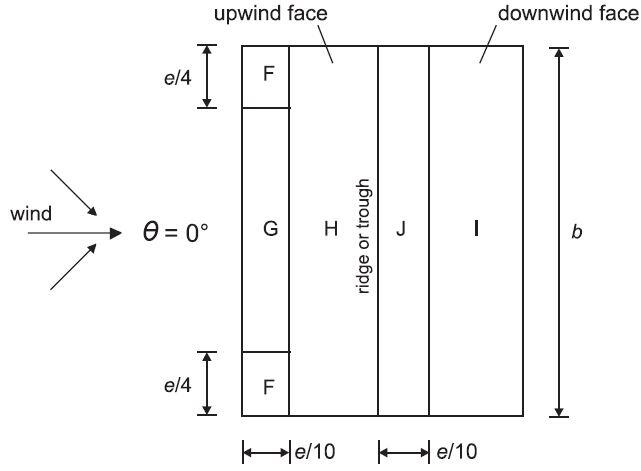
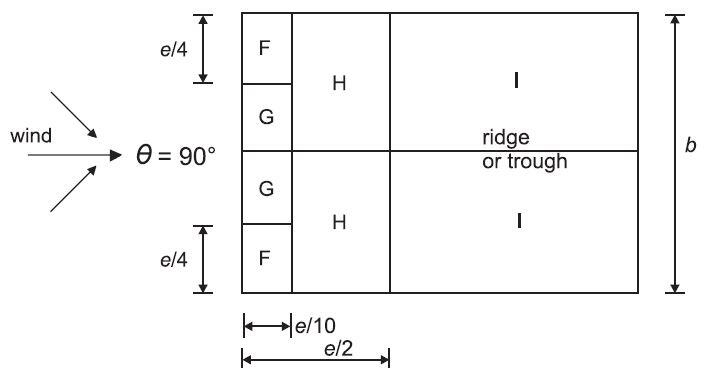
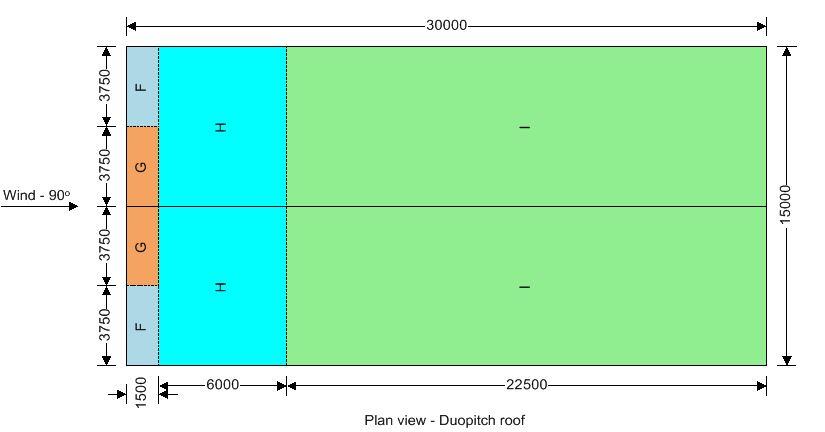
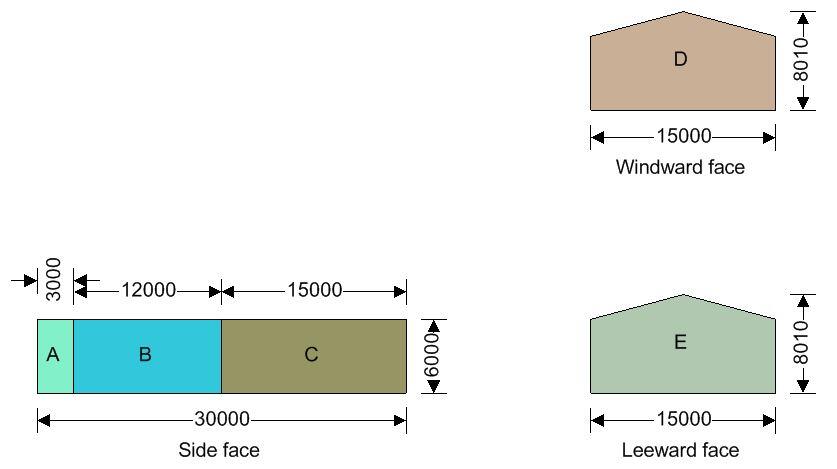
Tekla Tedds will be used for executing the wind load analysis on the building. The key to the pressure coefficients for a building with a duopitch roof is given below (Figure 7.8 EN 1991-1-1:2005). Note that e = B or 2h whichever is smaller, where b is the crosswind dimension.

duopitch roof
Pressure coefficients for wind load on roofs
(a) Key for pressure coefficients – wind direction θ = 0°
90 d
(a) Key for pressure coefficients – wind direction θ = 90°

Location of building; Onitsha, Anambra State, Nigeria
Wind speed velocity; vb,map = 40.0 m/s
Distance to shore; Lshore = 50.00 km
Altitude above sea level; Aalt = 50.0m

Altitude factor;calt = Aalt/1m × (0.001 + 1) = 1.050
Fundamental basic wind velocity; vb,0 = vb,map × calt = 42.0 m/s
Direction factor; cdir = 1.00
Season factor; cseason = 1.00
Shape parameter K; K = 0.2
Exponent n; n = 0.5
Air density; ρ = 1.226 kg/m3

Probability factor;  cprob = [(1 – K × ln(-ln(1-p)))/(1 – K × ln(-ln(0.98)))]n = 1.00
Basic wind velocity (Exp. 4.1); vb = cdir × cseason × vb,0 × cprob = 42.0 m/s
Reference mean velocity pressure;  qb = 0.5 × ρ × vb2 = 1.081 kN/m2

Orography
Orography factor not significant; co = 1.0
Terrain category; Country
Displacement height (sheltering effect excluded);   hdis = 0 mm

The velocity pressure for the windward face of the building with a 0 degree wind is to be considered as 1 part as the height h is less than b (cl.7.2.2). The velocity pressure for the windward face of the building with a 90 degree wind is to be considered as 1 part as the height h is less than b (cl.7.2.2)

Peak velocity pressure  – windward wall – Wind 0 deg and roof

Reference height (at which q is sought); z = 6000 mm
Displacement height (sheltering effects excluded); hdis = 0 mm
Exposure factor (Figure NA.7); ce = 2.05
Peak velocity pressure; qp = ce × qb = 2.22 kN/m2

Structural factor
Structural damping;  δs = 0.100
Height of element; hpart = 6000 mm
Size factor (Table NA.3);  cs = 0.884
Dynamic factor (Figure NA.9); cd = 1.003
Structural factor;  csCd = cs × cd = 0.887

Peak velocity pressure  – windward wall – Wind 90 deg and roof
Reference height (at which q is sought);  z = 8010 mm
Displacement height (sheltering effects excluded); hdis = 0 mm
Exposure factor (Figure NA.7);  ce = 2.23
Peak velocity pressure; qp = ce × qb = 2.41 kN/m2

Structural factor
Structural damping; δs = 0.100
Height of element;  hpart = 8010 mm
Size factor (Table NA.3);  cs = 0.911
Dynamic factor (Figure NA.9); cd = 1.016
Structural factor; csCd = cs × cd = 0.925

Structural factor – roof 0 deg

Structural damping; δs = 0.100
Height of element; hpart = 8010 mm
Size factor (Table NA.3); cs = 0.888
Dynamic factor (Figure NA.9); cd = 1.003
Structural factor; csCd = cs × cd = 0.891

Peak velocity pressure for internal pressure
Peak velocity pressure – internal (as roof pressure); qp,i = 2.41 kN/m2

Pressures and forces
Net pressure; p = csCd × qp × cpe – qp,i × cpi
Net force; Fw = pw × Aref

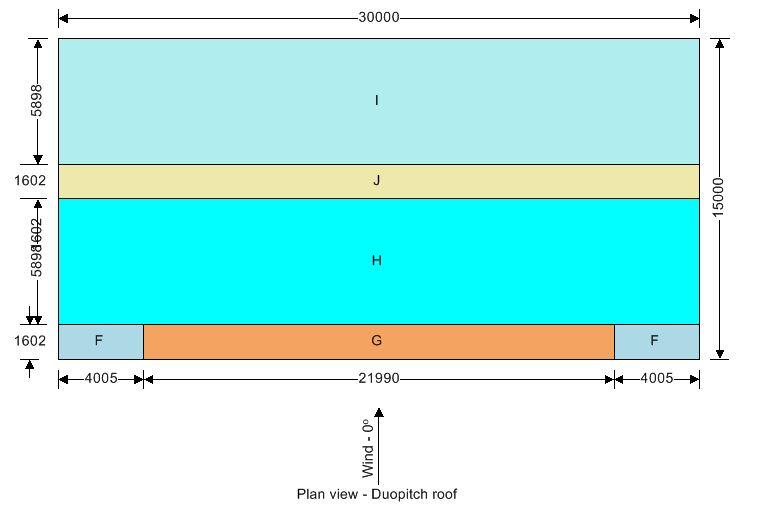
plan view 1
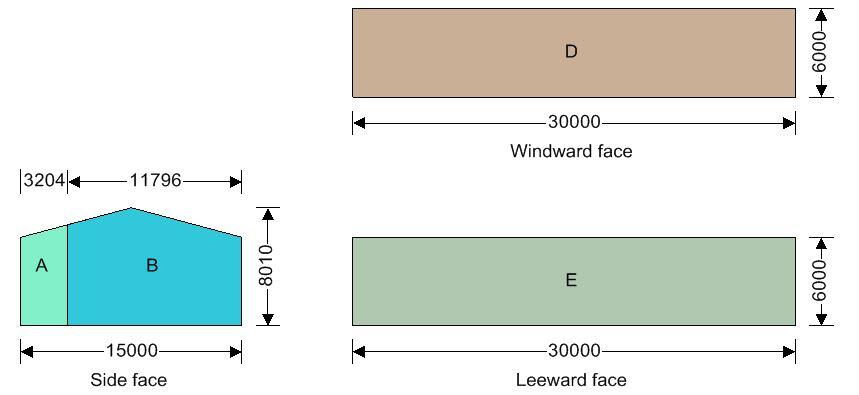
faces for wind action

Roof load case 1 – Wind 0, cpi 0.20, -cpe

ZoneExt pressure coefficient
cpe
Peak velocity pressure
qp, (kN/m2)
Net pressure
p (kN/m2)
Area
Aref (m2)
Net force
Fw (kN)
F (-ve)-1.102.41-2.8413.28-37.78
G (-ve)-0.802.41-2.2036.47-80.23
H (-ve)-0.402.41-1.34183.18-245.64
I (-ve)-0.502.41-1.56183.18-284.97
J (-ve)-1.302.41-3.2749.75-162.87

Total vertical net force; Fw,v = -783.83 kN
Total horizontal net force; Fw,h = 21.79 kN

Walls load case 1 – Wind 0, cpi 0.20, -cpe

ZoneExt pressure coefficient
cpe
Peak velocity pressure
qp, (kN/m2)
Net pressure
p (kN/m2)
Area
Aref (m2)
Net force
Fw (kN)
A-1.202.41-3.0520.60-62.77
B-0.802.41-2.1984.47-185.17
D0.742.220.97180.00174.37
E-0.382.22-1.22180.00-219.73

Overall loading

Equivalent leeward net force for overall section; Fl = Fw,wE = -219.7 kN
Net windward force for overall section; Fw = Fw,wD = 174.4 kN
Lack of correlation (cl.7.2.2(3) – Note);  fcorr = 0.85; as h/W is 0.534
Overall loading overall section; Fw,D = fcorr × (Fw – Fl + Fw,h) = 353.5 kN

Roof load case 2 – Wind 0, cpi -0.3, +cpe

ZoneExt pressure coefficient
cpe
Peak velocity pressure
qp, (kN/m2)
Net pressure
p (kN/m2)
Area
Aref (m2)
Net force
Fw (kN)
F (+ve)0.202.411.1513.2815.31
G (+ve)0.202.411.1536.4742.03
H (+ve)0.202.411.15183.18211.11
I (+ve)-0.502.41-0.35183.18-64.23
J (+ve)-1.302.41-2.0749.75-102.91

Total vertical net force; Fw,v = 97.86 kN
Total horizontal net force;  Fw,h = 112.74 kN

Walls load case 2 – Wind 0, cpi -0.3, +cpe

ZoneExt pressure coefficient
cpe
Peak velocity pressure
qp, (kN/m2)
Net pressure
p (kN/m2)
Area
Aref (m2)
Net force
Fw (kN)
A-1.202.41-1.8420.60-37.94
B-0.802.41-0.9984.47-83.38
D0.742.222.17180.00391.28
E-0.382.22-0.02180.00-2.83

Overall loading
Equivalent leeward net force for overall section; Fl = Fw,wE = -2.8 kN
Net windward force for overall section; Fw = Fw,wD = 391.3 kN
Lack of correlation (cl.7.2.2(3) – Note); fcorr = 0.85; as h/W is 0.534
Overall loading overall section; Fw,D = fcorr × (Fw – Fl + Fw,h) = 430.8 kN

90 degrees
faces 90 degrees

Roof load case 3 – Wind 90, cpi 0.20, -cpe

ZoneExt pressure coefficient
cpe
Peak velocity pressure
qp, (kN/m2)
Net pressure
p (kN/m2)
Area
Aref (m2)
Net force
Fw (kN)
F (-ve)-1.602.41-4.0511.65-47.17
G (-ve)-1.502.41-3.8311.65-44.58
H (-ve)-0.602.41-1.8293.17-169.59
I (-ve)-0.402.41-1.37349.41-480.12

Total vertical net force; Fw,v = -716.21 kN
Total horizontal net force;  Fw,h = 0.00 kN

Walls load case 3 – Wind 90, cpi 0.20, -cpe

ZoneExt pressure coefficient
cpe
Peak velocity pressure
qp, (kN/m2)
Net pressure
p (kN/m2)
Area
Aref (m2)
Net force
Fw (kN)
A-1.202.22-2.9418.00-52.99
B-0.802.22-2.1272.00-152.86
C-0.502.22-1.5190.00-135.69
D0.702.411.08105.07113.92
E-0.302.41-1.16105.07-122.01

Overall loading
Equiv leeward net force for overall section; Fl = Fw,wE = -122.0 kN
Net windward force for overall section; Fw = Fw,wD = 113.9 kN
Lack of correlation (cl.7.2.2(3) – Note); fcorr = 0.85; as h/L is 0.267
Overall loading overall section; Fw,D = fcorr × (Fw – Fl + Fw,h) = 200.5 kN

Roof load case 4 – Wind 90, cpi -0.3, +cpe

ZoneExt pressure coefficient
cpe
Peak velocity pressure
qp, (kN/m2)
Net pressure
p (kN/m2)
Area
Aref (m2)
Net force
Fw (kN)
F (+ve)0.202.411.1711.6513.62
G (+ve)0.202.411.1711.6513.62
H (+ve)0.202.411.1793.17108.93
I (+ve)0.202.411.17349.41408.48

Total vertical net force;  Fw,v = 526.08 kN
Total horizontal net force; Fw,h = 0.00 kN

Walls load case 4 – Wind 90, cpi -0.3, +cpe

ZoneExt pressure coefficient
cpe
Peak velocity pressure
qp, (kN/m2)
Net pressure
p (kN/m2)
Area
Aref (m2)
Net force
Fw (kN)
A-1.202.22-1.7418.00-31.30
B-0.802.22-0.9272.00-66.10
C-0.502.22-0.3090.00-27.24
D0.702.412.29105.07240.54
E-0.302.410.04105.074.60

Overall loading

Equiv leeward net force for overall section; Fl = Fw,wE = 4.6 kN
Net windward force for overall section;  Fw = Fw,wD = 240.5 kN
Lack of correlation (cl.7.2.2(3) – Note);  fcorr = 0.85; as h/L is 0.267
Overall loading overall section; Fw,D = fcorr × (Fw – Fl + Fw,h) = 200.5 kN

References
(1) BS EN 1991-1-4: 2005, Actions on structures. General actions. Wind actions
(2) Stanton, T. E., 1908. Experiments on wind pressure. Minutes of the Proceedings of the Institution of Civil Engineers, 171, 175–200.

On the Design of RC Tension Columns

It is more common for reinforced concrete columns in a building to be in compression. This makes sense because, in a conventional load path of a building, gravity loads are transmitted through the columns to the foundation, which exerts an equal and opposite reaction on the column, thereby placing it in compression. For tension columns, the load is probably going somewhere else before being transmitted to the foundation. This is usually deliberate!

The most significant internal force associated with columns is the axial force, even though more often than not, columns are also subjected to bending moment and shear forces. Design equations and charts exist in almost all codes of practice for reinforced concrete columns subjected to compressive axial force, bending moment, and shear. However, when a concrete column is in tension, the approach is usually very cautious. It is advisable to avoid placing concrete columns in tension unless you cannot help it.

Concrete is very good in compression but weak in tension. For instance, for a block of concrete with a 28 days cylinder compressive strength of 25 N/mm2, we will expect the tensile strength to be about 2.6 N/mm2 (See Table 3.1 EN 1992-1-1:2004). In reinforced concrete design, we normally assume the tensile resistance of concrete to be zero unless we are dealing with serviceability issues such as cracking.

If a reinforced concrete column is to be in axial tension, the entire axial stress will be carried by the steel reinforcements, unlike when it is compression. The area of steel required to resist the tensile axial force will be given by;

Ast,req = Nt,Ed/0.87fyk

Where;
Ast,req = Area of steel required
Nt,Ed = Ultimate axial compressive force
fyk = characteristic yield strength of the reinforcement

However, this is not as simple and straightforward as it looks. For a concrete section subjected to a significant axial tensile force, cracking is going to be a major problem. As a result, additional reinforcements will be required to control the cracking, aside from the main reinforcements resisting the axial tension. The additional reinforcements will have to be caged as in the case of a wall reinforcement using smaller diameter bars. The column might have two layers of reinforcements; the inner layer for resisting the tensile force, and the outer layer for controlling the cracking (skin reinforcement).

The maximum bar diameter for the skin reinforcement can be estimated from equation 7.7N of EN 1992-1-1:2004 for members subjected to uniform axial tension;

φs = φ∗s(fct,eff/2.9)hcr/(8(h-d))

where:
φs is the adjusted maximum bar diameter
φ∗s is the maximum bar size given in Table 7.2N of EN 1992-1-1:2004
h is the overall depth of the section
hcr is the depth of the tensile zone immediately prior to cracking, considering the characteristic values of prestress and axial forces under the quasi-permanent combination of actions
d is the effective depth to the centroid of the outer layer of reinforcement

The discussion above has been based on the assumption that the tension column is subjected to pure axial force. However, what happens when there is bending and shear in the section? In that case, the interaction of axial force and bending will have to be considered, and this is expected to have an effect on the size of the tension column and the quantity of the reinforcements.

From the ongoing, it can be seen that structural steel or composite sections are the best for tension columns, provided the connection details are well designed by the structural engineer. The problem of cracking due to low tensile strength is the major challenge of constructing tension columns using reinforced concrete. However, if this can be overcome with the use of additional reinforcements, the problem can be solved at the expense of additional costs.

Furthermore, the reinforcements in tension columns must not be lapped and must be detailed in such a way that the reinforcement hooks and carries the load below it. For reinforcement continuity, mechanical couplers are expected to perform better than lapping.

Practical Applications of Tension Columns

Tension columns are usually floating columns, and transmit the load they are supporting to the member above them. This depends on the structural scheme adopted by the structural engineer. However, when tension columns are to be supported on the ground, uplift forces will have to be properly checked.

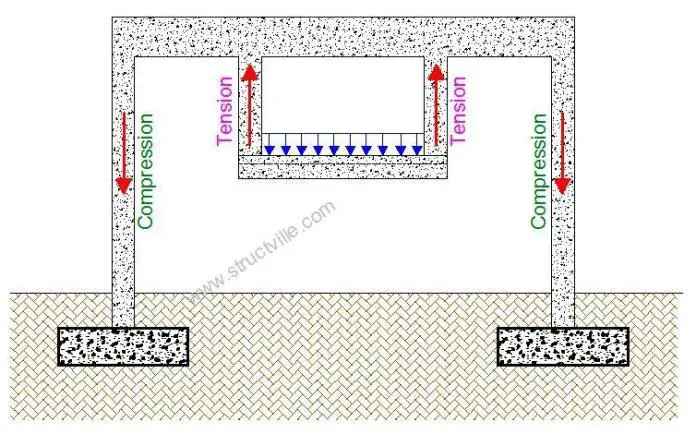
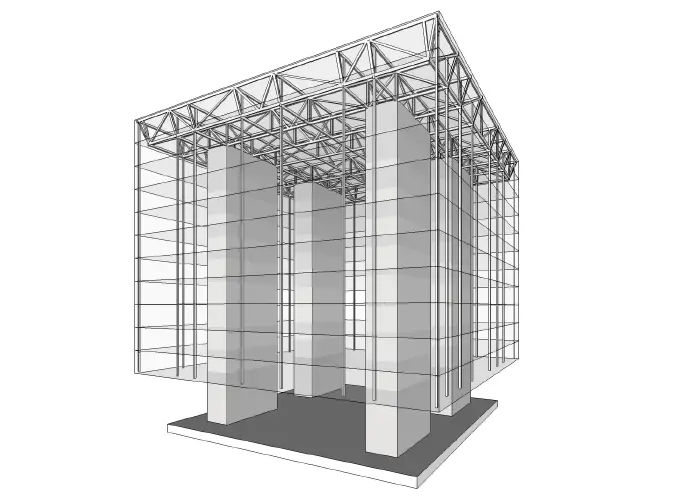
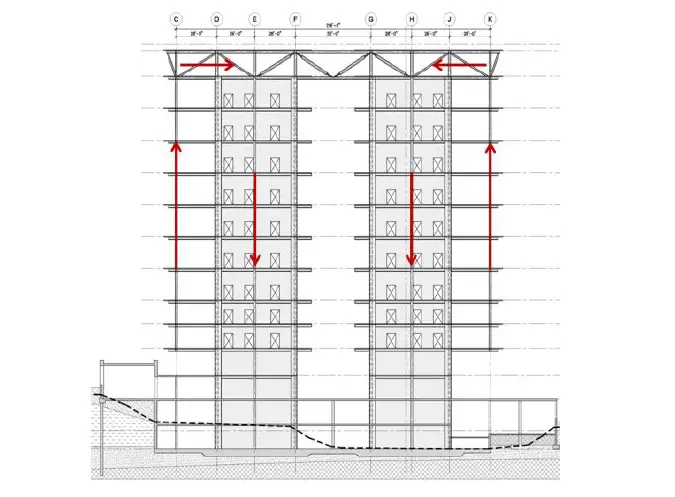
An example of the application of tension columns is in the United States Court House in Downtown Los Angeles. The building’s structural system is depicted in the diagram below. All of the columns are set around the perimeter of the structure, but they do not convey the load to the ground; instead, they take the load up. As a result, there is no compressive force applied to the columns.

couthouse building
3D Model of United States Court House (Source; Faizal Manzoor, 2020)
Building with tension column
Structural scheme and load path of the United States Court House (Source; Faizal Manzoor, 2020)

As can be seen above, the slab is not supporting the column’s weight; rather, it is hanging on to it. Therefore, the columns are subjected to axial tension due to the pull from the downward weight of the slab. The load is transferred from the slab to the column, which then passes through the roof truss, which is supported by shear walls. It is however important to note that steel columns were utilised in the construction described above.

Modelling of Soil-Structure Interaction

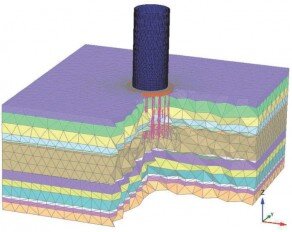
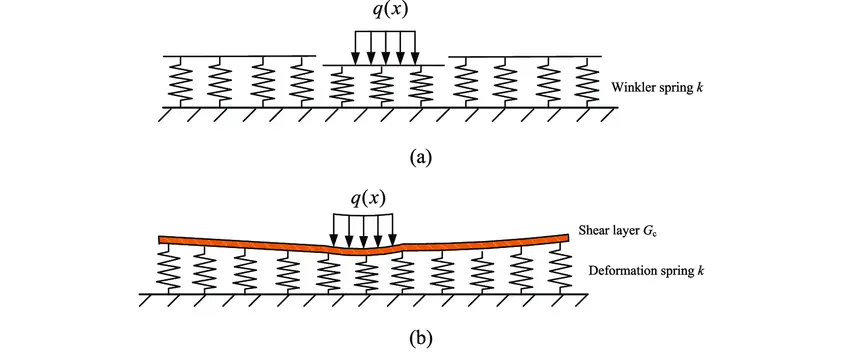
In civil engineering practice, two methods for modelling structure-soil interaction are commonly used. The beam/plate sitting on an elastic foundation is one way, while the continuum method, which employs finite element analysis (FEA), is another. These approaches take into account the soil and structure deformation.

The Winkler foundation model is connected to the beam/plate resting on an elastic foundation. The Finite Element Analysis (FEA) is a sophisticated method of calculating mechanical problems where the constitutive equation (stress – deformation relationship) determines the outcome of the finite element (FE) computation. Although the FEA is a more advanced method of modeling the interaction, it is still a complicated method that may require a large number of input parameters depending on the model. On the one hand, these input parameters are not always known ahead of time and can be difficult to determine. The Winkler model, on the other hand, just requires one parameter to model the structure-soil interaction.

Soil-structure foundation models can be created in one dimension, two dimensions, or three dimensions. Each of these models has its own set of boundary conditions, calculation method, and, ultimately, advantages and disadvantages when applied to civil engineering calculations.

Models in One Dimension

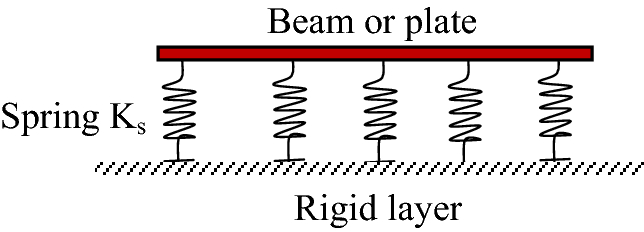
Analytical or numerical procedures can be used to calculate one-dimensional (1D) models. To characterize the system’s behaviour, an ordinary differential equation can be used which can be solved using the boundary conditions of the system (see analysis beams on elastic foundation). For example, suppose the classical beam theory is used to represent the plate and the Winkler model is used to model the soil (assuming that the soil behavior is entirely linear-elastic). When analyzing slender structures that sit on an elastic foundation, this method is frequently used.

beam on elastic foundation

This model has the advantage of taking less time, but it has the disadvantage of being overly basic when it comes to superstructures, particularly slabs. The stiffness parameters for the structure and soil are especially crucial because they are the only parameters in the model that describe the structure and soil medium.

Models in Two Dimensions

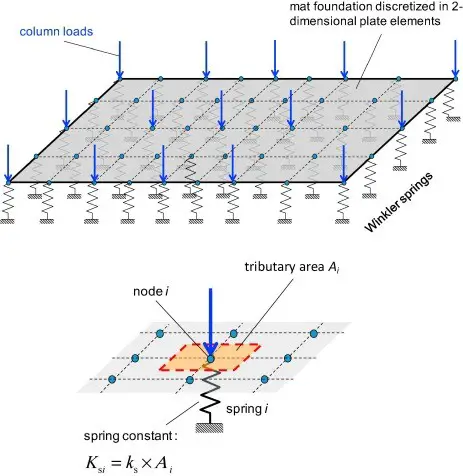
This 2D model gives the soil-structure interaction system another dimension and can be used to represent plate structures (see plates on elastic foundation). When using 2D elements in structural software, the soil-structure interaction must be taken into account.

plate on elastic foundation

Because of the additional dimension, this model gets near to matching reality. The output results are easy to understand. However, the interaction between the soil and the structure is still difficult to simulate in 2D spaces, which is a disadvantage.

Models in Three Dimensions

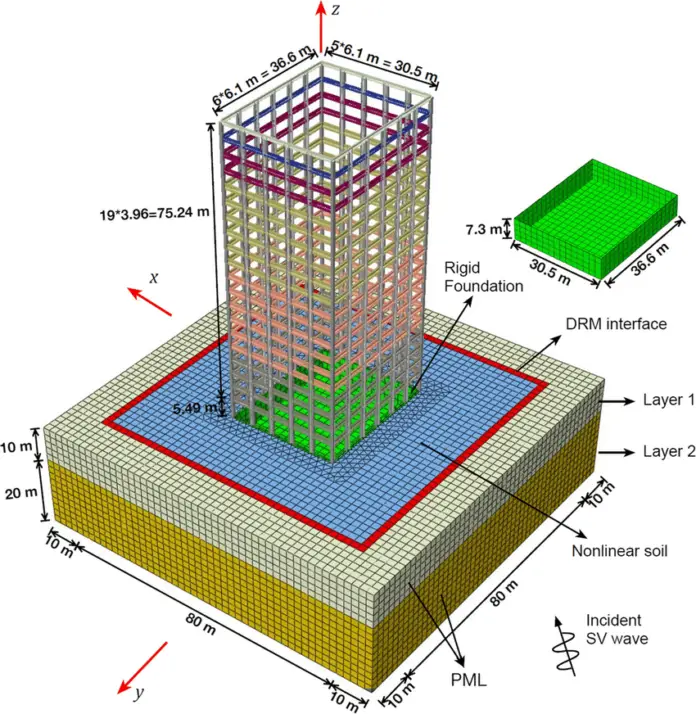
These models are the most accurate representations of reality. All of the dimensions are taken into account. Both the structure, foundation, and soil are modelled using three-dimensional elements.

3D SSI

These 3D models have the following advantages:
(1) More dispersal of the loads, which could result in material savings.
(2) Load interactions from several directions are considered.
(3) The model is more accurate.

The disadvantages are as follows:
(1) It is time-consuming (modelling, analysis, and interpretation).
(2) During the design process, not all parameters may be known.
(3) In comparison to a 2D model, the outcomes are more difficult to control.
(4) There is a possibility of apparent accuracy.

Modelling of Soils

For computational analysis, soils are modelled by making some idealisations and following some well-documented approaches which are discussed in the sub-sections below.

Winkler’s Model

The Winkler foundation concept idealizes the soil as a set of springs that displace as a result of the load applied to it. The model has a flaw in that it does not account for the interaction between the springs. Furthermore, a linear stress-strain behavior of the soil is also assumed in the model. This linear relationship simplifies calculations, but the truth is that soil does not exhibit linear elastic behaviour when loaded.

The Wikler model does not portray the settlement in a particularly accurate way, but it does provide an indication of what will happen in reality. The benefit of this model is that it only has one parameter to represent the soil (the modulus of sub-grade reaction, also known as the “k” parameter). This is why it is commonly referred to as a one-parameter model.

For Winklers Model,

p = wk

p = pressure
w = settlement
k = modulus of sub-grade reaction

Pasternak’s Model

Improved versions of the Winkler model have been developed to address the model’s weaknesses. The Pasternak foundation model is one of these variations. The major difference is that the springs in Pasternak’s model are connected to one another. To account for this, it includes an additional factor in addition to the ‘k’ factor, hence this model is also known as a two-parameter model. The word for this is “the Gp parameter.” This parameter physically describes the contact between the spring elements due to shear action. When compared to a one-parameter model, the displacement of the model with this extra parameter can be more realistic.

Winkler and Pasternak foundation models a Winkler foundation model and b Pasternak

The differential equation is:

p = wk – (Gp)d2w/dx2
p = pressure
k = modulus of sub-grade reaction
Gp = shear modulus of the shear layer

The shear modulus (G) is related to the Gp value, however they are not the same. In a three-dimensional space, their dimensions, G is kN/m2 and Gp is kN/m, show that they are not the same. Gp is G times the effective depth of shearing in the soil. There isn’t a lot of literature or theory on this Gp parameter. Gp is an interaction parameter, according to the available and consulted publications on the Pasternak foundation model. The interaction of the springs is taken into account with this parameter. With this additional parameter, the Winkler model’s flaw is improved. This parameter physically describes the contact between the spring parts owing to shear action.

Soil-Structure Interaction

The difference in stiffness between the structure and the soil can be used to explain the soil-structure interaction. A flexible slab foundation, for example, has the largest settlement in the centre and uniformly distributed contact stresses and low moments. On the other hand, the length of a rigid slab foundation settles uniformly. The contact stresses are higher at the edge because the soil acts more stiffly there since the load can spread there. As a result, the slab’s contact stress has a parabolic shape, with maximum stresses at the edge and minimal values in the centre. The stiff slab’s bending moment is substantially greater than that of a flexible foundation slab.

The interaction between soil and foundation is caused by the linear elastic behavior of the foundation slab and the non-linear elastic behavior of the soil. The difference in stiffness, on the other hand, is the cause of the interaction between structure and soil and can be utilized to explain it.

A method for determining a system’s stiffness category is offered in the literature. The stiffness ratio (kr) can be used for this purpose;

kr = Et3/12EsL3

kr = stiffness ratio
E = young’s modulus of the slab
Es = young’s modulus of the soil
t = thickness of the slab
L = length of the slab

The terms t and L can be straightforwardly determined by the designer, while E and Es can be determined experimentally or using correlations.

For a kr ≤ 0.01 the structure may be defined as flexible and for kr > 0.1 the structure may be defined as stiff.

According to Annex G of EN 1992-1-1:2004, the column forces and the contact pressure distribution on the foundations are both influenced by relative settlements. For general design purposes, the problem can be solved by ensuring that the soil and structure’s displacements and accompanying reactions are compatible.

If the superstructure is considered flexible, then the transmitted loads do not depend on the relative settlements, because the structure has no rigidity. In this case, the loads are no longer unknown, and the problem is reduced to the analysis of a foundation on a deforming ground. If the superstructure is considered rigid, then the unknown foundation loads can be obtained by the condition that settlements should lie on a plane. It should be checked that this rigidity exists until the ultimate limit state is reached.

An analysis comparing the combined stiffness of the foundation, superstructure framing components, and shear walls with the stiffness of the soil can be used to calculate the approximate rigidity of the structural system. Depending on the relative stiffness KR, the foundation or structural system will be considered rigid or flexible. For building structures, expression (G1) of EN 1992-1-1:2004 can be used:

KR = (EJ)S / (EL3)

where:
(EJ)S is the approximate value of the flexural rigidity per unit width of the building structure under consideration, obtained by summing the flexural rigidity of the foundation, of each framed member and any shear wall
E is the deformation modulus of the ground
L is the length of the foundation

Relative stiffnesses higher than 0.5 indicate rigid structural systems.

Overexcavation and Replacement of Expansive Soils

To reduce soil heave under a foundation or subgrade, expansive soils can be overexcavated and replaced with nonexpansive or treated soils. In this approach, the expansive soil is excavated to an adequate depth to reduce heave, and then replaced with properly treated and compacted fill up to grade.
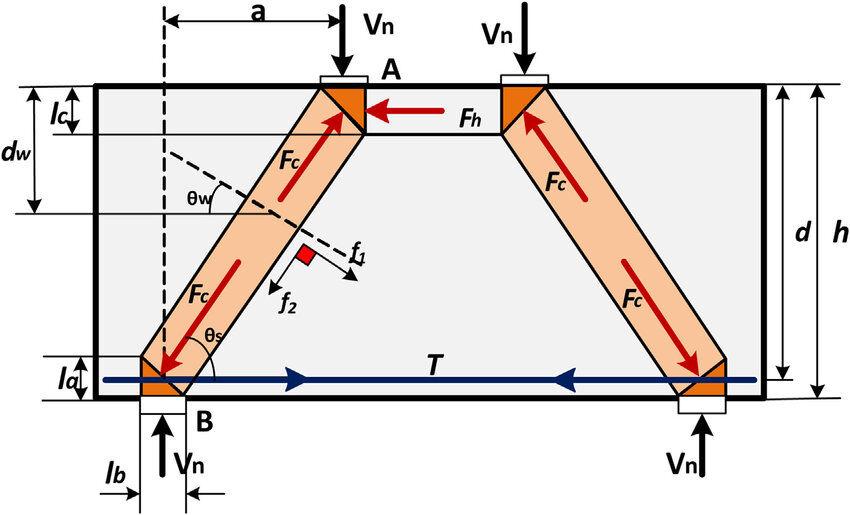
The required depth of removal, as well as the volume, location, and cost of the fill, must all be considered. The depth of soil that must be removed is determined by the overall soil profile, the nature of the fill material, and the amount of heave that may be tolerated. A stiff layer of compacted low to nonexpansive fill has the added benefit of tending to even out variations in the heave of the underlying native soil, thereby eliminating differential heave.

In the absence of suitable nonexpansive fill around the area, moisture-conditioning and compaction control can be used to change the swell properties of the expansive soils on-site. Compacting the material to a lower density at the wet side of the optimum moisture content will minimize the expansion potential, but care must be taken to ensure that the recompacted soil is densified well enough to avoid settlement. Chemical additives can be utilized in conjunction with moisture-conditioning in some cases.

expansive soil
Typical behaviour of an expansive soil

However, if the expansive soil layer extends to a depth that makes total removal and replacement prohibitively expensive, appropriate soil tests and studies should be carried out to design the overexcavation and assess the projected potential heave after the overexcavation and recompaction procedure. The expected heave must be factored into the depth of overexcavation design.
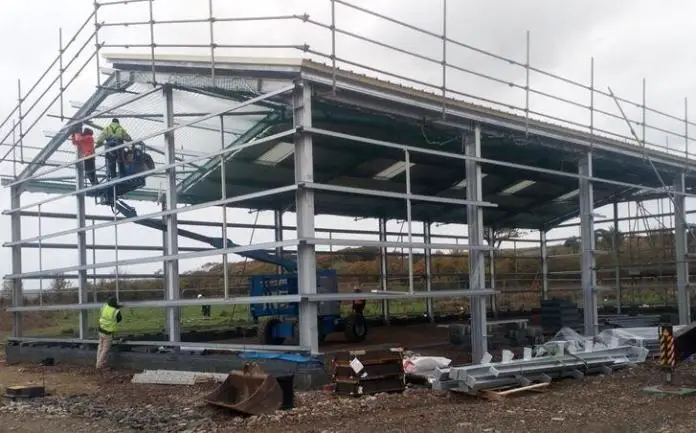
Chen (1988) suggested a maximum overexcavation depth of 3 to 4 feet (1 to 1.3 meters), but these depths have been oberved to be ineffective for sites with highly expansive soils. Thompson (1992a and 1992b) studied some insurance claims and found that if there was 10 feet (3 meters) or more of nonexpansive soil beneath the footings, the frequency of claims was lower than at shallower depths. Overexcavation depths of 10 ft (3 m) or more have been specified regularly in Thompson’s works. In certain situations, the top 20 feet (6 meters) of soil have been excavated, moisture-conditioned, and recompacted in place.

Water content changes in the underlying expansive soil layers can be controlled by overexcavation and replacement. The majority of the seasonal water content variation will occur in the top few feet of soil. However, if the underlying soil has a high potential for expansion, the overexcavated zone may not be enough to prevent surface heave or shrinkage. If the underlying expansive soil gets wet, it might cause uncontrollable movement. Some of the potential water sources are impossible to forecast or control. As a result, the design engineer must consider that such events might occur during the structure’s lifetime and make appropriate design decisions.

Overexcavation and Replacement of Expansive Soils
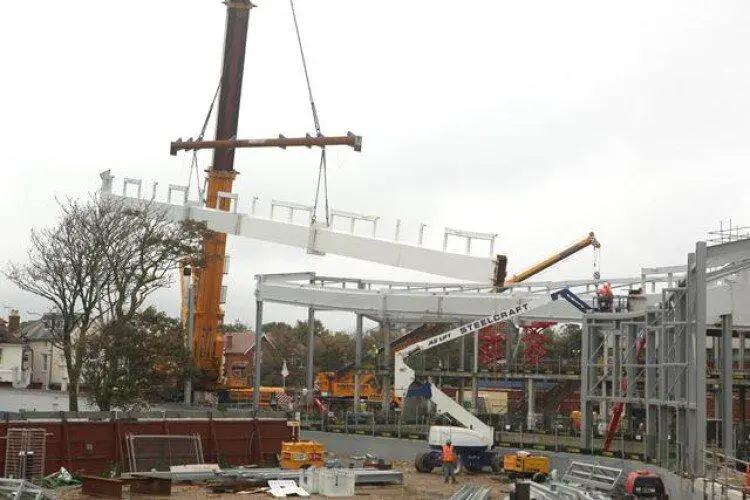
Overexcavation and Replacement of an expansive soil

Furthermore, water collection in the overexcavation zone must be avoided at all costs. The use of permeable granular fill as a replacement fill is not suggested. Highly permeable fill will allow water to flow freely and create a reservoir for it to collect in. The ‘bathtub effect‘ is a term used to describe this phenomenon. Seepage into expansive subgrades or foundation soils will occur as a result of this situation. Any fill material that is impermeable and nonexpansive is therefore more preferable. If granular material is required, permanent, positive drainage and moisture barriers, such as geomembranes, should be installed to prevent moisture from infiltrating this zone.

The removed and recompacted material is expected to have a higher hydraulic conductivity than the underlying in situ soils and bedrock, even without granular soil. Groundwater can be intercepted using an underdrain system installed at the bottom of the overexcavation zone. Care must be taken to ensure that the drain has positive drainage and that it does not just concentrate water in an area where it would cause increased soil wetting and heave.

Advantages of Overexcavation and Replacement

The following are some of the benefits of overexcavation and replacement treatment:

• Because soil replacement does not require special construction equipment, it might be less expensive than other treatment options.
• Soil treatment additives can be mixed in a more equal manner, resulting in some soil improvement.
• Overexcavation and replacement may cause construction to be delayed less than other processes that need a curing period.

Disadvatantages of Overexcavation and Replacement

The following are some of the disadvantages of overexcavation and replacement methods:

• The expense of nonexpansive fill with low permeability can be high if the fill must be imported.
• If the recompacted on-site soils demonstrate intolerable expansion potential, removing and recompacting the on-site expansive soils may not be enough to limit the danger of foundation movement.
• The recompacted backfill material’s needed thickness may be too considerable to be practicable or cost-effective.
• If the backfill material is overly permeable, the overexcavation zone could act as a reservoir, storing water for the foundation soils and bedrock over time.

If overexcavation and replacement are ineffective on their own, they can be combined with other foundation options. It may be conceivable to employ a rigid mat foundation instead of a more expensive deep foundation if the potential heave can be suitably mitigated. The needed length of the piers may also be lowered when used in conjunction with a deep foundation.

References
[1] Chen, F. H. 1988. Foundations on Expansive Soils. New York: Elsevier Science.
[2] Thompson, R. W. 1992a. “Swell Testing as a Predictor of Structural Performance.” Proceedings of the 7th International Conference on Expansive Soils, Dallas, TX, 1, 84–88.
[3] Thompson, R. W. 1992b. “Performance of Foundations on Steeply Dipping Claystone.” Proceedings of the 7th International Conference on Expansive Soils, Dallas, TX, 1, 438–442

Improvement of Interlayer Mechanical Properties of Mass Concrete

Recent research carried out at the Zhengzhou University of Technology, China has offered more insight into the improvement of interlayer mechanical properties of mass concrete. The study was published in the International Journal of Concrete Structures and Materials.

During the construction of mass concrete structures such as gravity dams, concrete is poured in layers. This can be as a result of a lapse in mixing and placement time, ease of construction, possible re-use of formworks, etc. As a result, the interlayer of the concrete (joint between the new and old concrete) becomes a potential weak point that is very susceptible to cracking. A structure’s durability and stability will be severely affected if interlayer bonding characteristics deteriorate. Hence, to maintain the structure’s safety, the interlayer bonding quality of mass concrete must be closely controlled.

The chemical bonding force of cementitious materials and the degree of mutual embedding of aggregates determine the interlayer bonding strength of concrete. According to research, the interlayer bonding strength of concrete can be ensured by pouring the upper layer of concrete before the initial setting time of the lower layer (substrate).

The interlayer bonding characteristics of mass concrete are therefore heavily influenced by the interval time between the placement of new concrete on old concrete. Parameters such as compressive strength, interlayer splitting tensile strength, shear strength, and impermeability of concrete reduce with an increase in interval time according to many research works. Temperature, relative humidity, and wind speed are additional important parameters that influence the quality of mass concrete construction.

As a result, researchers (Song, Wang, and Lui, 2022), carried out research focusing on the effect of harsh environmental conditions on the quality of mass concrete construction, with emphasis on the interlayer properties and cracking. The concrete layer condition and interlayer splitting tensile strength were tested in harsh situations (high temperature, strong wind, steep temperature decline, and short-term heavy rainfall).

Leaking tank 1
Fig. 1: Cracks in a concrete wall

Secondly, the cracking risks of concrete in extreme weather were evaluated (coupling of high winds and dry heat, strong winds and cold waves, and short-term heavy rainfall). Finally, effective strategies to deal with construction risks during harsh weather conditions were proposed by the authors. The strategies considered were covering the concrete with an insulation quilt, artificial introduction of grooves on the old concrete, and addition of Polyvinyl alcohol (PVA) fibres.

From the study, it was observed that under harsh weather conditions, the interlayer mechanical characteristics of concrete reduced significantly (high temperature, strong wind, a steep descent in temperature, and short-time heavy rainfall).

For instance, under high temperatures (40 deg celsius), the water content of the cement mortar decreased gradually with time, while the penetration resistance increased continuously. However, when the concrete sample was covered with an insulation quilt, the water content was closer to the designed water content of 133 kg/m3. Generally, the results showed that in a high-temperature setting, covering an insulating quilt can reduce mortar water loss and lower penetration resistance of concrete specimens to a degree.

The study, therefore, showed that the interlayer bonding strength of concrete can be improved by covering it with an insulation quilt. The reason for this is that an insulation quilt can lessen the impact of the external environment on concrete, resulting in less water evaporation and a slower setting rate. Artificial grooves can also help to strengthen interlayer bonding. This is due to the artificial grooves increasing the roughness of the lower layer of concrete and improving the mutual embedding degree of the upper and lower layers.

Interlayer Mechanical Properties of Mass Concrete
Fig. 2: Cracking of concrete surface under the coupled conditions of wind, dryness, and heat (Song, Wang, and Lui, 2022).

Furthermore, under harsh weather conditions (coupling of strong winds and dry-heat, strong winds and cold waves, and short-time heavy rainfall), mass concrete has an increased risk of cracking. Concrete cracking can be efficiently prevented by using an insulation quilt (see Figure 2). It is mostly due to the insulation quilt’s ability to prevent water evaporation, resulting in a significant reduction in water loss shrinkage stress. Furthermore, the high water content fully hydrates the cement and enhances early tensile strength, which is beneficial to the anti-cracking properties of concrete at an early stage.

Finally, the addition of Polyvinyl alcohol (PVA) fibers to the concrete can help to prevent the formation and propagation of microcracks. This is due to the fact that PVA fibers can resist some of the tensile stress induced by moisture loss and shrinkage, as well as play a role in crack resistance and bridging. As a result, PVA fiber concrete can be put into important portions of concrete dams to improve the dam’s crack resistance.

References

Song H., Wang D. and Liu WJ (2022): Research on Construction Risks and Countermeasures of Concrete. Int J Concr Struct Mater (2022) 16:13 https://doi.org/10.1186/s40069-022-00501-3