8.7 C
New York
Monday, October 28, 2024
Home Blog Page 14

Design of Filters

Filters are essential for earthen constructions such as dams to be protected against seeping groundwater. A lot of literature on geotechnical engineering contains a number of empirical design criteria for filters that were created based on experimental research and prior engineering knowledge.

In the past, earth layers of various gradations or sizes were predominantly used to create filters. However, geotextile filters are increasingly widely used because of their low cost and relatively simple construction.

Filters
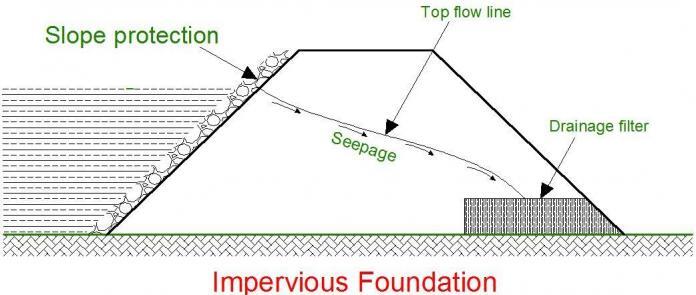
Figure 1: Filters in earthen structures

Applications of Filter Materials

An impermeable or permeable wall can be used to enclose the excavation in saturated soil. The pressure on an impermeable wall can be two to three times higher than on a permeable wall, on which only the effective earth pressure is acting.

On the contrary, both the earth pressure and the water pressure act on an impermeable wall. The pressures on the wall can be reduced by lowering the water level behind it, such as through pumping wells or drainage into the excavation pit. However, the in-situ soil surrounding the excavation is subjected to a hydraulic gradient as a result.

For internally unstable soils, the flow forces generated by this hydraulic gradient might result in the transport of fine soil particles into the skeleton of coarse soil particles. Unless the surface is protected with a filter and drainage material, the soil can erode at the surface where the water exits the soil body, such as at the pumped drainage well or at other drainage locations.

Whenever there is an impounded reservoir, a hydraulic gradient and water pressure are imparted to the soil foundation. The effective stresses and resulting soil strength are decreased by the elevated hydrostatic water pressure. The soil particles are subjected to flow forces by the imposed hydraulic gradient, which can lead to erosion at the soil body’s surface or within the soil’s skeleton, where water seeps out of the ground.

The erosion of soil particles will be stopped, and the effective stress will be raised, by adding a layer of filter material beneath a layer of drainage material at the water outlet.

image 54
Figure 2:Filters in earth dam

Because water reduces the effective stress and consequently the shear strength of the soil and applies stresses when water is moving through the soil, it has a significant impact on the stability and erosion resistance of both natural and artificial soil structures.

The stability of structures erected on or in soil is therefore improved by draining the water out of the soil structures. The soil must be drained, nevertheless, in a controlled manner. Particles within the soil skeleton or near the surface cannot be eroded by hydraulic gradients and the flow forces that result. This is ensured for natural soils by restricting the hydraulic gradient. Filter zones built into the soil structure are used to control erosion for man-made constructions.

Design of Filters

The following six factors are taken into account when designing filter materials:

(a) Filter ability
(b) Internal stability
(c) Self-healing
(d) Material segregation
(e) Drainage capacity
(f) Material durability

image 51
Figure 3: Filter and drainage criteria from Terzaghi & Peck (1948)

Filter Ability

To design soil filters, the U.S. Army Corps of Engineers (Huang, 2004) set out some criteria. These criteria are based on the particle sizes that, according to the particle size distribution curve, correspond to specific weight percentages of the protected soil and the filter material.

Clogging criterion:
To ensure that the protected soil does not clog the larger particles of the filter, the following criterion must be satisfied by the relative sizes;
D15,filter/D85,soil ≤ 5.0

Permeability criterion:
To ensure that water passes through the filter system without building up excess pressure, the following criterion is recommended;
D15,filter/D15,soil ≥ 5.0

Additional criterion:
U.S. Army Corps of Engineers also recommends the following additional criterion;
D50,filter/D50,soil ≤ 25.0

Based on the above equations, one can design a satisfactory filter system when the particle size distributions of the relevant soil samples are available.

Bertram (1940) proposed the criterion D15,filter/D85,soil ≤ 6 for soil filters based on laboratory investigations. This filter criterion was later modified to D15coarse-side,filter/D85fine-side,soil ≤ 4.

A drainage criterion of D15fine-side,filter/D85coarse-side,soil ≥ 4 was added by Terzaghi and Peck (1948)(See figure 3).

Internal Stability

When a filter material is internally stable, it prevents small soil particles from moving due to the forces of water flow. Even for water flow at high (>>1) hydraulic gradients, as happens at a fracture in the sealing zone of an embankment, all soil particles ought to stay in place. For instance, Kenney & Lau (1985) provide a useful definition of internal stability as the capacity of a granular material to avoid the loss of its own microscopic particles as a result of disturbing forces like seepage and vibration.

The filter material’s gradation curve is split into two curves at a chosen grain diameter (dS), gradation curves for the sections finer and coarser than dS, respectively, in this technique, also known as the “retention ratio criteria.” The Terzaghi filter criterion is used to compute the retention ratio (RR) for the two gradation curves: RR = D15,filter/D85,soil. This is repeated for various dS values. If all grains meet the criteria RR  ≤  7-8 rounded grains or RR  ≤ 9-10 for angular grains, they are all regarded as stable.
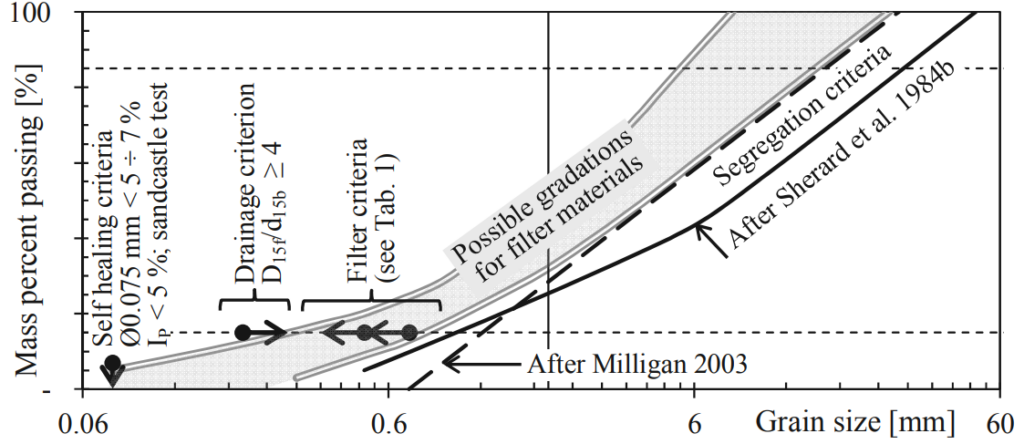
image 52
Figure 4: Summary of filter criteria

Self Healing

Self-healing means that when there is water flow, cracks that could develop in the filter zone owing to things like differential settlement, etc., close instead of remaining open. Therefore, cohesion cannot exist in the filter material. By limiting the amount of non-plastic (IP < 5%) fines to under 5%, this is ensured. The sand-castle test (Vaughan & Soares 1982) attests to the filter material’s compliance with the self-healing specifications.

Material Segregation

The filter zone can no longer serve its purpose of preventing fine particles from moving from the core to the filter zone or within the filter zone when the filter material segregates, meaning that the coarser particles separate from the finer particles. This is because the segregated coarse-grained components do not form a filter to the adjacent materials. Therefore, it is necessary to prevent the segregation of filter elements. Most experts concur that a high sand content and a small maximum grain size lessen segregation.

Drainage capacity

The Terzaghi criterion D15,filter/D85,Soil ≥ 4 still applies and Sherard recommends D15,filter ≥ 0.2 mm.

Material Durability

Standard tests like the Los Angeles abrasion test (ASTM C535) or the wet and dry strength variation (typical limit 35%) are frequently used to examine the durability of filter materials. For significant dam structures, mineralogical and chemical analysis of the dam material is suggested This can show whether the substance contains inclusions of (i) swellable clay minerals or (ii) water-soluble minerals, such as gypsum or carbonate rocks.

In addition to dissolving, more recent materials can also re-cement at particle interactions and produce real cohesiveness. Dam filter materials containing carbonate and sulfide should be handled carefully.

Conclusion

The stability and erosion resistance of both natural and artificial soil structures are significantly influenced by water. The stability of the soil structure is increased by draining the water out of it. The soil must be drained, nevertheless, in a controlled manner to prevent erosion. Filter materials positioned inside or on top of the soil structures are used to achieve this.

Filter materials must possess specific properties that are detailed by filter criteria, which has undergone significant progress in recent decades. These filter criteria currently consist of six distinct sections, and each of these criteria has been discussed in this article.

Conceptual Design of Earthquake-Resistant RC Buildings

The rational conceptual design of earthquake-resistant RC buildings involves the design of a structural system in such a way that the lateral seismic actions (inertia forces) are transferred to the ground without excessive rotations of the building and in a ductile manner is one of the fundamental factors influencing the proper seismic behaviour of a building.

The requirements of the design code alone cannot do this. As a result, there are some general principles that, when followed in the planning and conceptual design of the building, can significantly improve the seismic resistance of the building.

According to Penelis and Penelis (2014), 29 of the 103 reinforced concrete buildings in Athens that were the most severely damaged or collapsed following the Parnitha earthquake (September 7th, 1999) were found to have failed mostly as a result of their inadequate configuration. This was mostly ascribed to the architect and structural engineer not working together early in the planning process, when a suitable compromise could have been struck.

Conceptual Design of Earthquake-Resistant RC Buildings

According to Penelis and Penelis (2014), the guidelines that should govern a conceptual design against seismic hazard according to EN 1998-1:2004 (Eurocode 8) are:

• Structural simplicity
• Uniformity and symmetry
• Redundancy
• Bidirectional resistance and stiffness
• Torsional resistance and stiffness
• Diaphragmatic action at storey levels
• Adequate foundation

Structural Simplicity

A core objective of the conceptual design must be the design of simple structural systems with clear load paths for transmitting gravity and seismic loads from the structural components to the foundation. It should be highlighted that the analysis and design results for a simple structural system are far more reliable than those for a sophisticated one. A plan of a few simple structural systems is shown in Figure 1.

Earthquake-Resistant RC Buildings
Figure 1: Structural systems characterised by simplicity: (a) a typical form of a frame system; (b) a typical configuration of an R/C shear wall system; (c) a dual system with an R/C core and frames (Source: Penelis and Penelis, 2014)

Regularity of structure in plan and elevation

Buildings with regular plans and elevations, without re-entrant corners and discontinuities in the vertical stresses transferred to the ground, behave well during earthquakes. Irregularities in the building plan can lead to dangerous stress concentrations for the structure. In this instance, seismic joints may be used to partition the entire building with re-entrant corners into separate seismic compact portions, if necessary (Figure 2).

For sound seismic behaviour, uniformity in height and stiffness distribution is essential. Discontinuities in deck diaphragms or construction features with re-entrant corners, or discontinuities in load transfer to the foundation with walls or columns “planted on” beams and discontinued below, are warning signals for the behavior of the building in case of a large earthquake (Figure 2).

image 45
Figure 2: Unfavourable and favourable configuration in elevation (Source: Penelis and Penelis, 2014)

A special attention should be paid to this direction so that torsionally flexible or asymmetric structures, which can lead to failures of the corner columns and the walls at the perimeter, will be avoided. This is true even though the symmetrical arrangement of stiffness elements is not always possible due to architectural constraints.

image 46
Figure 3: Distribution of mass and stiffness in elevation (Source: Penelis and Penelis, 2014)

Arrangement of Structural Walls

Reinforced concrete structural walls should span the whole space between two adjacent R/C columns if there are any voids between them. This increases the structure’s stiffness, strength, and ductility (Figure 4).

image 47
Figure 4: Layout of shear walls at the perimeter (a) acceptable arrangement, (b) improved arrangement (Source: Penelis and Penelis, 2014)

Redundancy in the structure

To create a robust monolithic structure with a high level of redundancy, all structural components, including the foundation, should be strongly connected. The building’s perimeter high-stiffness cores (staircases and shafts) might readily break from the diaphragmatic system during an earthquake, causing the structure to react in an unanticipated way.

Avoidance of short columns

Avoid using short columns below the windows that may be caused by the presence of mezzanines, stiff masonry, or R/C parapets. If such arrangements cannot be avoided, consideration should be given to how they will affect the structure’s behaviour in terms of load effects, ductility, and shear capacity (Figure 5).

image 48
Figure 5: Concentration of large shear forces on short columns at the perimeter of the building (Source: Penelis and Penelis, 2014)

Avoid using flat slabs as main structural frames

Despite being relatively attractive in terms of construction due to the low cost of formwork and the available space at story for the installation of building services ducts, flat slab systems without beams should be avoided as they are not entirely covered by EN 1998-1:2004. This does not imply that they cannot be utilized in conjunction with structural walls, cores, or frames that can withstand seismic events.

Avoid having soft storeys

Avoid having large discontinuities in the elevation of the infill system, (such as open-ground stories as shown in Figure 6). This kind of stiffness discontinuity creates a soft storey mechanism that is extremely susceptible to collapsing.

Special precautions should be taken in the analysis and detailing of the structural walls and columns in the event that this type of structure cannot be avoided, as is the case in the majority of Mediterranean countries where the General Building Code requires an open storey at the ground level (Pilotis system).

image 49
Figure 6: Pilotis building (by the right)

Diaphragm Behaviour

The system of the floors and roof of a multistorey building constitutes the basic mechanism for transfer of inertial seismic forces from the slabs of the building where the masses are distributed to the vertical structural members (columns and structural walls) and thereby to the foundation. In addition, the slab system, particularly in cast-in-place R/C buildings, guarantees that each storey deck will behave as a hard disc in plane, or a horizontal diaphragm, while being flexible in the vertical direction.

The storey diaphragms contribute to the system’s increased redundancy in this way. It is clear that using R/C buildings cast in place makes it very simple to produce this 3D structure with high redundancy. There is obviously no chance of structural failure of the diaphragms in an R/C building with a compact form in plan.

But the diaphragmatic function could fail if the structural system has high-stiffness R/C cores at the edge of its perimeter, if there are re-entrant corners in the plan, or if there are very large floor openings. For these reasons, special attention must be paid to the analysis and design of the diaphragm itself (i.e., the analysis and design of the slab as a disc in-plane under the action of the inertial forces and the shear reactions of the vertical structural members on the disc).

Bidirectional stiffness and resistance

Since seismic action can occur in any direction, the structural elements should be arranged in an orthogonal in-plan structural pattern to ensure similar resistance, stiffness, and ductility in both main directions (bi-directional function). In this situation, the structure must be able to withstand any excitation thanks to its two orthogonal components.

Strong columns and weak beams

For capacity design purposes, structures must be made up of weak beams and strong columns, as this performs better during earthquakes. This concept ensures that plastic hinges will develop in the beams, and not the columns.

Offering a second line of defence

It is advised to add a second line of defence made up of ductile frames to the structural system in parallel with the shear walls. Therefore, it appears that the dual system (structural walls and ductile frames) is most suited to withstand seismic action. Independent of the findings of the investigation, ASCE 7-05 mandates that these frames must support 25% of the seismic actions. It should be emphasized that EN 1998-1:2004 does not prescribe such a requirement; rather, the structural system is upgraded insofar as its factory behaviour is concerned if the frames resist for more than 35% of the base shear.

Adequate foundation system

The behaviour of the building in reaction to seismic events is significantly influenced by the foundation. It should be noted that reinforced concrete is virtually always used for the foundation, regardless of the material used for the superstructure.

Article Source:
Penelis G. G. and Penelis G. G. (2014): Concrete Buildings in Seismic Regions. CRC Press Taylor & Francis Group

Point of Contraflexure in Structures

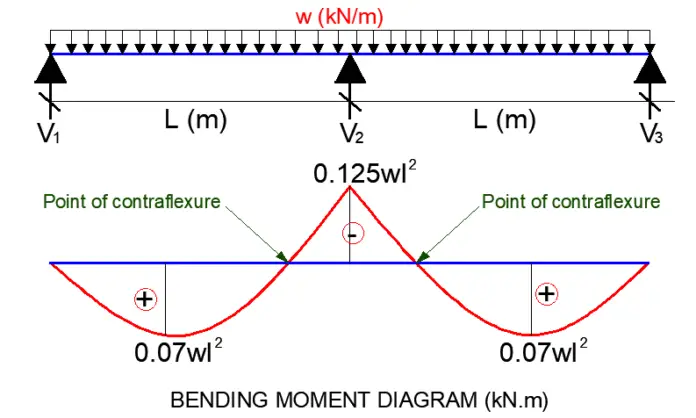
A point of contraflexure in a structure is the point where the bending moment changes signs from positive to negative (and vice versa). In other words, it is a point where the nature of the bending moment transitions from sagging to hogging. The value of the bending moment at any point of contraflexure is zero.

For a section under a sagging moment, the bottom fibre of the member is under tension, therefore, reinforcements should be provided at the bottom of the section. For a section under a hogging moment, the top fibre is in tension, and reinforcement should be provided at the top. Therefore, the point of contraflexure provides good information on how reinforcements should be arranged in reinforced concrete structures.

There is no predetermined formula for determining the exact location where the point of contraflexure will occur in a structure. The location of the point of contraflexure on a structure depends on the type of load, loading arrangement, location of supports, and types of members. The easiest way to determine the point of contraflexure in any structure is to determine the equation for the bending moment, and equate it to zero. When the x-term (distance) in the equation is solved, the point of contraflexure is readily obtained.

[themoneytizer id=”98693-1″]

Contraflexure in beams

In simply supported beams, there is no point of contraflexure since the entire beam is expected to be sagging when subjected to any lateral load. However, when an overhang is introduced to a simply supported beam, a point of contraflexure will be developed as the bending moment transitions from hogging at the cantilever area, to sagging in the span area. Once again, the loading configuration and loading locations affect how the point of contraflexure will behave.

Let us consider the simply supported beam with overhang loaded as shown below;

image 40

∑MB = 0
6VA – (15 × 62)/2 + (15 × 1.52)/2 = 0
VA = 42.1875 kN

∑MA = 0
6VB – (15 × 7.52)/2 = 0
VB = 70.3125 kN

If we cut a section x-x along the span, the bending moment equation along the span is given by;

image 42

Mx = 42.1875x – 15x2/2 = 42.1875x – 7.5x2

We can obtain the point of contraflexure by equating the above equation to zero;

Mx = 42.1875x – 7.5x2 = 0

Solving quadratically;
x = 5.625 m

Therefore, the point of contraflexure occurs at 5.625m from support A.

The maximum bending moment can be obtained by differentiating the bending moment equation (to obtain the equation for shear), and equating it to zero;

N/B: The maximum bending moment occurs at the point of zero shear.

∂Mx/∂x = 42.1875 – 15x = 0

Therefore; x = 2.8125 m
Mmax = 42.1875(2.8125) – 7.5(2.8125)2 = 59.3 kNm

Bending moment at support B;
MB = 42.1875(6) – 7.5(6)2 = -16.875 kNm

image 43

For continuous beams that are supported on pinned supports, it is expected that the hogging moments will occur at the intermediate supports, while the sagging moments will occur at the spans. Therefore, the points of contraflexure occur very close to the intermediate supports.

image 39

When a beam is fixed at one end, it is also expected that a point of contraflexure occurs close to the fixed support, as the bending moment transitions from hogging at the fixed support, to sagging in the span.

Contraflexure in frames

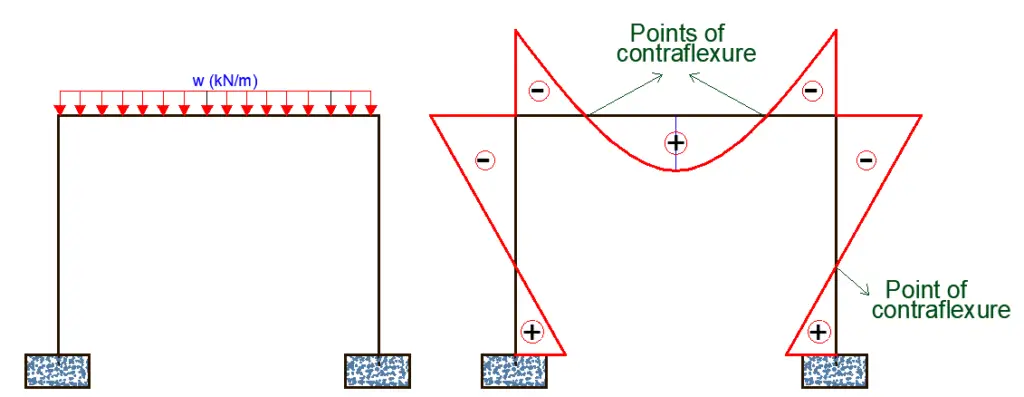
The point of contraflexure in frames is more complex than in beams. When the column of a frame is supported on a fixed support, a point of contraflexure is expected on the column. However, if the column is supported on a pinned support, there may be no point of contraflexure unless there is a lateral load on the column.

point of contraflexure in frame

On the beams of a frame, points of contraflexure are also expected because of the inherent hogging moment that exists at the beam-column junctions of rigid frames. When the bending moment transitions from hogging at the beam-column junction to sagging at the beam spans, a point of contraflexure develops.

When carrying out approximate analysis of framed structures, the point of contraflexure for columns is usually assumed to occur at the mid-point, as a known point of zero bending moment.

Significance of the point of contraflexure

Points of contraflexure are very significant in the design of steel structures and reinforced concrete structures.

Reinforced Concrete Structures

In reinforced concrete structures, the points of contraflexure provide information on where the top reinforcements should be curtailed. For instance, it is reasonable to stop the top reinforcement at the support of beams at the point of contraflexure. In the detailing guidelines of beams, this is taken as 0.25L, while in the detailing of slabs, this is taken as 0.3L, where L is the length of the span.

Furthermore, since the bending moment at the point of contraflexure is zero, it could serve as a very good point where tension bars could be lapped without any serious consequences. This however should be used with caution since the actual loading in real-life structures can vary considerably. It is advisable to follow the detailing guidelines in the code of practice.

Steel Structures

The point of contraflexure also plays an important role in the design of steel structures. For instance, in the design of portal frames, the point of contraflexure can provide the needed information for the length of the haunches, which provides increased stiffness at the column-rafter junction. It may also be desirable to locate splices and joints at the point where the bending moment is zero, so as to have more economical joints.

The point of contraflexure and the shape of the moment diagram plays an important role in the design of steel structures for lateral torsional buckling.

Live Loads (Imposed Loads) on Buildings

Live loads are loads produced from the use and occupancy of a building. They include the loads from human occupancy, furniture, vehicles, anticipated rare events such as the gathering of people and stacking of materials, moveable machines and equipment, storage, maintenance activities, etc. The values of live load for each type of building are usually defined by the codes of practice, and that is why the use of any structure must be defined before the design is commenced.

Live loads on floors of buildings are defined by a uniformly distributed load, line load, and concentrated load, which, however, must not be applied simultaneously. The uniformly distributed load is used for all global verifications and general designs, while the concentrated load is usually adopted for local verifications. Floor loadings which are made up of live loads and dead loads are combined for the design of slabs and floors.

Live loads are measured in pounds per square foot (psf) in the United States of America, while they are typically measured in kilo Newtons per square meter (kN/m2) in the UK and much of Europe. Sometimes, environmental loads, such as wind loads, are treated separately from live loads.

According to EN 1991-1-1:2002, imposed loads should be taken into account as quasi-static actions. However, dynamic effects may be included in the load models if there is no risk of resonance or other significant dynamic response from the structure. If resonance effects from the synchronised rhythmic movement of people or dancing or jumping may be expected, the load model should be determined for special dynamic analysis.

Typical live loads on the floor of a public building

Categories of Buildings

To determine the imposed loads, floor and roof areas in buildings should be subdivided into categories according to their use (see Table 1). Areas in residential, social, commercial and administrative buildings shall be divided into categories according to their specific uses shown in Table 6.1 of EN 1991-1-1:2002.

CategorySpecific UseExample
AAreas for domestic and residential activitiesRooms in residential buildings and houses; bedrooms and wards in hospitals; bedrooms in hotels and hostels kitchens and toilets.
BOffice areas 
  CAreas where people may congregate (with the exception of areas defined under categories A, B, and D.C1: Areas with tables, etc. e.g. areas in schools, cafés, restaurants, dining halls, reading rooms, and receptions.  

C2: Areas with fixed seats, e.g. areas in churches, theatres or cinemas, conference rooms, lecture halls, assembly halls, waiting rooms, and railway waiting rooms.

C3: Areas without obstacles for moving people, e g. areas in museums, exhibition rooms, etc. and access areas in public and administration buildings,   hotels,   hospitals, and railway station forecourts.

C4: Areas with possible physical activities, e.g. dance malls, gymnastic rooms, and stages.

C5: Areas susceptible to large crowds, e.g. in buildings for public events like concert halls, sports halls including stands, terraces and access areas and railway platforms.
  DShopping areasD1: Areas in general retail shops  

D2: Areas in department stores
EStorage areas

E1: Areas susceptible to accumulation of goods, including access areas

E2: Industrial areas
Table 1: Different categories of building areas (Source: EN 1991-1-1:2002)

Live Load Values for Different Categories of Buildings

The values of live loads for category A buildings (areas for domestic and residential activities) are provided in Table 2.

Sub-categoryExample qk (kN/m2) Qk (kN)
A1All usages within self-contained dwelling units (a unit occupied by a single family or a modular student accommodation unit with a secure door and comprising not more than six single bedrooms and an internal corridor) Communal areas (including kitchens) in blocks of flats with limited use (see Note 1). For communal areas in other blocks of flats, see A5, A6 and C31.52.0
A2Bedrooms and dormitories except those in self-contained single-family dwelling units and in hotels and motels1.52.0
A3Bedrooms in hotels and motels; hospital wards; toilet areas2.02.0
A4Billiard/snooker rooms2.02.7
A5Balconies in single-family dwelling units and communal areas in blocks of flats with limited use (see Note 1)2.52.0
A6Balconies in hostels, guest houses, residential clubs and communal areas in blocks of flats except those covered by Note 1Same as the rooms to which they give access but with a minimum of 3.02.0 (concentrated at the outer edge)
A7Balconies in hotels and motelsSame as the rooms to which they give access but with a minimum of 4.02.0 (concentrated at the outer edge)
Table 2: Live load values for domestic and residential buildings (Source: EN 1991-1-1:2002)
image 37
Typical single-family dwelling

The values of live loads for category B buildings (office areas) are provided in Table 3;

 Sub-category Example  qk (kN/m2)  Qk (kN)
B1General use other than in B22.52.7
B2At or below ground floor level3.02.7
Table 3: Live load values for office buildings (Source: EN 1991-1-1:2002)
typical office
Typical office room

The values of live loads for category C buildings (areas where people may congregate) are provided in Table 4;

  Sub-category Example qk (kN/m2) Qk (kN)
C1Areas with tables2.0 – 3.03.0 – 4.0
C11Public, institutional and communal dining rooms and lounges, cafes and restaurants (see Note 2)2.03.0
C12Reading rooms with no book storage2.54.0
C13Classrooms3.03.6
C2Areas with fixed seats3.0 – 4.02.5 – 7.0
C21Assembly areas with fixed seating (see Note 3)4.03.6
C22Places of worship3.02.7
C3Areas without obstacles for moving people3.0 – 5.04.0 – 7.0
C31Corridors, hallways, aisles in institutional-type buildings not subjected to crowds or wheeled vehicles, hostels, guest houses, residential clubs, and communal areas in blocks of flats not covered by Note 13.04.5
C32Stairs, landings in institutional-type buildings not subjected to crowds or wheeled vehicles, hostels, guest houses, residential clubs, and communal areas in blocks of flats not covered by Note 13.04.0
C33Corridors, hallways, aisles in all buildings not covered by C31 and C32, including hotels and motels and institutional buildings subjected to crowds4.04.5
C34Corridors, hallways, aisles in all buildings not covered by C31 and C32, including hotels and motels and institutional buildings subjected to wheeled vehicles, including trolleys5.04.5
C35Stairs, landings in all buildings not covered by C31 and C32, including hotels and motels and institutional buildings subjected to crowds4.04.0
C36Walkways –  Light duty (access suitable for one person, walkway width approx 600 mm)3.04.5
C37Walkways –  General duty (regular two-way pedestrian traffic)5.03.6
C38Walkways – Heavy duty (high-density pedestrian traffic including escape routes)7.54.5 
C39Museum floors and art galleries for exhibition purposes4.04.5
C4Areas with possible physical activities4.5 – 5.03.5 – 7.0
C41Dance halls and studios, gymnasia, stages (see Note 5)5.03.6
C42Drill halls and drill rooms (see Note 5)5.07.0
C5Areas susceptible to large crowds5.0 – 7.53.5 – 4.5
C51Assembly areas without fixed seating, concert halls, bars and places of worship (see Note 4 and Note 5)5.03.6
C52Stages in public assembly areas (see Note 5)7.54.5
Table 4: Live load values for areas susceptible to human gathering and crowd (Source: EN 1991-1-1:2002)
image 36
Typical assembly room with fixed seat

The values of live loads for category D buildings (shopping areas) are provided in Table 5;

 Sub-category  Example qk (kN/m2) Qk (kN)
D1Areas in general retail shops4.03.6
D2Areas in department stores4.03.6
Table 5: Live load values for shopping areas (Source: EN 1991-1-1:2002)

NOTE 1: Communal areas in blocks of flats with limited use are blocks of flats not more than three storeys in height and with not more than four self-contained dwelling units per floor accessible from one staircase.

NOTE 2: Where the areas described by C11 might be subjected to loads due to physical activities or overcrowding, e.g. a hotel dining room used as a dance floor, imposed loads should be based on C4 or C5 as appropriate. Reference should also be made to Note 5.

NOTE 3: Fixed seating is seating where its removal and the use of the space for other purposes is improbable.

NOTE 4: For grandstands and stadia, reference should be made to the requirements of the appropriate certifying authority.

NOTE 5: For structures that might be susceptible to resonance effects, reference should be made to NA.2.1. of NA to BS EN 1991-1-1:2002.

stadium crowd
Stadiums require dynamic analysis

The values of live loads for category E buildings (storage and industrial buildings) are provided in Table 6;

Sub-categoryExamples qk (kN/m2)Qk (kN) 
E11General areas for static equipment not specified elsewhere (institutional and public buildings)2.01.8
E12Reading rooms with book storage, e.g. libraries4.04.5
E13General storage other than those specified (see Note)2.4 per metre of the storage height7.0
E14File rooms, filing and storage space (offices)5.04.5
E15Stack rooms (books)2.4 per metre of storage height but with a minimum of 6.57.0
E16Paper storage for printing plants and stationery stores4.0 per metre of the storage height9.0
E17Dense mobile stacking (books) on mobile trolleys, in public and institutional buildings4.8 per metre of storage height but with a minimum of 9.67.0
E18Dense mobile stacking (books) on mobile trucks, in warehouses4.8 per metre of storage height but with a minimum of 15.07.0
E19Cold storage5.0 per metre of storage height but with a minimum of 15.09.0
E2See PD 6688 for imposed loads on floors for areas of industrial use  
Table 6: Live load values for storage areas (Source: EN 1991-1-1:2002)

However, the recommended value for imposed load due to storage is specified as 7.5 kN/m2 in clause 6.3.2 of EN 1991-1-1:2002. The equivalent concentrated load is 7.0 kN.

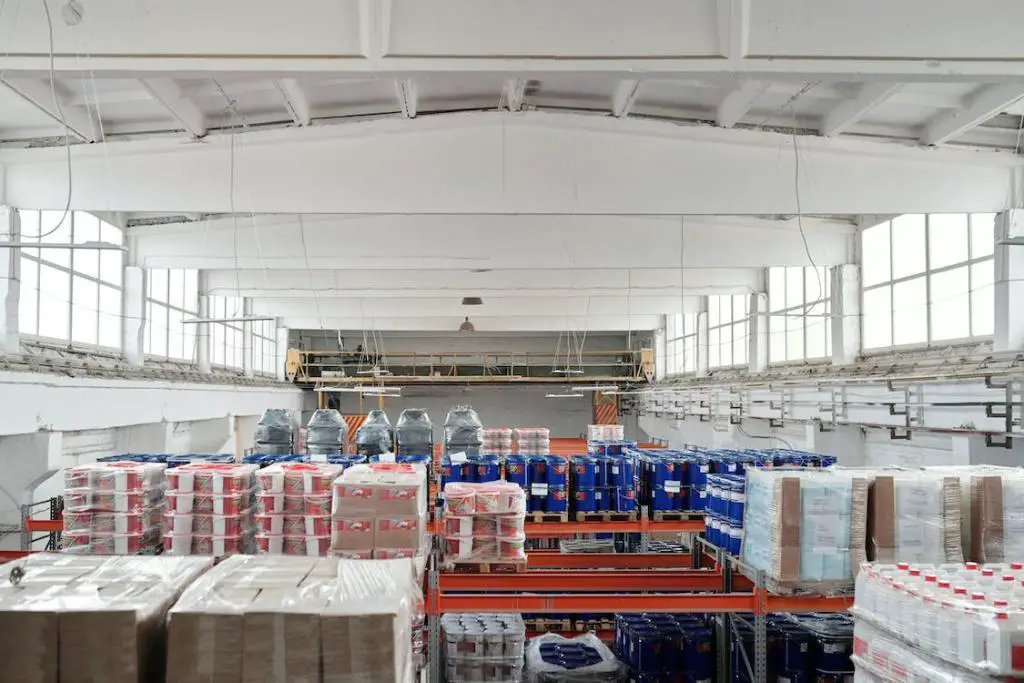
typical storage warehouse
Typical storage building

For garages and vehicle traffic areas, the imposed load for vehicles weighing less than 30 kN (about 3000 kg), qk = 2.5 kN/m2, and Qk = 7.0 kN. For vehicles weighing more than 30 kN but less than 160 kN, qk = 5 kN/m2 while the concentrated load should be specially determined. The uniformly distributed load and the concentrated load should not be applied simultaneously.

Angle of Internal Friction | Angle of Shearing Resistance

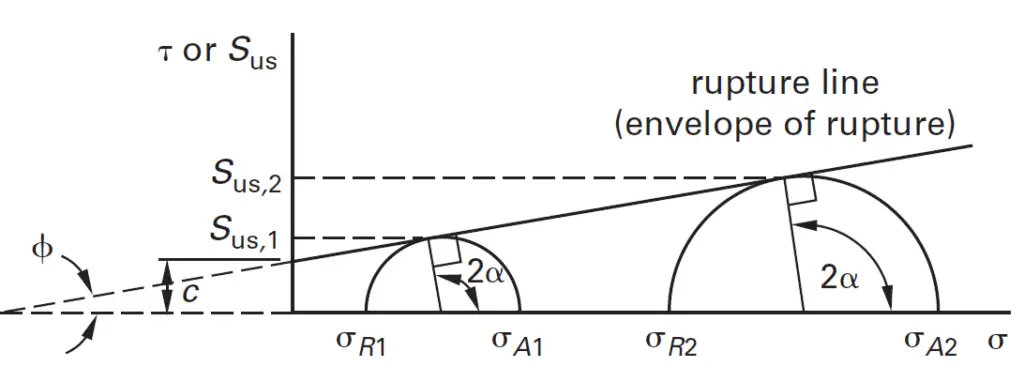
One of the important parameters regarded as a typical property of granular soils is the angle of internal friction, ϕ. The ability of a rock or soil mass to withstand shear stress can be measured by the angle of internal friction (also called the angle of shearing resistance). When failure occurs in response to a shearing stress (τ), the angle (ϕ), measured between the normal force (σ) and resultant force (R), is called the angle of internal friction.

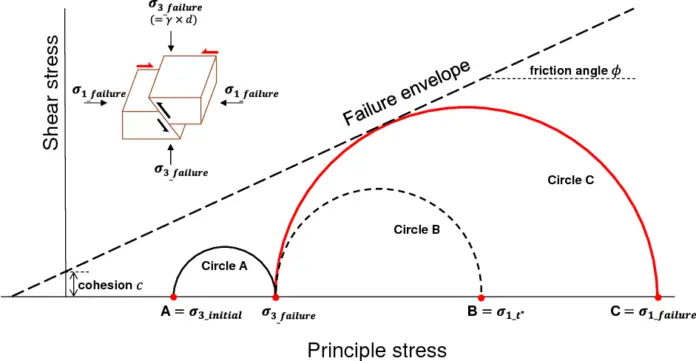
The coefficient of sliding friction is its tangent (τ/σ). The angle of internal friction of any soil can be seen visually on a Mohr’s circle plot after the shear strength test.

Angle of internal friction
Figure 1: Mohr’s circle for soil stress

Experimental analysis such as the triaxial test is used to determine the angle of internal friction’s value. Prior to engaging in analytical and design processes in relation to foundations, retaining walls, slope stability, and earth-retaining structures, shear strength parameters must be determined. A physical characteristic of earth materials, or the slope of a linear representation of their shear strength, is the angle of internal friction.
The internal resistance a soil mass can provide per unit area to withstand failure along any internal plane is known as shear strength. Failure happens when this resistance is exceeded. The maximum or limiting value of shear stress created within a soil’s matrix prior to yielding is referred to as the soil’s shear strength. The cohesive and frictional forces between adjacent particles in a soil matrix are what give the structure its shear strength.

As a result, there is some surface dependence on the soil shear strength. Any action that prevents or encourages soil particle interlocking or welding will inevitably affect soil shear strength.

Shear strength typically consists of:

(a) internal friction or the resistance due to the interlocking of the particles, represented by an angle, ϕ;
(b) cohesion or resistance due to the forces tending to hold the particles together in a solid mass. The cohesion of soil is generally symbolized by the letter ‘c’.

Coulomb was the first to propose the law governing the shear failure of soils, which is represented by the equation;

τ = c + σtanϕ ——— (1)

where the normal force is σ and the shear strength is τ.

Engineers and geologists commonly refer to unconsolidated and uncemented earth materials as soil, while geologists may refer to such materials as sediment. A variety of sizes (mm to m) from very fine to very coarse minerals or rock fragments make up soil (clay, silt, sand, gravel, cobble, and boulder-size).

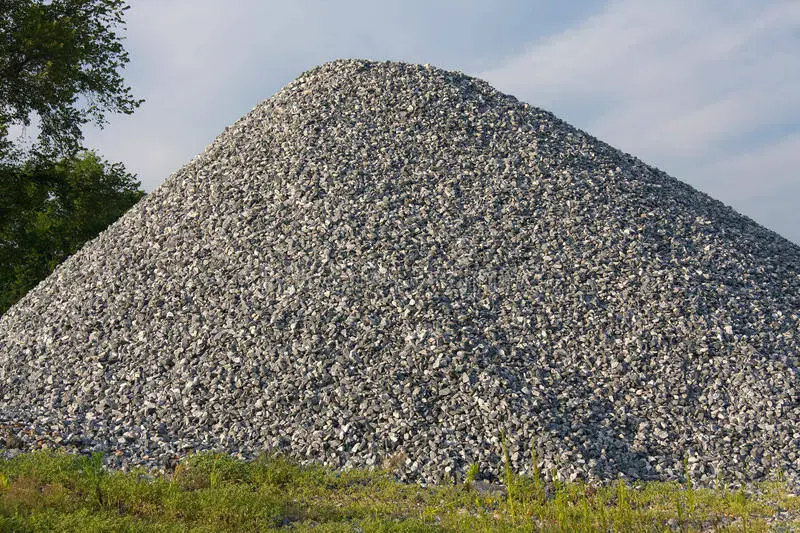
A mass of grains that are chemically and mechanically distinct from one another can be relatively easily mined, and the removed material can be piled up in a conical shape with slopes known as the angle of repose (Figure 2). The angle of repose is a depiction of the angle of internal friction, but it is typically controlled by grain form, resulting in slopes that are typically between 28° and 34° for piles of loose, dry grains in natural soil.

pile gravel 15332153
Figure 2: Pile of gravel forms angle of repose

The angle of internal friction is defined as the angle between the normal reaction force and the combined force of friction and normal reaction force as the object begins to move, whereas the angle of repose is defined as the minimum angle of an inclined plane that causes an object to slide down the plane. Theoretically, the angle of internal friction and the angle of repose appears to mean the same thing. However, the angle of internal friction determined during testing is used for geotechnical designs.

The distribution of grain size, angularity, and particle interlocking are the main variables that affect a soil’s friction angle in addition to density. As you may anticipate, fine-grained and well-rounded sand has a lower friction angle than angular and coarse sand.

image 33
Figure 3: Relationship between the angle of repose and soil strength

φ = 45° Select, granular soil. Slope, φ, maybe even greater if the soil is well compacted.
φ = 30° Good soil. The soil may be uncompacted, or possibly moist.
φ = 15° Poor soil. Poor soil may contain a high percentage of fines and may be wet.
φ = 0° Mud. The soil is liquid, and has no slope angle, φ

The angle of internal friction of different types of soils

The angle of internal friction for different types of soil can be estimated from the in-situ geotechnical engineering test. Some of them are shown in Table 1;

DescriptionRelative DensitySPT – N (blows/300 mm)Angle of internal friction
Very loose< 15%N ≤ 4φ < 28°
Loose15–35%N = 4 – 10φ = 28 – 30°
Medium dense35–65%N = 10 – 30φ = 30 – 40°
Dense65–85%N = 30 -50φ =40 – 45°
Very dense> 85%N > 50φ = 45 – 50°
Table 1: Angle of internal friction from SPT data

The angle of internal friction for different soil classifications is provided in Table 2;

Soil Group SymbolCohesion (saturated) kPaThe angle of internal friction (φ)
GW0> 38°
GP0> 37°
GM> 34°
GC> 31°
SW038°
SP037°
SM2034°
SM-SC1433°
SC1131°
ML932°
ML-CL2232°
CL1328°
OL
MH2025°
CH1119°
OH
Table 2: Angle of internal friction for different soil classifications

Floor Loading in Buildings

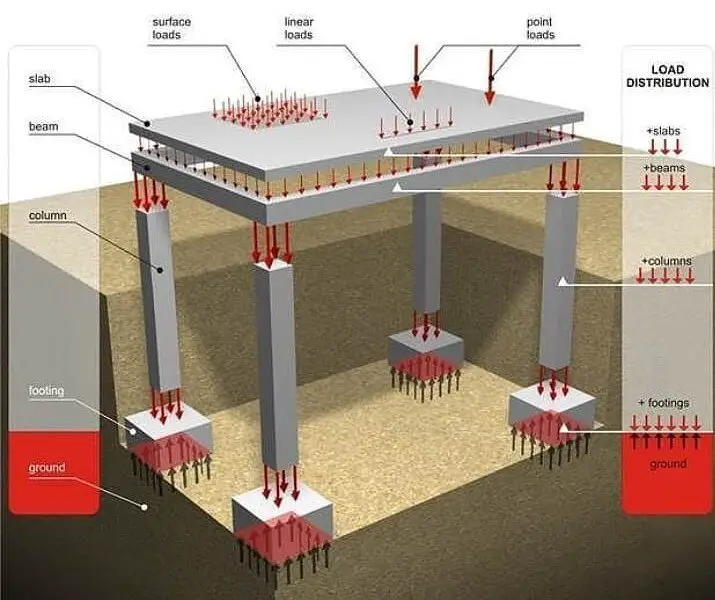
Floor loadings are loads applied to the floors of buildings such as slabs, decks, and pavements. All floors should be able to withstand the loads applied to them during their service life, and it is the duty of the structural engineer to ensure that the anticipated loading is adequately assessed, and accounted for during design.

In a real sense, the loads applied to the floor of a building may be arbitrary and dynamic such as the self-weight of the floor and finishes, the weight of furniture, human occupancy, different kinds of storage, etc. However, during structural analysis, these loads are often idealised as either uniformly distributed loads, concentrated (point loads), partially distributed loads, or dynamic loads. Dynamic analysis may be needed when designing floors subjected to crowd activities.

LOADING
Different types of loads on floors

Types of Floor Loading

For the purpose of structural design, all loads on floors are generically categorised into dead load and live load.

Dead Load (permanent actions)

Dead loads are loads that are permanent on the floor. Typically, this consists of the self-weight of the floor, permanent finishes on the floor such as tiles, screeding, terrazzo, etc, and other permanent fixes on the floor such as equipment. Furthermore, the weights of partitions such as block walls, or columns that are directly supported on slabs are also permanent loads on the floor.

To calculate the value of the dead load on floors, the unit weight of the material in question must be known. For instance, for a reinforced concrete slab, a unit weight of 24 – 25 kN/m3 is usually adopted for the concrete.

9E3FC03E 9E44 4B84 B8FC B2A70D4B5F74
Typically floor loading in a commercial building

If the thickness of the slab is 150 mm (0.15 m) and assuming a unit weight of 25 kN/m3, the self-weight of the slab is;

self-weight of slab = 0.15 × 25 = 3.75 kN/m2

This load is applied as a uniformly distributed pressure load on the floor. In the same vein, the weight of finishes can be calculated by considering the unit weight of the finishes, the screeding, and the thickness.

For permanent equipment or heavy furniture on the floor of a building, it is sufficient to know the weight of the equipment and the way it is fixed to the floor for the sake of structural analysis and design. The way it is placed and fixed on the floor will determine if it is to be treated as a uniformly distributed load, concentrated load, or partially distributed load.

It may be important to assess whether dynamic analysis or vibration isolation may be needed for mechanical equipment. For some permanent medical equipment in hospitals, no such analysis may be required.

Partition loads on slabs are usually treated as line loads or converted to equivalent uniformly distributed loads. The weight of the partition and the nature of its fixity will determine if it can be converted to an equivalent UDL or modelled as a line load.

Live Load (variable actions)

Live loads on floors usually represent the occupancy loading on the floor, and are considered as the loads that are moveable on the floor of a building. This usually includes the weight of human beings and pets on the floor, furniture, household storage, office equipment, warehouse storage, the weight of vehicles on suspended garages, library books and shelves, etc.

As a result of this, the use of the building must be clearly defined so as to know the appropriate live loading to be used in the design. Live loads on floors are usually represented by uniformly distributed loads and concentrated loads. The uniformly distributed loads are commonly used for general design and global verifications, while the concentrated loads are used for local verifications and designs.

TYPICAL FLOOR LOADING IN A STORE
Typically floor loading in a store

For instance, the use of a uniformly distributed live load on a cantilever staircase may not give an onerous action effect when compared with using an equivalent concentrated live load. The values of live load on floors are published on the various codes of practice. For instance, the live load for residential buildings may be 1.5 kN/m2, while the live load for storage houses may get as high as 5 kN/m2.

By implication, a building designed for residential purposes should not be converted to a self-storage building without adequate assessment and strengthening.

Load Combination

To design a floor slab or deck, the dead loads and live loads on the floor are usually combined after an appropriate factor of safety is applied. The value of the partial factor of safety applied for each load combination depends on the limit state that is being assessed. A higher factor of safety is used for ultimate limit state verification, while a lower factor of safety is used for serviceability limit state verification.

Some common load combinations are as follows;

BS 8110 (WITHDRAWN)
ULS: 1.4(Dead load) + 1.6(Live load)
SLS: 1.0(Dead load) + 1.0(Live load)

EUROCODE
ULS: 1.35(Dead load) + 1.5(Live load)
SLS: 1.0(Dead load) + 1.0(Live load)

ACI 318
ULS: 1.2(Dead load) + 1.6(Live load)

IS 456
ULS: 1.5(Dead load) + 1.5(Live load)
SLS: 1.0(Dead load) + 1.0(Live load)

CSA A23.3
ULS: 1.25(Dead load) + 1.5(Live load)

The factored loads are used to obtain the internal stresses (bending moment and shear forces) which are used in the design of the floor.

Estimation of Footing Settlement using SPT Data

In cohesionless soils, it is challenging to collect undisturbed samples, so we usually rely on the outcomes of in-situ testing (SPT or CPT tests) to determine the total settlement. Moreover, as the allowable soil pressure in these soils is determined more by considerations of settlement than bearing capacity failure, it is desirable to predict them accurately.

The average value of N to be used in the assessment of settlements and bearing capacity is determined by taking the SPT corrected values at foundation level N1, depth 1.5B (N2), and depth 2B (N3).

N = (3N1 + 2N2 + N3)/6 ——— (1)

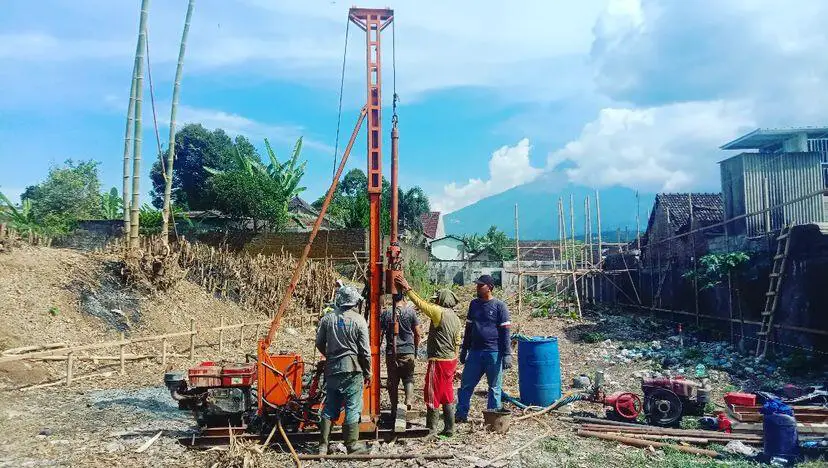
On-going SPT on site
Figure 1: On-going SPT on site

The total settlement of a foundation can be divided into the following three components:

  1. The immediate settlement ∆ which takes place due to elastic deformation of soil without change in water content.
  2. The consolidation settlement ∆H which takes place in clayey soil mainly due to the expulsion of the pore water in the soil.
  3. Secondary (creep) settlement ∆S which takes place over long periods due to the viscous resistance of soil under constant compression.

The immediate settlement is usually considered for footings on sand (cohesionless soils).

Correlation from Terzaghi and Peck

From Terzaghi and Peck’s (1967) correlation of settlement with SPT values, Teng (1969) proposed the following expression for the load for a given settlement of a footing of breadth B in a sand deposit with an SPT value of N:

For ∆ = 25 mm; p = 34.6(N – 3)[(B + 0.3)/2B]2 (in kN/m2) ——— (2)

for ∆ = 1 mm; p = 1.385(N – 3)[(B + 0.3)/2B]2 (in kN/m2) ——— (3)

Hence the settlement in mm for a load q in kN/m2 is as follows:

∆ = (0.722q/(N – 3)) × [(B + 0.3)/2B]2 (in mm) ——— (4)

As it was found that Eq. (4) gives high values of settlements, Meyerhof proposed the following:

Actual settlement = settlement by Eq.(4)/1.5 ——— (5)

Meyerhof’s Formula Based on SPT Values for Cohesionless Soils

Meyerhof noted that Terzaghi and Peck’s correction overestimates the actual settlement considerably. He proposed the following formula based on SPT tests for settlement in mm for q in kN/m2 and B in meters;

∆ = 1.6q/N for B < 1.25 m
∆ = 2.84q/N × [B/(B + 0.3)]2 for B > 1.25 m
∆ = 2.84q/N for large rafts

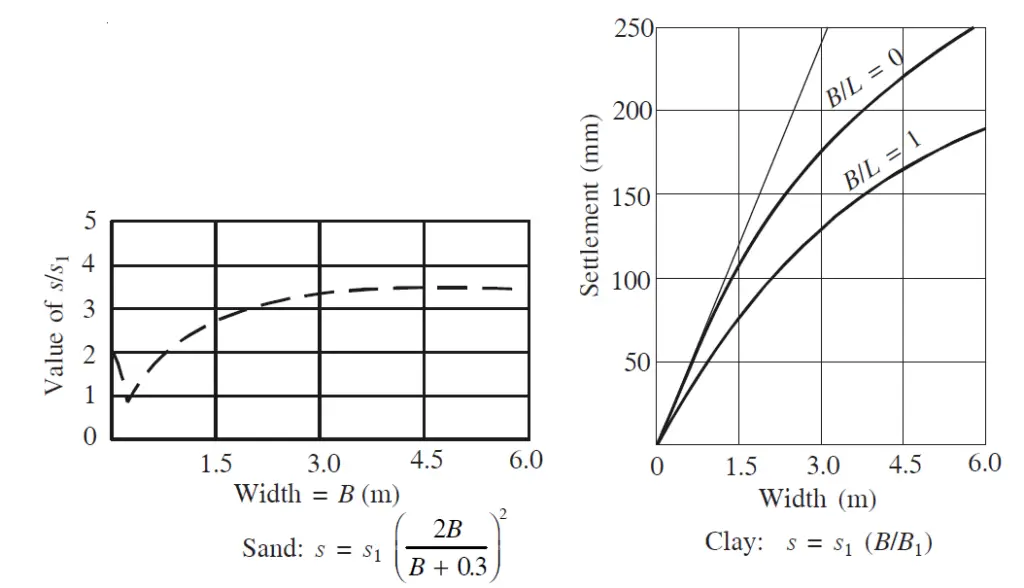
From test results, we know that in cohesionless soil, for the same intensity of load, the settlement of a footing increases with its width according to the following formula. (The settlement beyond B = 4 m can be taken as more or less constant.)

s = s1[2B/(B + 0.3)]2

where B is the breadth in meters and s1 is the settlement of a 0.3 m square plate.

image 29
Figure 2: Increase in settlements of footings with the width of footings in the sand and in clay (Varghese, 2012)

Another important empirical relation that Terzaghi established from his observation is that in both strip footing and also in pad footings of equal size and equally loaded the differential settlement that can be expected in all types of soil is about 50 percent of the maximum expected settlement of these footings.

In actual practice, the sizes of the footings can also be different. Hence in real-field situations, we may assume that the maximum expected differential settlement will be roughly 75% of the expected maximum settlement. Accordingly, if we assume an allowable differential settlement of 18 mm (3/4 inch) the maximum settlement we can allow in the footing will be 25 mm (1 inch).

In 1969, Teng proposed the following important relation between the settlement of a footing in sand and its SPT value N. [See Eq. (4)]

∆ = (0.722q/(N – 3)) × [(B + 0.3)/2B]2 (in mm)

where;
s = settlement in mm
q = intensity of load in kN/m2
B = breadth of footing in metres.

From the above, the net load required for 1 mm settlement will be as follows:

∆ = 1.385(N – 3)[(B + 0.3)/2B]2 (in kN/m2 per mm settlement)

where;
q1 = bearing pressure for 1 mm settlement in kN/m2
N = corrected SPT value
B = width of the footing in metres.

For 25 mm settlement, we get the following equation as the net allowable bearing pressure in kN/m2.

qnet = q25 = 34.6(N – 3)[(B + 0.3)/2B]2 = 8.6(N – 3)[(B + 0.3)/B]2 (in kN/m2)

Taking B = 4 m,
qnet = 10(N – 3) (approx.)

To this, we can add the effect of depth. Peck, Hanson and Thornburn (1974) used this relation to plot the graph for safe bearing capacity in sands for N values. The value of [(B + 0.3)/2B]2 decreases rapidly with B as shown in Fig. 3, so that the empirical value of qa for cohesionless soils with a variation of B can be expressed in kN/m2 as follows:

image 32
Figure 3: Variation of safe soil pressure with width based on shear failure and with soil pressure for 25 mm settlement (Varghese, 2012)


Therefore;
qa = 10.5NB (for B < 1 m for 25 mm settlement)
qa = 10.5N (for B > 1 m for 25 mm settlement)
qa = 0.42N (kN/m2) (approx.) for 1 mm settlement for B > 1 m.

An average value of N for a depth B below the footing is taken as the N value for the calculation of bearing capacity.

References

Terzaghi, K. and Peck, R.B. (1967): Soil Mechanics in Engineering Practice, John Wiley & Sons, New York, 1967
Teng, W.C. (1969): Foundation Design, Prentice-Hall of India, New Delhi
Peck, R.B., Hanson, W.E., and Thornburn, T.H., (1974): Foundation Engineering, John Wiley & Sons
Varghese P.C. (2012): Foundation Engineering. PHI Learning Private Limited, New Delhi

Moment-Resisting Frames

When the beam-to-column connections in a frame are sufficiently rigid to maintain the original angles between intersecting members, the frame is considered a moment-resisting (rigid) frame. In essence, moment-resisting frames comprise the beams, columns, and the rigid connection between them.

The stiffness of the beams and columns are relied upon for resisting gravity and lateral loads and are essentially designed for such. Moment-resisting frames can be made of steel or reinforced concrete.

The rigid frame action is the development of shear forces and bending moments in the frame members and joints to resist lateral loads. By reducing positive moments in beam spans, the continuity at both ends of beams also helps moment-resisting frames in resisting gravity loads more effectively.

54546A54 0D77 4271 AC54 0791C54C066F
Figure 1: Typical construction of a moment-resisting frame building

The versatility of moment-resisting frames in architectural planning gives them certain advantages in building applications. They can be positioned at the building’s façade without having their depths restricted in any way. However, some restrictions on beam depths must be observed to allow for the passage of mechanical and air conditioning ducts.

They may also be positioned throughout the interior of the structure. They are regarded as having greater architectural versatility than other systems like braced frames or shear walls because there are no bracing elements to obstruct open spaces or openings.

image 17
Figure 2: Lateral displacement of the moment-resisting frames (Bungale, 2005)

In order to prevent storey drift under lateral loads, the depths of frame members are frequently governed by stiffness rather than strength. The lateral displacement of one level in relation to the level below is referred to as the story drift. It is a major concern in the serviceability assessment of buildings especially because of the effects of wind.

Commonly used drift limitations for wind-related building designs range from 1/400 to 1/500 of the story height. These restrictions are thought to be generally adequate to reduce damage to nonstructural walls and partitions, cladding, and other surfaces.

Then inherent flexibility of moment-resisting frames could lead to more drift-induced nonstructural damage than in other systems under seismic loads. It is important to keep in mind that seismic drift, which includes structures’ inelastic responses, is normally limited to 1/50 of the story height, which is around ten times bigger than the permitted wind drift. Particularly for frames intended to withstand seismic loads, the strength and ductility of the connections between beams and columns are very important factors to consider.

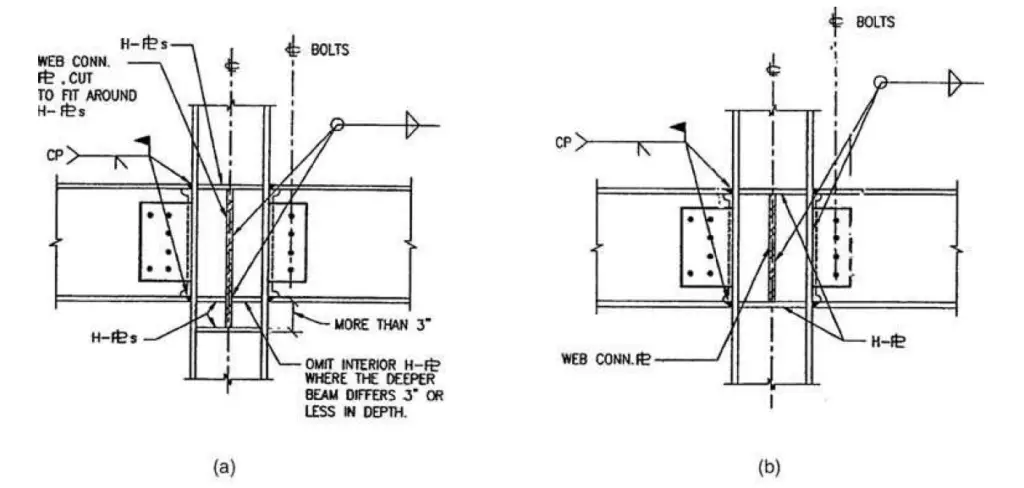
Consider the welded moment connection details from Figure 3, which were applied in North American seismic zones during the 25 years before the Northridge earthquake. A high-strength bolted shear tab connection and full-penetration field-welded top and bottom beam flanges were generally used for the connection. This kind of connection was thought to be capable of producing significant inelastic rotations.

Moment-resisting frames connections
Figure 3: Pre-Northridge moment connections: (a) unequal-depth beams to column flange connection; (b) equal-depth beams to column flange connection (Bungale, 2005)

The January 17, 1994, Northridge earthquake in California, with a Richter magnitude of 6.7, and the January 18, 1995 Kobe earthquake, with a Richter magnitude of 6.8, both damaged over 200 steel moment-resisting frame buildings and made engineers less confident in the use of the moment frame for seismic design.

Steel moment frames did not perform as well as planned in either of these earthquakes. The connections that failed almost always belonged to the category depicted in Figure 3. Most of the damage was caused by fractures in the bottom flange weld connecting the girder and column flanges. Additionally, top flange fractures happened often (Bungale, 2005).

New connection procedures have been created, and the majority of construction codes are being amended, in light of the brittle fracture that was seen at the intersections of the beam and column. Designing beams so that the plastic hinges form away from the column face is the typical approach to some new design concepts.

30538220 ED36 449C A5D7 9E39E5515880
Figure 4: Moment-resisting frame in an industrial building

Deflection Behaviour of Moment-Resisting Frames

A moment-resisting frame cannot displace laterally without bending the beams and columns because of the rigid connections between the beams and columns. Therefore, the bending rigidity of the frame elements serves as the main source of lateral stiffness for the entire structure.

It is beneficial to consider the deflections of a rigid frame as composed of two components (comparable to the deflection components of a structural element like a vertical cantilever column) to comprehend its lateral deflection characteristics.

The cantilever column’s primary deflection is caused by bending, and its secondary component is caused by shear. The shear component might not be taken into account when calculating deflection unless the column is reasonably short. However, both of these elements carry equal importance in moment-resisting frames. Cantilever bending and frame racking are common names for the bending and shear deflection parts of rigid frames.

Cantilever Bending Component

A moment-resisting frame behaves like a vertical cantilever when resisting overturning moments, which causes axial deformation of the columns. The columns on the windward face lengthen while those on the leeward face shorten. The building rotates about a horizontal axis due to this alteration in column lengths. The resulting lateral deflection, as depicted in Figure 5, is comparable to the cantilever’s bending deflection component.

image 18
Figure 5: Rigid frame deflections: Forces and deformations caused by external overturning moment (Bungale, 2005)

Shear Racking Component

This rigid frame response, depicted in Figure 6, is comparable to the cantilever column’s shear deflection component. Due to the rigid connections between the beams and columns, bending moments and shears develop in the beams and columns as the frame moves laterally. The horizontal shear above a given level due to lateral loads is resisted by shear in each of the columns of that story (Figure 6).

image 19
Figure 6: Rigid frame deflections: forces and deformations caused by external shear (Bungale, 2005)

The storey columns then begin to bend in a double curvature with points of contraflexure at roughly midstory levels as a result of this shear. Equilibrium is achieved when the sum of the moments of the columns above and below a joint equals the sum of the moments of the beams on each side of the column.

The beams also bend in a two-fold curvature to resist the bending, with points of contraflexure roughly in the middle of the span. The overall shear racking of the frame is caused by the accumulated bending of the columns and beams. According to Fig. 3.4b, the deflected shape caused by this component has a shear deflection structure.

About 70% of a moment frame’s overall sway results from the shear mode of deformation, with the remaining 30% coming from column bending and the other 10% to 15% from beam flexure. This is due to the fact that in a rigid frame, the column stiffness, as determined by the Ic/Lc ratio, is often significantly higher than the beam stiffness ratio, Ib/Lb, where;

Ib = moment of inertia of the beam
Ic = moment of inertia of column
Lb = length of the beam
Lc = length of the column

Therefore, to reduce lateral deflection, one should consider starting with increasing the stiffness of the beams. However, it is advisable to investigate the relative beam and column stiffnesses before making adjustments to the member stiffnesses in nontypical frames, such as for those in framed tubes with column spacing that is close to floor-to-floor height (Bungale, 2005).

The story drift increases with height due to the cumulative effect of building rotation, but that caused by shear racking tends to remain constant with height. In the highest stories, cantilever bending contributes more to story drift than shear racking does. Except in very tall and slender rigid frames, the bending impact typically does not exceed 10 to 20% of that caused by shear racking.

As a result, a medium-rise frame’s overall deflected shape typically has a shear deflection arrangement (Bungale, 2005). Therefore, it is possible to consider the total lateral deflection of a rigid frame as a combination of the following elements:

• Cantilever deflection due to axial deformation of columns (15 to 20%).
• Frame shear racking due to bending of beams (50 to 60%).
• Frame racking due to bending of columns (15 to 20%).

The panel zone of a beam-column connection, which is defined as the rectangular segment of the column web within the column flanges and beam continuity plates, along with the previously mentioned variables, also contributes to the overall lateral deflection of the frame. However, its impact rarely goes above 5% of the total deflection.

References

Bungale S. T. (2005): Wind and earthquake resistant buildings structural analysis and design. Marcel Dekker, New York

Load Balancing in Post-tensioned Two-Way Slab Systems

Load balancing is the most typical approach used in post-tensioned slab design for determining the amount and distribution of prestress after the selection of the initial slab thickness. During the load balancing, a portion of the load is balanced out by the transverse loads that the draped tendons in each direction impose on a slab.

Under the balanced load, the slab remains flat (without curvature) and is only susceptible to the ensuing longitudinal compressive P/A stresses. When assessing service load behaviour, particularly when predicting load-dependent deflections and figuring out how much cracking has occurred and how much crack control has been applied, consideration is given to the remaining imbalanced load.

image 2
Figure 1: Interior edge-supported slab panel (Gilbert et al, 2017)

Consider the interior panel of the two-way edge-supported slab shown in Figure 1. The panel has parabolic tendons in both the x and y axes and is supported by walls or beams on all sides. The upward forces per unit area that the tendons in each direction exert if the cables are uniformly spaced in each direction are;

wpx = 8Pxzd.x/lx2 ——— (1)

and

wpy = 8Pyzd.y/ly2 ——— (2)

where Px and Py are the prestressing forces in each direction per unit width, and zd.x and zd.y are the cable drapes in each direction.

The uniformly distributed downward load to be balanced per unit area wbal is calculated as:

wbal = wpx + wpy ——— (3)

In practice, perfect load balancing is not possible, since external loads are rarely perfectly uniformly distributed. However, for practical purposes, adequate load balancing can be achieved (Gilbert et al, 2017). Any combination of wpx and wpy that satisfies Equation (3) can be used to make up the balanced load. The smallest quantity of prestressing steel will result if all the loads are balanced by cables in the short-span direction, i.e. wbal = wpy.

DF2C1361 D03A 4A4A B41C 500835A55AB8
Figure 2: Post-tensioned slab construction

However, under unbalanced loads, serviceability problems in the form of unsightly cracking may result. It is often preferable to distribute the prestress in much the same way as the load is distributed to the supports in an elastic slab, i.e. more prestress in the short-span direction than in the long-span direction. The balanced load resisted by tendons in the short direction may be estimated by:

wpy = [lx4/(δly4 + lx4)] × wbal ——— (4)

where δ depends on the support conditions and is given by:

δ = 1.0 for 4 edges continuous or discontinuous
= 1.0 for 2 adjacent edges discontinuous
= 2.0 for 1 long-edge discontinuous
= 0.5 for 1 short edge discontinuous
= 2.5 for 2 long + 1 short edge discontinuous
= 0.4 for 2 short + 1 long edge discontinuous
= 5.0 for 2 long edges discontinuous
= 0.2 for 2 short edges discontinuous

Equation (4) is the expression obtained for that portion of any external load which is carried in the short-span direction if twisting moments are ignored and if the mid-span deflections of the two orthogonal unit-wide strips through the slab centre are equated.

With wpx and wpy selected, the prestressing force per unit width in each direction is calculated using Equations (1) and (2) as:

Px = wpxlx2/8zd.x ——– (5)

and

Py = wpyly2/8zd.y ——– (6)

Equilibrium dictates that the downward forces per unit length exerted over each edge support by the reversal of cable curvature (as shown in Figure 1) are:

wpxlx (kN/m) carried by the short-span supporting beams or walls
wpyly (kN/m) carried by the long-span supporting beams or walls

The total force imposed by the slab tendons that must be carried by the edge beams is, therefore:

wpxlxly + wpylylx = wballxly ——– (7)

and this is equal to the total upward force exerted by the slab cables.

Therefore, for this two-way slab system, to carry the balanced load to the supporting columns, resistance must be provided for twice the total load to be balanced (i.e. the slab tendons must resist wballxly and the supporting beams must resist wballxly). This requirement is true for all two-way floor systems, irrespective of construction type or material.

At the balanced load condition, when the transverse forces imposed by the cables exactly balance the applied external loads, the slab is subjected only to the compressive stresses imposed by the longitudinal prestress in each direction, i.e. σx = Px/h and σy = Py/h, where h is the slab thickness.

Article Source:
Gilbert R. I, Mickleborough N. C., and Ranzi G. (2017): Design of Prestressed Concrete to Eurocode 2 (Second Edition). CRC Press, Taylor and Francis Group.

Shear Strength of Soils

The internal resistance that the soil mass can provide per unit area to withstand failure and sliding along any plane within it is known as the shear strength of soil. Shear strength can be measured in a lab, out in the field, or perhaps both.

Triaxial compression tests, unconfined compression testing, and direct shear box tests are just a few of the tests that may be used in the lab. In situ tests are typically performed for both design purposes and to evaluate the reliability of laboratory experiments. Field vane, standard penetration test (SPT), and cone penetration test (CPT) are some of the available in-situ testing (CPT).

For a variety of issues, including the design of foundations, slope stability, retaining walls, and dam embankments in civil engineering applications, the shear strength of soil is necessary. An engineer’s responsibility to ensure that the structure is secure against shear failure in the soil that supports it and does not experience excessive settlement is very critical.

It is very important to understand the soil’s behaviour under stress and strain as well as its deformation and shear strength. When dealing with clay soil, which is renowned for being highly malleable and having poor shear strength, these concerns become more problematic and difficult.

Engineers have generally spent a lot of time measuring the shear strength of soils, but not as much time figuring out the fundamental elements that affect shear strength. The goal of this article is to learn more about the shear strength of soils and how the fundamental variables affect the shear strength of clay soils. The present analysis has focused primarily on the sources of shear strength in cohesive soils since these causes are less well understood than the causes of strength in cohesionless soils.

Components of shear strength in soils

The angle of internal friction (ϕ) and cohesion (c) are the two important parameters that determine the shear strength of soils. The soil’s maximum capacity to withstand shear stress under a given load is determined by the two factors. The cohesion measures the ionic attraction and chemical cementation between soil particles, and the angle of internal friction shows the amount of friction and interlocking that exists among soil particles.

By carrying out the necessary shear strength tests, it is possible to determine both of these characteristics in a laboratory. In-situ soil shear strength parameters can only be estimated using a limited number of field test procedures. While forces of attraction between clay-sized particle particles affect the strength of cohesive soils, friction between the particles is the primary driver of strength in coarse soils. Due to their ability to give soils flexibility and cohesion, it is convenient to think of such particles as plastic particles.

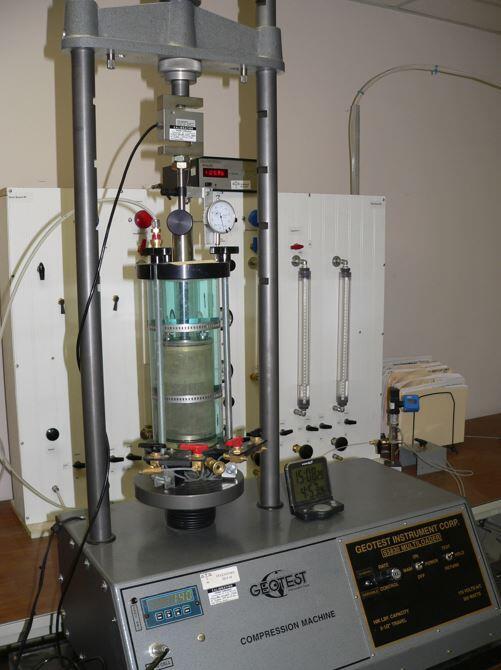
Triaxial testing machine is used for measuring the shear strength of soils
Triaxial testing machine

Using the cohesion and angle of internal friction, the shear strength of a soil mass can be calculated using the Mohr-Coulomb shear strength equation as follows;

τ = σ tan(ϕ) + c ——— (1)

image 12
Mohr’s circle plot for shear strength of soils

The angle of internal friction

The friction angle for a particular soil is the angle on the graph (Mohr’s Circle) where shear failure takes place. Soil friction angle is typically indicated by the symbol “ϕ“. Internal friction is typically understood as the grading-based resistance that two planes experience when they move in opposition to one another.

If the soil specimen is given time to solidify, friction increases as the typical load increases. Sand-containing gravels usually have a friction angle of 34° to 48°, loose to dense sand has a friction angle of 30° to 45°, silts have a friction angle of 26° to 35°, and clay has a friction angle of about 20°.

All well-graded soils have a high angle of internal friction values. Particle size, compaction force, and applied stress level are factors that affect friction angle. Although certain research has made it clearer by stating that the friction angle increases as the maximum particle size increases, friction angle does increase with an increase in particle size. With an increase in surface angularity and roughness, friction angle has also been observed to increase.

Cohesion

It is possible to define cohesion as the specific portion of shear strength that results from the forces of attraction that exist between the clay minerals. The ability of soil to act like glue, binding the grains together, is known as cohesion. It is an important element of shear strength, especially for fine-grained soils. The letter “c” is commonly used to indicate soil cohesion. Silt typically has a cohesion value of 75 KPa, but the cohesion of clay can range from 10 to 400 KPa, depending on how stiff the clay is (from soft to high).

An extremely strong cohesion can be produced by naturally occurring minerals that have leached into the soil, such as caliches and salts. The soil grains will tend to fuse together due to heat fusion and sustained overburden pressure, resulting in substantial cohesion.

At the start of the stress condition, cohesion mobilizes and achieves its peak levels around the plastic limit, or at the start of structural collapse. Cohesion increases as one approach the shrinkage limit and diminishes as one approaches the liquid limit. With the exception of clayey soils, where a rise in stress induces an increase in molecular bonds, cohesion often does not increase as stress increases.

Factors affecting the shear strength of soils

Many factors are recognized to have a direct effect on the shear strength of cohesive soils and play a significant role in strength determination. These factors include;

  1. clay content
  2. clay mineralogy
  3. plasticity index
  4. water content
  5. dry density, and
  6. strain rate

A brief review of these factors, as reported by previous investigators is outlined below.

Clay Content

The cohesion and the friction angle are significantly affected by the percentage of clay in the soil mass. The addition of more clay increases the cohesiveness for water contents that are a little above the optimum water content. If the moisture level is considerably higher than the optimum water content, this improvement could not be possible. Increased clay fractions will result in stronger binding forces, which will increase the soil’s strength.

Clay mineralogy and microfabric

The shear strength of cohesive soils is influenced by the environmental conditions as well as the mineral composition of the clay. Clay’s shear strength is decreased by the presence of clay minerals. The weakest and most prone to swelling of the clay minerals is the expansive clay montmorillonite.

In expansive soils, shrinkage and swelling have completely different impacts on the shear strength. Fully inflated clay typically has poor shear strength, whereas dry shrinking clay might have better cohesiveness. The principal stresses of the soil’s shear strength are greatly influenced by the clay minerals.

image 13
Typical clay minerals

The amount of kaolinite in the soils is directly related to the primary stress that was measured (σ1). This might be explained by the characteristics of kaolinite particles, which among the clay mineral species under investigation have the biggest grain sizes. The microfabric, or diameter-to-thickness ratio, of the kaolinite particles, is the smallest. As a result, the edge surface of the kaolinite particles is quite large.

The charge is differently distributed in kaolinite, with one basal plane being highly charged and the other uncharged. High major stress resulted from this for both the calcium and sodium types. Intergranular friction is the main cause of kaolinite’s relatively high major stress.

Plasticity Index

The behaviour of cohesive soil is significantly influenced by the plasticity of the soil. Numerous academics are working to understand how plasticity affects the shear strength of cohesive soils. Shear strength decreases as the plasticity index rises. According to research, high plastic clay has stronger binding pressures, which increases the soil’s shear strength. It was found that clay soils with higher calcium carbonate contents have lower plasticity indices and significantly higher shear strengths.

Skempton looked at how plasticity index affected shear strength and proposed a formula that is frequently used to forecast shear strength. Skempton discovered that the plasticity index PI (%) for the vane shear test is a linear function of the undrained shear-strength ratio of properly consolidated clays, as shown in Equation below (1).

Water content

Cohesion typically increases with water content up to the optimum water content, after which it generally decreases with water content. On the other hand, friction reduces as water content rises and eventually stabilizes at a value close to its maximum. As a result, shear strength decreases as water content rises because suction’s contribution to shear strength declines.

According to Lambe and Whitman, the undrained shear strength is independent of a change in total stress unless a change in water content occurs and postulated that the water content is a function of the maximum principle consideration stress alone. Similar studies discovered that a nonlinear function could be used to depict the link between the amount of water present in soils and the undrained shear strength.

In compacted clay soil, the shear strength falls as the water content rises. The shear strength of soil varies exponentially across consistency limits, and the corresponding fitting equation aids in calculating strength at any relevant water content.

With a drop in water content, it is anticipated that the shear strength will rise. This presumption is in line with some observations that clay soils compacted with a moisture content lower than the ideal behave in a coarser manner as a result of aggregation than would be allowed by the grading. Because clay particles aggregate into aggregates with larger effective particle sizes, a fall in water content in clay soils causes a higher friction angle.

Dry Density

The dry density of cohesive soil has a significant impact on its shear strength. Because shear strength increases as dry density increases, a rise in density or a fall in the void ratio will result in an increase in friction angle. With an increase in the soils’ dry density, the primary stress (σ1) increases.

Strain Rate

The testing preparations with relation to drainage conditions and the type of soil tested determine how significantly the shearing rate affects the results. In clays, the strain rate is typically quite low to allow the pore water pressure to dissipate. One test could take several days to complete. However, a more accurate approximation for an undrained specimen can be found in the drained strength measured in a test at a rate of 1.2 to 1.3 mm/min.

With an increase in shear strain rate, undrained shear strength rises. It should be noted, though, that the undrained strength would be underestimated by the quick direct shear testing.