8.7 C
New York
Friday, November 15, 2024
Home Blog Page 19

Evaluation of Pykrete in the Design of a Lattice Tower

Pykrete is a material used for temporary buildings in cold climates. It is made of a mixture of water and a number of additives, such as wood chips, cellulose sheets that have been dissolved, sand, gums, and combinations of any of those. It was initially created so that ships could be built in cold environments. In the past ten years, this substance has typically been used in shell buildings that have been built with ropes and inflatable fabric formwork (see Figure 1).

The usage of Pykrete in linear element constructions has recently been studied, and some low-rise structures have been constructed as a result. According to Pronk et al (2022), the year 2019 saw the construction of a tower-like Pykrete structure for the International Ice and Snow Innovation Design and Construction Competition, based on an idea from the Eindhoven University of Technology. It is the tallest pykrete structure with linear elements to date, this structure has a height of 11 m.

pykrete dome
Figure 1: Pykrete dome (Pronk et al, 2022)

Researchers (Pronk et al, 2022) from the Department of the Built Environment, Eindhoven University of Technology, Netherlands have carried out a study on the mechanical performance of pykrete beam elements. Experimental tests from the study were compared with previously conducted studies. Furthermore, the researchers presented the optimization  and numerical model of a pykrete tower’s design, followed by a description of the construction techniques. The article was published in the journal, Structures (Elsevier).

Making and Design Concept of the Lattice Tower

In the study conducted by Pronk et al (2022), a preliminary design of the tower was developed, considering a uniform cross-section for the primary elements and secondary elements. The preliminary design of the tower was symmetrical, made up of five similar partitions.

Ten principal load-bearing parts, five of which are exterior (shown in blue in Figure 2) and five of which are internal, extend vertically from the bottom to the top (green elements in Figure 2). Self-weight and wind pressure of 0.5 kN/m2 were taken into account. Recent research literature served as the source for the material’s mechanical properties.

preliminary view of the pykrete tower
Figure 2. Preliminary design of the tower (Pronk et al, 2022)

Fire hoses filled with pykrete were used to create the members of the lattice tower. They transfer the wind loads in addition to the dead weight of the structure to the foundations. Compression in the inner columns is primarily produced by the structure’s self-weight. Due to the additional weight of the structural elements, these compressive forces are low at the top of the tower and increase at ground level, as typical in all structures. As a result, it is anticipated to have a larger cross section close to the foundation.

According to the research, the tower’s construction was separated into three stages:

  1. Preparing the rope and pipes: The ropes and fire hoses are trimmed to the correct length. Pykrete is injected into the fire hoses from one side. The hoses were linked together after being frozen. The secondary components, the ropes, are tied together and attached to the fire hoses in accordance with the prescribed pattern. The anchors are made of earth connectors. The hoses are hermetically sealed below ground. To keep the shape while the pykrete is being applied, a low tension is applied to these ropes.
  2. Pipe and rope installation without the use of Pykrete: Here, the structure is raised and positioned using a crane (see Figure 3).
  3. Application of pykrete: As soon as the necessary sections are achieved, the pykrete will be gradually applied by spraying and extrusion on the hoses and ropes. Pykrete can be sprayed on the structure until the desired member thickness is achieved after the desired form has been achieved. The top portion, which is currently being lifted by the crane, will be sawn off once enough pykrete has been put, and the tower will then stand on its own.
lifting the structure with crane
Figure 3: Lifting the structure with crane

Based on the preliminary tower design, two main types of samples were evaluated. The cross-section of the first kind of sample is made up of pykrete and a fire hose. A tube with a 64 mm diameter was used as the hose. Pykrete is poured into the tube, and a 44 mm thick second layer of pykrete is applied around the tube, making the section’s overall diameter 154 mm. The mixture of additives in Pykrete contains cellulose at a concentration of 20 g/L (2%).
The second type of sample, which has a smaller cross-section was used to test for secondary elements. It was made up of a rope with a diameter of 12 mm that is encircled by a layer of pykrete measuring 15 mm. The additive concentration is 80 g/L (8%).
The greatest length that can be tested corresponds to a sample length of 450 mm for both types of samples. Testing was done using three different methods: compression, tension, and 4-point bending. For pykrete samples, there aren’t any currently available standardised tests. It is important to understand that pykrete’s mechanical characteristics vary depending on temperature.

Mechanical Performances of Pykrete in Beam Elements

In comparison to common building materials, pykrete’s mechanical characteristics are still being extensively studied. Tests have been done on a large number of samples in order to compare different pykrete compositions. The force–displacement relationship obtained by the bending and compression tests in the current study generally followed the major trends already observed in previous studies. However, some of the takeaways from the study were;

  • Regarding the 4-point bending tests, it appears that the fire hose behaviour during bending shows a hardening phase. The authors however recommended that further research should examine additional samples with composite sections to corroborate this.
  • The compression tests revealed that when using slender linear elements, which weren’t taken into account for shell structures in Pykrete, it will be required to pay attention to buckling.
  • The tests conducted on the fire hose sections produced an elastic modulus that is relatively low and especially much below what is described in the literature. Although the cause of this outcome is unclear, a lack of uniformity in the parts may be to blame.
  • The tensile tests reveal that while the rope does not increase the section’s tensile strength, it does allow for the preservation of the element’s integrity after failure, which is not possible for an element constructed simply of pykrete.

The full results of the test data are available in the publication.

Optimization and Numerical Model of the Tower

Grasshopper® software was used to optimize the tower’s design based on the results of the investigation. It is a Rhino® visual programming plugin that enables the execution of parametric designs based on scripts. A Live Physics engine called Kangaroo2® allows for interactive simulation, optimization, and form-finding within Grasshopper.  Kangaroo2® uses dynamics relaxation With this approach, a nonlinear equation system’s solution is reduced to an explicit iterative calculation. Therefore, a damped dynamic process led to the proposed static solution.

pykrete models
Figure 4: The initial design and the optimised design

The algorithm consists of the subsequent phases. The anchor points, the self-weight, the major element stiffness, and the secondary element stiffness are first defined as the constraint conditions. Then, utilizing Newton’s second law, masses are defined at each node. The total residual forces for each node, the speed, and the position are computed at each iteration. When the geometry reaches its static state, the algorithm will terminate.

The optimum design consists of a series of curves that can be connected to form a mesh. In other words, the gradient of the energy that is in the direction of the forces (masses) defined at each node is used to move the nodes in order to minimize the elastic energy.

The next step is to assess the design’s structural performance in SCIA® under wind loads and self-weight. The elements’ cross-sections are manually modified (decreased or increased). For the primary and secondary parts, there can only be three different sections. Finally, the original design and the new cross-sections are added as a new input in Grasshopper®, and Kangaroo2® generates a new shape.

cross sections of the tower
Figure 5: Final cross-sections of the tower.

Conclusion

Pykrete is a promising and environmentally friendly material for constructing buildings in cold areas. Up until now, inflatable shell structures were the only types of pykrete structures. However, this restricts the kind of constructions that can be made to the shapes of inflatables that can be built.

According to the study, producing truss structures would present new opportunities. By recommending a construction method and performing testing on the sections, the research enabled the creation of an 11 m tall tower made up of linear elements. By using form-finding, the design was optimized, and SCIA® was used to verify the structure under actual loading. The experimental testing have demonstrated that, before constructing more ambitious structures, research on the buckling of these components is required.

Reference(s)
Pronk A., Mergny E., and Li Q. (2022): Structural design of a lattice pykrete tower. Structures 40 (2022) 725-747. https://doi.org/10.1016/j.istruc.2022.03.079

The contents of the cited original article published by Structures (Elsevier) is open access, under the CC BY license (http://creativecommons.org/licenses/by/4.0/) which allows you to share and adapt (remix) the article provided the appropriate credit is given, and the link to this license provided.

Construction and Cost Comparison of Rectangular and Trapezoidal Drains

Cost is often a major determiner of decision-making on projects. Therefore, for all civil engineering works, it is required to know the probable construction cost before the project’s commencement. This is known as the estimated cost, which comprises the cost of labour, materials, equipment, and other general overhead costs. The construction and cost comparison of rectangular and trapezoidal drains can be an important consideration during highway design.

In a previous article, determining the best hydraulic section of roadside drains was discussed whereby a particular peak discharge was designed, resulting in rectangular and trapezoidal cross-sections. However, the cost comparison of both cross-sections will be discussed in this article to determine which cross-sections will result in greater savings on cost.

The details of both drain cross-sections are provided below. However, it must be noted that it is assumed that the construction is in-situ, and the cost comparison is based on 1m length of the drain cross-sections. Furthermore, the cost of labour is proportional to the quantity of materials.

Construction Process of Reinforced Concrete Drains

The procedures for the construction of reinforced concrete drains are stated below:

Marking of alignment: This involves a surveyor marking out the alignment for the trench to be dug. This alignment includes horizontal and vertical alignment. The projection of the drain in the horizontal plane is termed as the horizontal alignment, while the projection in the vertical plane is termed the vertical alignment. Survey instruments are used in this operation.

Excavation: After the surveyors have marked out the trench alignment, the depth is also marked out. Excavation is then carried out through the use of manual labour or mechanical means by the use of excavating machine.

Concrete blinding: This is the process of pouring a thin layer of concrete over the bed of the trench to seal in the underlying soil material and prevent dirt and mud from interfering with the drain structure. It is also done to correct any irregularities in the bed of the excavated surface, and to provide smooth, level and regular surface to receive the concrete base. The concrete blinding is a mass concreting and usually 50mm in thickness.

DSC03386
Construction of a rectangular concrete drain

Positioning of reinforcements: U-shape or trapezoidal-shape rebars, as the case may be, are usually placed in position on the blinded surface at the designed spacing. Furthermore, the rebars are positioned with the aid of concrete biscuit to create a concrete cover. It must be ensured that the center of the base aligns with the center alignment provided by the surveyor in order to have a uniform alignment.

Concrete base: After the positioning of rebars, the next step is to cast the concrete base. Usually, a concrete base of 150mm in thickness is cast on the blinded bed of the drain. A guiding panel or formwork is placed into position to guide in casting the concrete base to achieve a uniform alignment base edge, thickness, width, and to manage the concrete while pouring.

Concrete wall: After the casting of the base, and setting and hardening of the concrete, the formwork for the drain walls are positioned to allow for the casting of the wall. The fair-finished panels to be used as formwork should be lubricated, clipped and prepared to receive the concrete. After casting, setting and hardening of the walls, the panels are removed and the concrete is cured.

Backfilling and compaction: After the casting of the drain walls, the excavated portion left beside the drain is backfilled and compacted to avoid settlement of the backfill.

Cost Analysis of Rectangular Drain

rectangular details 102132
Rectangular drain details

Excavation  
Volume of soil = (1.1 + 0.6) × (0.05 + 0.15 + 0.7) × 1 = 1.53 m3
Unit cost of excavation = ₦1,500 per m3
Cost of excavation = 1.53 x 1,500 = ₦2,295

Concrete in blinding
Volume of concrete = 0.05 × 1.7 × 1 = 0.085 m3
Unit cost of concrete = ₦55,000
Cost of concrete material = 0.085 × 55,000 = ₦4,675

Concrete in drain
Volume of concrete = [(1.1 × 0.15) + 2(0.7 × 0.15)] x 1 = 0.375 m3
Unit cost of concrete = ₦55,000
Cost of concrete material = 0.375 × 55,000 = ₦20,625

Reinforcement
Bar Mark 1 = 6 × 2.6 × 0.617 = 9.626 kg
Bar Mark 2 = 14 × 1 × 0.617 = 8.638 kg
Total weight of rebar = 9.626 + 8.638 = 18.264 kg

Unit cost of rebar = ₦ 450
Cost of rebar = 18.264 x 450 = ₦ 8,220

Formwork
Base = 2(0.15) × 1 = 0.3 m2
Walls = 2(0.7+0.7) × 1 = 2.8 m2
Total area of formwork required = 0.3 + 2.8 = 3.1m2

Unit cost of formwork = ₦5,400 (marine plywood)
Total cost of formwork = 3.1 x 5,400 = ₦16,740

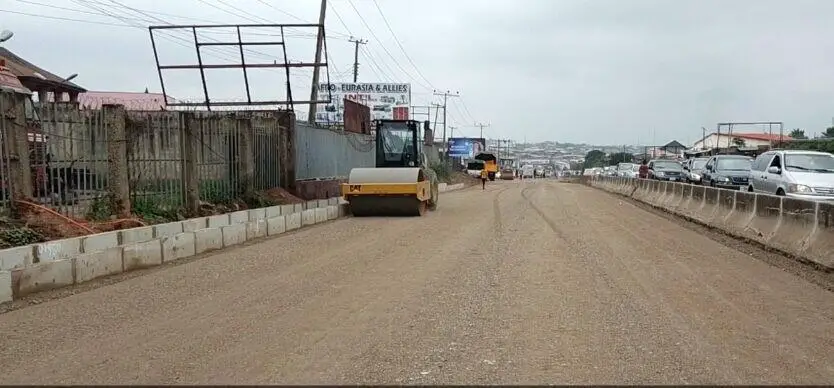
images 1
Rectangular drain construction

Cost Analysis of Trapezoidal Drain

trap 063228
Trapezoidal drain details

Excavation
Volume of soil = [0.5(0.8 + 1.65) × 0.95] × 1 = 1.164m3
Unit cost of excavation = ₦1,500
Cost of excavation = 1.164 × 1,500 = ₦1,745

Concrete in blinding
Volume of concrete = 0.05 × 0.8 × 1 = 0.04m3
Unit cost of concrete = ₦55,000
Cost of concrete material = 0.04 × 55,000 = ₦2,200

Concrete on drain
Volume of concrete = [0.5(1.65 + 0.8) × 0.9] – [0.5(0.5 + 1.35) × 0.75] = (1.1025 – 0.69375) × 1 = 0.409m3
Unit cost of concrete = ₦55,000
Cost of concrete material = 0.409 × 55,000 = ₦22,495

Reinforcement
Bar Mark 1 = 6 × 2.6 × 0.617 = 9.626 kg
Bar Mark 2 = 14 × 1 × 0.617 = 8.638 kg
Total weight of rebar = 9.626 + 8.638 = 18.264 kg

Unit cost of rebar = ₦450
Cost of rebar = 18.264 x 450 = ₦8,220

Formwork
Walls = 2(0.865) × 1 = 1.73m2
Unit cost of formwork = ₦5,400
Total cost of formwork = 1.73 × 5,400 = ₦9,345

images 12
Trapezoidal drain construction

The table below shows the cost comparison of the rectangular and trapezoidal drains;

Cost component Rectangular SectionTrapezoidal Section% reduction or increment
Excavation₦2,295₦1,745– 23.97%
Concrete in blinding ₦4,675₦2,200– 52.94%
Concrete in drain₦20,625₦22,495+ 9.07%
Reinforcement₦8,220₦8,220
Formwork₦16,740₦9,345– 44.18%
Total₦52,555₦44,005– 16.27%

Conclusion

The article has discussed the cost comparison of rectangular and trapezoidal drain cross-sections per meter run for a particular peak discharge. From the cost analysis, it can be deduced that the cost of concrete in drain required for the trapezoidal drain is 9.07% higher than that of the rectangular drain. However, there are significant reductions of 23.97% in excavation cost, 52.94% in concrete blinding cost, and 44.18% in formwork cost for the trapezoidal drain over the rectangular cross-section.

Furthermore, there is an overall cost reduction of 16.27% if the choice of drain cross-section is trapezoidal. Similarly, suppose the labour cost is directly related to the quantity of materials. In that case, adopting the trapezoidal cross-section is expected to result in savings on the cost compared to a rectangular cross-section. This justifies that trapezoidal cross-sections are usually the most economical, provided there is a right-of-way (ROW).

Standard Penetration Test (SPT) for Foundation Design

The standard penetration test (SPT) is made in boreholes by means of the standard 50.8 mm outside and 33.8 mm inside diameter split spoon sampler. It is a very useful method for estimating the in-situ density of cohesionless soils, and when modified by a cone end, it can also be used to assess the relative strength or deformability of rocks.

An automatic trip device triggers repeated strikes from a 63.5 kg weight falling freely through 760 mm, driving the sampler to a penetration of 450 mm.The only blows counted as part of the conventional penetration number are those for the final 300 mm of driving (N-value). For the entire 450 mm of drive, it is standard practice to count the blows for every 75 mm of penetration.

By doing so, it is possible to determine the depth of any disturbed soil in the borehole’s bottom and the height at which any obstacles to driving, such as cobblestones, huge gravel, or cemented layers, are encountered. In the test, typically no more than 50 blows are made (including the number of blows necessary to position the sampler below the disturbed zone).

Both the depth at the start of the test and the depth at which it is concluded must be given in the borehole record if the full 300mm penetration below the initial seating drive is not achieved, i.e., when 50 blows are made before full penetration is achieved. Appropriate symbols must be used to indicate whether the test was completed within or below the initial seating drive. The tube is disassembled for analysis of the soil samples after removal from the borehole (see Figure 3).

SPT TEST
Figure 1: Driving sequence in an SPT test

In gravelly soil and rocks the open-ended sampler is replaced by a cone end. Investigations have shown a general similarity in N-values for the two types in soils of the same density.

The standard penetration test was first developed in the USA as a simple tool to determine the density of soils. The test was adopted by various nations throughout the world, and numerous relationships between the test results and soil characteristics and analytical methods were developed.

According to published data, test methodologies vary greatly across different countries. Non-standard types of hammers and samplers were being utilised, and there were several ways to manage the hammer drop, including free-fall or rope and pulley arrangement.

SPT TEST IN PROGRESS
Figure 2: Typical SPT hammer set up

The two most common types of SPT hammers used in the field are the safety hammer and donut hammer. They are commonly dropped by a rope with two wraps around a pulley (see Figure 2).

Correction Factors to SPT Test

There are several factors that will contribute to the variation of the standard penetration number, N, at a given depth for similar soil profiles. These factors include SPT hammer efficiency, borehole diameter, sampling method, and rod length factor.

Split spoon sampler for SPT
Figure 3: Split spoon sampler for SPT

It therefore became evident that if the test data were to be used for correlation with different soil parameters, as will be explained below, corrections to N-values produced by non-standard techniques would be required. The following is a summary of the correction factors that should be applied to the measured blow-count.

The primary correction is focused on the energy that the drill rods and hammer send to the sampler. This has been normalised using a 60% of the theoretical maximum energy ratio (ERM). The term N stands for the measured blow-count , while N60 stands for the hammer energy correction. A further correction is applied to allow for the energy delivered by the drill rods. The N60 value is corrected to N by multiplying N’60 by 0.75 for rod lengths of 3 m or shorter. The correction factor is unity for lengths greater than 10 m. No correction for sampler size or weight is necessary if a British Standard or ASTM standard sampler is used.
Thus;

N60 = N(ERm/60) = NCE ——– (1)

where ERm is the energy ratio and CE is the 60% rod energy ratio correction factor. Correction factors for rod lengths, sampler type, borehole diameter, and equipment (60% rod energy ratio correction) are given in Tables 1 – 4.

SPT TEST SET UP
Figure 4: Set up of SPT in site

In the field, the magnitude of ERM can vary from 30 to 90%. The standard practice now in the U.S. is to express the N-value to an average energy ratio of 60% (≈ N60). Thus, correcting for field procedures and on the basis of field observations, it appears reasonable to standardize the field penetration number as a function of the input driving energy and its dissipation around the sampler into the surrounding soil, or;

N60 = NCHCBCSCR/60 ——– (2)

where N60 = standard penetration number corrected for field conditions
N = measured penetration number
CH = hammer efficiency (%)
CB = correction for borehole diameter
CS = sampler correction
CR = correction for rod length

CountryHammer TypeHammer Release CH (%)
JapanDonut
Donut
Free Fall
Rope and pulley
78
67
USASafety
Donut
Rope and pulley
Rope and pulley
60
45
ArgentinaDonutRope and pulley45
ChinaDonutFree fall
Rope and pulley
60
50
Table 1: Variation of hammer efficiency with hammer type and hammer release

Diameter (mm)Diameter (inches)CB
60 – 1202.4 – 4.71.0
15061.05
20081.15
Table 2: Variation of borehole correction factor with borehole diameter

VariableCS
Standard sampler1.00
With liner for dense sand and clay0.80
With liner for loose sand0.90
Table 3: Variation of sampler correction factor with sampler type

Rod length (m)CR
> 101.0
6 – 100.95
4 – 60.85
0 – 40.75
Table 4: Variation of rod length correction factor with rod length

Worked Example on SPT Number Calculation

The blow counts for an SPT test at a depth of 6 m in a coarse-grained soil at every 150mm are 9, 16, and 19. A donut automatic trip hammer and a standard sampler were used in a borehole 152 mm in diameter.

(a) Determine the N value.
(b) Correct the N value for rod length, sampler type, borehole size, and energy ratio to 60%.
(c) Make a preliminary description of the compactness of the soil.

Strategy:
The N value is the sum of the blow counts for the last 0.304 m of penetration. Just add the last two blow counts.


Solution

Step 1: Add the last two blow counts.
N = 16 + 19 = 35

Step 2: Apply correction factors.
From the Tables above;
CH = 60%
CB = 1.05
CS = 1.00
CR = 0.95

N60 = NCHCBCSCR/60 = (35 × 60 × 1.05 × 1.00 × 0.95)/60 = 34

Step 3: Use Table 5 to describe the compactness.
For N = 34, the soil is dense.

Correlations Using SPT

Although the applications of SPT results are entirely empirical, their extensive use has allowed for the accumulation of vast knowledge regarding the behaviour of foundations in sands and gravels. Relationships between N-values and properties like density and shearing resistance angle have been identified.

BS 5930 gives the following relationship between the SPT N-values and the relative density of a sand as shown in Table 5;

N’60 (blows/300 mm
of penetration)
Relative DensityDr (10%)
Below 4Very loose< 20
4 – 10Loose20 – 40
10 – 30Medium – Dense40 – 60
30 – 50Dense60 – 80
Over 50Very dense> 80
Table 5: Relationship between SPT number and the relative density of soil

Some correlations of the SPT with soil characteristics, in particular the susceptibility of a soil to liquefaction under earthquake conditions, require a further correction to N’60 to allow for the effective overburden pressure at the level of the test. In granular soils, the standard penetration number is highly dependent on the effective overburden pressure.

A number of empirical relationships have been proposed to convert the field standard penetration number N60 to a standard effective overburden pressure σ0‘, of 96 kN/m2 (2000 lb/ft2). The general form for standard sampler is;

N’60 = CNN60 ——– (3)

Several correlations have been developed over the years for the correction factor, CN. In standard geotechnical engineering textbooks, two of these given in Equations (4) and (5) are recommended for use (SI Units);

CN = 9.78√(1/σ0‘) ——– (4)

or

CN = 2/(1 + 0.01σ0‘) ——– (5)

Values of CN derived by Seed et al (1984) are shown in the Figure below;

CORRECTION FACTOR
Figure 5: Correction factor to N’ value to allow for overburden pressure

Correlation of SPT with Cohesive Soils (Clays)

The consistency and unconfined compressive strength (qu) of clay soils can be estimated from the standard penetration number N60. It is important to point out that the correlation between N60 and unconfined compressive strength is very approximate. The sensitivity, St, of clay soil also plays an important role in the actual N60 value obtained in the field. In any case, for clays of a given geology, a reasonable correlation between N60 and qu can be obtained as shown in Equation (6).

qu/Pa = 0.58N600.72 ——– (6)

Where Pa is the atmospheric pressure (in the same unit with qu).

Standard Penetration Number N60ConsistencyConsistency IndexUnconfined Compressive Strength kN/m2 (lb/ft2)
< 2Very soft< 0.5< 25 (500)
2 – 8Soft to medium0.5 – 0.7525 – 80 (500 – 1700)
8 – 15Stiff0.75 – 1.080 – 150 (1700 – 3100)
15 – 30Very Stiff1.0 – 1.5150 – 400 (3100 – 8400)
> 30Hard> 1.5> 400 (8400)
Table 6: Approximate Correlation between Consistency Index, N60, and qu

Stroud (1975) has established relationships between the N-value, undrained shear strength, modulus of volume compressibility, and plasticity index of clays as shown in Figure 6.

relationship between SPT and cohesion
Figure 6: Relationship between SPT number, plasticity index, and undrained shear strength of clay soil
relationship between SPT and volume of compressibility
Figure 6: Relationship between SPT number, plasticity index, and compressibility of clay soil

It is not advised to use the SPT in place of the direct approach of conducting laboratory tests on undisturbed samples to determine the shear strength and compressibility of clay soils. This is due to the fact that the correlations between the SPT and the strength and deformability of clays have only been established empirically, with no consideration of time effects, anisotropy, or the composition of the soil.

Correlation of SPT with Cohesionless Soils (Sands)

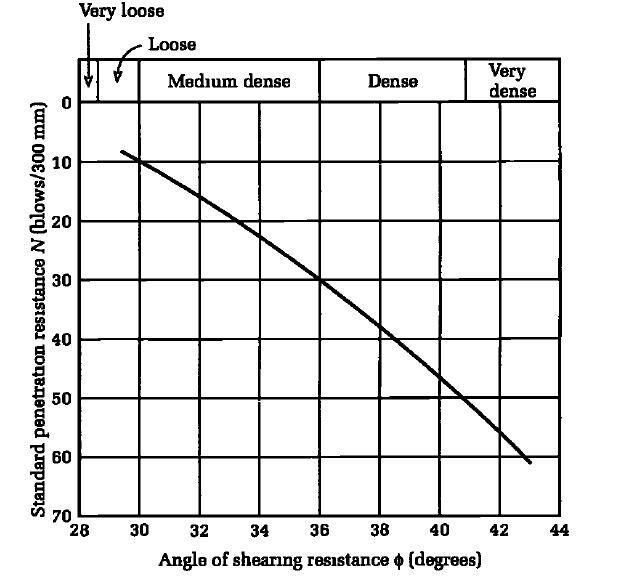
The drained angle of friction of granular soils, ϕ’, also has been correlated to the standard penetration number. Peck, Hanson, and Thornburn (1974) gave a correlation between (N1)60 and ϕ’ in a graphical form, which can be approximated as;

ϕ'(degrees) = 27.1 + 0.3(N1)60 – 0.00054(N1)602 ——– (8)

Schmertmann (1975) also provided a correlation for N60 versus σ0‘. After Kulhawy and Mayne (1990), this correlation can be approximated as;

ppo

Where Pa is the atmospheric pressure in the same unit as σ0‘.

Terzaghi and Peck also give the following correlation between SPT value, Dr, and φ as shown in Table 7.

ConditionNDr (%)ϕ’
Very loose0 – 40 – 15< 28°
Loose4 – 1015 – 3528° – 30°
Medium10 – 3035 – 6530° – 36°
Dense30 – 5065 – 8536° – 42°
Very dense> 50> 85> 42°
Table 7: Correlation between SPT value, Dr, and φ

Conclusion

The SPT can be completed quickly and easily. The equipment can penetrate dense materials and is widely available  The engineering characteristics of soils such as bearing capacity and foundation settlement have all been linked to SPT results. However, the majority of these correlations are marginal.

Errors can come from a variety of sources, such as test performance and the use of non-standard equipment. The incorrect lifting and dropping of the hammer, inadequate borehole cleaning prior to the test, and failure to maintain the groundwater level, if one exists, are examples of test performance errors. These mistakes result in N values that are not typical of the soil. For coarse gravel, boulders, soft clays, silts, and mixed soils containing boulders, cobbles, clays, and silts, SPT tests are unreliable.

Application of Digital Twin to Zagreb’s Water Distribution Network

A digital twin is computer software that simulates how a process or product would work using data from the real world. To improve the output, these systems can use artificial intelligence, software analytics, and the internet of things. These virtual models have become a mainstay in contemporary engineering to spur innovation and boost efficiency thanks to the development of machine learning and elements like big data.

To put it briefly, developing the digital twin of a system can enable the advancement of major technological trends, prevent expensive breakdowns in physical items, and test processes and services utilizing enhanced analytical, monitoring, and predictive skills.

According to a report by Bentley Systems, their software OpenFlows and OpenUtilities software have been used to address the water distribution challenges in Zagreb, the capital city of Croatia. A digital twin created for the system/model has also helped in the management of the system. Bentley Systems offer a lot of software solutions in infrastructure.

digital twin
Typical digital twin model [Source: Bentley Systems]

Managing a Water Supply Network that is Over a Century Old

One of the world’s oldest operational water networks, the 144-year-old Zagreb water delivery system was first built in 1878. Around 30,000 people lived in Zagreb, the capital of Croatia, at the time, with 11,150 of them having access to a water delivery system with a 4-kilometer radius and a 53.2 liters per second capacity. Since then, the population has increased, resulting in a daily water intake of 310,000 cubic meters and the need for water services for approximately 900,000 people over an area of 800 square kilometers delivered by an enlarged network extending 3,500 kilometers.

The public water supply and sewerage business in Zagreb, ViO Zagreb, appointed the company Hidroing the duty of digitizing the system to better manage the network because the water loss have increased dramatically over the previous two decades and have become significantly worse since the occurrence of the 2020 earthquakes.

water loss 1

Construction of a Digital Supply System

For the network’s ensuing thirty years of operation, ViO anticipated that Hidroing would provide a thorough master plan and water loss program. Hidroing was required to create a comprehensive hydraulic model for the EUR 1 million project based on an updated GIS model that allowed for full diagnostic of the supply system, district meter area (DMA) zoning, and numerous measurement locations. Hidroing, however, encountered considerable problems with data collecting and had trouble detecting flow, pressure, and chlorine levels.

WATER DISTRIBUTION NETWORK

They concluded they needed an integrated hydraulic modeling solution to enable intelligent water management in order to meet the owner’s expectations for digitizing the water supply network.

Hydraulic Modeling is Provided by Bentley Applications

Hidroing chose Bentley’s OpenFlows and OpenUtilities solutions for GIS (Geographic Information System) creation, 3D modeling, hydraulic modeling, on-site operations, and facility management after carefully weighing their options. A hydraulic model of the complete network was built and calibrated using 3,000 measurement locations, 144 DMA zones with unique situations, and 3,500 kilometers of pipeline.

Analyze and visualize utilities networks EDITED
Bentley OpenUtilities

They established a smooth connection for data integration by sharing statistical data between the model and the GIS platform using Bentley’s cutting-edge technology. One of the biggest digital twin models in Eastern Europe was developed with the help of the hydraulic modeling solution.

Smart Water Management is Powered by Digital Twin

According to Bentley Systems, Hidroing shortened the production and application of the calibrated hydraulic model for water loss reduction by 16 months by utilizing Bentley’s integrated modelling and analysis technologies. The initial timeframe for developing the GIS platform and producing and calibrating the model was 36 months. However, in under 20 months, they were able to create a finished model and digital twin that identified over 50 steps to reduce water loss utilizing OpenFlows and OpenUtilities.

Carbon-Positive Hotel Development in Colorado

Concrete is one the most utilised construction material in the world because it is strong, readily available, durable, and adaptable. However, numerous studies have shown that can concrete is also one of the most harmful materials to the environment due to its large carbon footprint. The concrete and cement industry contributes to about 8% of the world’s carbon emissions. This therefore reinforces the need for carbon-positive sustainable construction.

According to the Paris Agreement, emissions from iron and steel, as well as cement and concrete and other sectors, must be net-zero by 2050 – 2070 or the owners will suffer the marginal cost of negative emissions at that time.

global CO2 emmisions by industry
Global CO2 emmisions from industry [Source: World Economic Forum]

To achieve net-zero CO2 emissions in these industries, material efficiency must be improved to minimize primary demand for these materials, more and higher-value recycling must be implemented, and production must be decarbonized. As a result, the project team of hotel development in Denver, Colorado, is meticulous about creating and adhering to its carbon budget, because the plans for a new hotel in Colorado call for a concrete structure that is carbon-positive.

According to Grant McCargo, co-founder, CEO, and Chief Environmental Officer of real estate developer Urban Villages, “The built environment, including homes, accounts for 45 percent of the global carbon footprint every year, and as developers, we need to take some responsibility for that impact. Because of this, we made the brave decision to become carbon positive, which means that this hotel will offset more carbon than it produces“.

According to McCargo, Urban Villages is building the hotel with sustainable design and construction elements to stay under its 4,397 MT CO2e structural carbon budget (This equates to the annual energy consumption of 530 houses.)

Exterior of the Hotel

The hotel is being built on a 10,000 square foot triangle-shaped plot of land in downtown Denver, at the junction of 14th Street and West Colfax Avenue. The famous location is next to Civic Center Park, a 12-acre public park encircled by historic government and museum structures, including the Colorado State Capitol.

The hotel will rise 13 floors and feature 265 guest rooms when it is finished, which is expected to be in late 2023. The hotel’s name, Populus, is derived from the aspen trees of Colorado, scientifically known as Populus tremuloides, which are represented on the spectacular front with domed windows.

Americas First Carbon Positive Hotel Begins Construction in Colorado 3

The first carbon-positive hotel in the United States, according to reports, will be Populus. The project’s carbon-positive objectives will also be helped by a major ecological effort off-site, including a preliminary promise to plant trees equivalent to more than 5,000 acres of forest, according to McCargo. This offset of embodied carbon is roughly equal to 500,000 gallons of gasoline. Urban Villages intends to plant more trees in the future to reduce the energy needed to run the hotel.

A Paradigm Shift in Conventional Design

The initiative got off the ground in 2017 when the city of Denver requested hotel proposal submissions. According to McCargo, his company filed a proposal in an effort to make a lasting impression on Civic Center Park, which was originally created as part of the city’s 1867 bid to become the state capital. Recently, the city invested millions on reviving the park.

According to McCargo, “We appreciated the opportunity to go in and make a huge difference. We were chosen for the project, not because we had the lowest bid, but rather because they trusted us to make a positive change“.

To achieve this, Urban Villages collaborated with renowned architecture firm Studio Gang on a plan that would be both aesthetically pleasing and environmentally beneficial, the latter of which involved completely transforming the location of Denver’s first gas station. The ambitious project attracted Studio NYL, who was keen to take on the role of structural and façade engineer.

According to Chris O’Hara, P.E., founding principal of Studio NYL, “The kind of work that we take on has some aspirational purpose – sometimes it’s performance, sometimes it’s establishing aesthetics.” This project aims to be a carbon-positive building during its lifespan in addition to being an iconic structure in a key location.

The majority of the hotel’s carbon-positive objectives will be met through building operations, but O’Hara points out that a number of structural elements, such as the façade and concrete mix, will significantly boost its effectiveness.

Aerial View of the Hotel’s Roof and Exterior

In order to create a high-performance building and reduce the number of mechanical systems required to maintain it, O’Hara asserts that a tight envelope was crucial. “The main goal for the structure is to reduce the quantity of carbon in the concrete. As structural engineers, we make a great effort to limit material consumption and stick to our carbon budget.

Aerial view of Hotel being built with Carbon-Positive Concrete
Aerial view of the hotel’s Roof and Exterior ( Courtesy of Studio Gang)

Low-Carbon Concrete

The team decided on reinforced concrete despite its high embodied carbon because of the project’s tight design requirements. According to O’Hara, the site’s geometry, height restrictions imposed by sightlines to the state building, and the square footage all contributed to the necessity of using concrete.

According to O’Hara, “All of these many things made a flat slab concrete system most appropriate to the architecture.” So, the true question was, “How can we take a building with so much cement in it and make it efficient from carbon perspective?”

The team is employing a number of strategies to reduce the amount of concrete in the project in order to achieve that goal. According to O’Hara, these include maximizing slab continuity, positioning columns to benefit from external cantilevers, and reducing column transfers while taking into account the effects on the necessary amounts of steel reinforcement.

According to O’Hara, the integration of the column arrangement and cantilevers with the unit layout and the façade support system are the most crucial components. The design team assessed a range of spacing options and cantilevers to work with the unit needs and mechanical circulation, and how those interacted with the main level and amenity needs, with the goal of reducing the amount of material used.

To stay within the carbon budget, the team will employ low-carbon concrete in addition to keeping the amount of concrete in the project to a minimum. For instance, the use of fly ash lowers the carbon content of concrete, and a minimum of 20% fly ash replacement was adopted in the project. The embodied carbon for each form of concrete placement, such as the drilled piers, walls, columns, flat slabs, was kept to a minimum.

According to O’Hara, carbon sequestration, a procedure that turns carbon dioxide into a mineral that is indelibly incorporated into concrete, could further further reduce the amount of carbon in the concrete. Although carbon sequestration is not yet taken into account in the embodied carbon budgets of the project, but O’Hara believes that incorporating carbon sequestration in their mix design is a top priority for the project team.

Façade Style

The hotel’s envelope will be crucial to fulfilling the project’s carbon-positive objectives, just like the concrete mix is. The facade’s style is pleasing to the eye and is reminiscent of the aspen trees seen throughout the state. According to McCargo, “As an aspen tree grows, the branches fall off lower down with most of the canopy up higher. Where those branches fall off, it makes this charcoal gray eye-shaped eyelet. So, when you look at the facade and think, ‘Wow, look at all of those different windows,’ it’s mimicking what the trunk of the tree looks like, and it creates a fun shape”.

aspen tree
Aspen Tree
FACADE STUDIOGANG
Facade Style (CREDIT : Studio Gang)

Fenestration

The positioning and design of the windows are meant to lower the building’s energy requirements in addition as producing quirky patterns on the front. The dome-shaped window design also enables self-shading, which further reduces solar gain, according to O’Hara. “We have a truly opaque system with less vision glass than many buildings of this typology, which means our solar heat gain is substantially less,” he says. “Having that vision glass well shaded was a major part in terms of getting improved building performance in Colorado, with the high solar intensity.”

Window
The rooms inside Populus will be minimal with views of the surroundings

The procedure for fastening the façade to the building is another vital component in attaining the project’s carbon-positive goals. Glass fiber reinforced concrete panels around 20 feet tall by 10 feet wide will make up the façade. The panels will attach at the floor lines every 10 feet with dead weight anchors, as opposed to a standard rain screen that fastens to the structure every 24-48 inches, according to O’Hara. With fewer potential thermal bridges in the façade, he explains, “we can reduce the amount of thermally damaged connections we need.”

Industry Standard

The project team believes that by taking deliberate measures to reduce the amount of carbon in the building’s structure, the hotel will be well-positioned to accomplish the remainder of its carbon-positive goals through building operations. This, according to McCargo, includes composting, off-site renewable energy, and everyday operational effectiveness. When you look at this project holistically in terms of how it will be run and managed, that’s where a lot of the carbon objectives are fulfilled, O’Hara acknowledges, “We can do only so well with a concrete building.”

Although building activities will ultimately turn this project into a carbon-positive one, O’Hara believes that strict carbon budgets like this will eventually become the standard.

Every project that leaves this office is currently undergoing a life-cycle assessment, he says. “We believe that without measurement, management is impossible. As we move through the schematic design, we will begin informing our project partners about the carbon footprints of the various material possibilities, whether or not they want to know. Owners may choose to ignore such information, but it is our responsibility to at least provide them with it so they can make wise judgments.

According to Mere Hall, P.E., S.E., senior associate of NYL Studio, as more developers become aware of this knowledge, it is anticipated that more will take the environmental effects of their projects into account. The major objective, according to her, is to disseminate information so that people may begin having conversations that will advance efforts toward greater environmental sustainability. “I sincerely hope that this becomes the industry norm and a component of the services we offer to advance projects.”

Introduction of Smart Motorways Technology to the Bruce Highway, Queensland Australia

Motorways with information, communications, and control systems built into and alongside the road are referred to as “smart motorways” (also known as controlled motorways). These technology-based systems are used to actively regulate traffic flows, increase road capacity, and improve road safety. They also provide other significant benefits for road users, such as improved trip reliability and real-time traveller information.

Smart motorway employs traffic management techniques to expand capacity and lessen congestion in particularly congested regions. The hard shoulder can be used as a running lane, and variable speed limits can be used to manage traffic flow. By minimizing the need to add more lanes, Highways England (formerly the Highways Agency) developed smart motorways to manage traffic in a way that minimizes its negative effects on the environment, cost, and construction time.

featured 1

Smart motorways comprise an integrated package of intelligent transport systems (ITS) interventions. This includes coordinated ramp signaling, speed and lane use management, traveler information (using variable message signs) and network intelligence (such as from vehicle detection equipment).

The Department of Transport and Main Roads has disclosed that new traffic control technology would be installed along a 60-kilometer stretch between Pine River and Caloundra Road in Queensland, Australia order to monitor traffic conditions in real-time. Agencies will be able to proactively monitor changing situations like accidents, inclement weather, or congested traffic conditions by using ramp signals, variable speed limit and message signs, vehicle detection systems, and CCTV cameras.

According to the Federal Minister for Infrastructure, Transport, Regional Development, and Local Government, Catherine King, “As part of our commitment to improving the safety and performance of our national highways, the Australian Government has allocated $84 million towards this project, which is part of the 15-year, $13 billion Bruce Highway Upgrade Program.”

An illustration of smart motorways technology.
(Image Credit: LLOT WORLD)

At various sites throughout the project corridor, targeted vegetation clearing, site establishment, investigative activities, and earthworks will also take place. Widening the southbound entry ramp to the Bruce Highway and installing a number of technology, such as ramp signaling, variable speed limit signs, and a new shared route across the highway, are both being prepared for near Caboolture-Bribie Island Road.

To track vehicle travel durations, traffic flow, and speed, the initiative will install wireless traffic sensors at strategic spots along the highway. The coverage and resolution offered by these traffic sensors will be sufficient to track the operation of the highway in real-time.

The majority of the work will be done at night to minimize inconveniences due to the high traffic loads. The safety of drivers and road workers will be ensured by traffic controllers, slower speed restrictions, and signs.

Weather and building circumstances permitting, construction is anticipated to be finished in 2024. The Australian and Queensland governments split the $105 million cost of the Bruce Highway – Managed Motorways Stage 2 – Gateway Motorway to Caloundra Road Interchange project 80:20.

Voided Slab Bridge Decks: Design and Construction

Utilizing void formers of some sort to create a voided slab is one of the most popular ways of reducing the weight of a solid slab. In the design of bridges, the deck serves as the primary component for distributing the traffic load to the supports. The deck slab may be solid or have longitudinal and transverse girders to distribute the load to the piers or abutment.

For the same span, solid slab type bridges require more steel and concrete than girder bridges do. The major load-bearing components of slab type superstructure bridges are the slabs themselves. Through the solid slabs, the loads are directly transferred to the substructure. Solid slab decks comprises of a solid section, without beams or voids (See Figure 1a). This type of deck is commonly used in the construction of short span bridges and culverts.

The dead load of a solid slab increases excessively for bridge spans longer than 10 metres, so to lighten the structure, voids with rectangular or circular cross sections are added close to the neutral axis (See Figure 1b). As a result, the use of voids inside the deck slab produces a favourable outcome by reducing the weight of the slab.

Solid Slab bridge and voided slab bridge
Figure 1: Typical cross-sections (a) Solid slab bridge deck (b) Voided slab bridge deck

When the voids are less than 60% of the overall structural depth, their effect on stiffness is minimal and the deck behaves more or less like a plate. In order to assure continuity in the transverse direction, voided slab decks are often constructed using cast in situ concrete with permanent void formers or precast prestressed concrete box beams post tensioned transversely.

In effect, slabs that have voids within them are known as voided slabs. The voids, which are typically cylindrical, are made by embedding hollow, thin-walled steel parts into the slab. The slab’s voids contribute to the reduction of the structure’s self-weight. Voided slabs’ primary purpose is to reduce the volume of the concrete and, as a result, the slab’s self-weight.

If properly designed, it can lower the self-weight of the slab by up to 35% for the same section and span when compared to a solid slab. If the void diameters are less than 60% of the slab depth, voided slabs can be modelled and designed using the same methodology as solid slabs.

Construction Methodology of Voided Slabs

The two main techniques for constructing voided slab systems are the filigree method, in which some components are precast at a workshop or concrete yard, and the on-site method, in which the entire system is cast in situ. Both techniques require the use of void formers, reinforcements/strands, and concrete.

Void forming is an essential part of voided slab construction. Plastic voids can be used in both techniques of voided slab construction. These voids are usually formed from recycled plastic, which is spherical and hollow. The presence of voids makes the slab lighter than conventional solid concrete slabs.

However, the commonest form is circular polystyrene void formers. Although polystyrene appears to be impermeable, it is only the much more expensive closed cell form which is so. The voids should therefore be provided with drainage holes at their lower ends. It is also important to ensure that the voids and reinforcement are held firmly in position in the formwork during construction. This avoids problems that have occurred with the voids floating or with the links moving to touch the void formers, giving no cover.

poystyrene void formers
Figure 2: Use of polysyrene as void formers during bridge deck construction

The steel reinforcement or tendons (for post-tensioned construction) is an additional important component. The slab is reinforced with steel to prevent flexural failure, and the voids are held in place in the middle of the slab by a cage of thin steel. The concrete that encloses the voids is the third element. The strength of the slab is ultimately determined by the concrete.

Advantages of Voided Slab

  • Reduction in dead weight up to 35% allows cost reduction in substructure i.e. footing and Piers. The structural engineer can lighten the floor by more efficiently using the concrete.
  • Reduced concrete usage- The use of 1 kg recycled plastic void former can replace 100 kg of concrete thereby, leading to environmentally green and sustainable construction with reduced energy and carbon emissions.
  • It allows longer spans between columns without increasing the thickness of the slab by large. Voided slabs can take advantage of post-tensioned reinforcement benefits to provide a thin slab with a greater span.
  • The elimination of downstand beams allows the quicker and cheaper erection of shuttering and services. Flat-plate construction eliminates beams and drops, resulting in reduced floor-to-floor heights.
  • Some voided-slab systems can reduce construction time, especially precast systems or those placed on flat-plate forming systems.
  • Voided slabs are beneficial in seismic design since the reduced dead weight of floors results in lower seismic forces applied to structures.
  • This reduced weight of building floors also permits engineers to reduce columns, walls, and foundations by as much as 40%, although concrete can’t be removed from all locations in a floor slab; voids are omitted near columns to maintain slab punching-shear capacity.

Design of Voided Slab Bridge Decks

The bridge can be analysed similarly to a solid slab as long as the void diameters are less than or equal to 60% of the slab thickness and nominal transverse steel is given in the flanges. In other words, the slab can be designed without taking into account either the decreased transverse shear stiffness or the local flange bending. EN 1992-2, in contrast to the earlier British regulation, does not provide particular guidelines on voided slabs. The British Standards Institution’s accompanying “PD” does, however, contain some information.

Voided slab bridge deck
Figure 3: Typical 3D rendering of a voided slab bridge deck (Díaz et al., 2010)

The voided slab section is designed longitudinally in both flexure and shear, making appropriate allowance for the voids. Links must be provided, and they are designed as done for flanged beams, bearing the beam’s thinnest web thickness in mind. Particularly if isolated piers are utilised, the shear loads are likely to increase excessively close to the supports. To solve the issue, the void can be easily closed off, leaving a solid part in these critical regions.

Larger diameter voids or square voids forming a cellular deck can be employed if more weight reduction is needed. The analysis must therefore take these into account. The section is treated as a monolithic beam for the purposes of calculating the longitudinal stiffness to be employed for a cellular deck. Under uniform and non-uniform bending, such a structure responds  differently in the transverse direction. The top and bottom flanges rotate about their individual neutral axes in the latter case while acting compositely in the former.

This indicates that with uniform bending as opposed to non-uniform bending, the accurate flexural inertia can be an order of magnitude higher. However, the behaviour can be modelled using a shear deformable grillage in a standard grillage model. Utilizing the composite flexural characteristics, an equivalent shear stiffness is calculated to represent the additional distortion caused by non-uniform bending.

bending stress in the x direction
Figure 4: Typical Bending stress in x-direction of voided slab bridge deck (Díaz et al., 2010)
bending stress in the y direction
Figure 5: Typical Bending stress in y-direction of voided slab bridge deck (Díaz et al., 2010)

The reinforcement should be designed once the moments and forces in the cellular structure have been determined. Local moments in the flanges must be taken into account in addition to the longitudinal and transverse moments in the entire section. This results both from the transverse shear and the wheel loads placed on the deck slab. This shear has to be transmitted across the voids by flexure in the flanges, that is by the section acting like a vierendeel frame.

To improve the structural response and to avoid undesired tensile forces in the concrete, post-tensioned steel tendons are embedded into the concrete at the final stages of construction. The common layout of the tendons is parabolic, with negative eccentricities in the mid-span and positive in the pier zones.

post tensioned voided slab bridge
Figure 6: Three-dimensional finite element model of a voided slab deck with shell and beam elements (Díaz et al., 2010)

Grillage Analysis for Voided Slab Decks

Despite the obvious benefits of voided slab decks, the analysis of the structural model is made more difficult by the voided slab form. While a voided slab has a varying amount of material depending on the direction, a solid slab with a consistent thickness has the same bending stiffness in all directions. As a result of this, defining grillages in the longitudinal and transversal deck directions is a highly popular option, where the grillage’s longitudinal beams are situated in the areas between voids, as shown in Figure 7.

grillage model for voided slab bridge
Figure 7: Grillage model of a voided slab deck (Díaz et al., 2010)

However, the stiffness attributed to each element in the grillage must be adjusted since in this discretization one-dimensional structural elements are used to describe the performance of a two-dimensional plate. The planar grillage analogy is said to be inaccurate when cantilevers are present, therefore a three-dimensional grillage is necessary, like the one in Figure 8, where the layer discretizing the voided slab and the layer modelling the cantilevers are joined together using stiff components.

3D GRILLAGE ANALYSIS
Figure 8: Three-dimensional grillage model of a voided slab deck with two layers joined by rigid beams (Díaz et al., 2010)

The grillage model, however, is an approximation of the deck’s actual behaviour and does not adequately capture the coupling of the slab in torsion or the local effects. Therefore, it is beneficial to create structural models, such as the orthotropic plate technique, that more accurately depict the deck’s resistance scheme.

Reference(s)

Díaz J., Hernández S., Fontán A., Romera L. (2010): A computer code for finite element analysis and design of post-tensioned voided slab bridge decks with orthotropic behaviour. Advances in Engineering Software 41 (2010) 987–999 doi:10.1016/j.advengsoft.2010.04.005

How Engineers should Engage with Host Communities

One of the main goals of civil engineering is to enable resilient and sustainable communities, as such every civil engineer should be involved actively in the communities where they operate. Therefore, how engineers should interact with the communities they work is of utmost importance. According to the Institution of Civil Engineers (ICE) Code of Conduct”, All members must fully consider the public interest, particularly when it comes to issues of health and safety and the welfare of future generations”.

Engineers are being requested more frequently to take on “wicked problems,” which are issues without a single, obvious technical solution. Wicked problems are understood to be complex, ill-structured problems that are located in a real-world context and concern technical as well as societal issues. Such problems are characterised by powerful conflicts of interest and differences in norms and values between stakeholders.

Developing a new understanding of engineering’s role in the delivery of infrastructure is necessary for community engagement. This involves taking into account how engineers collaborate with experts in community engagement and recognized community leaders. According to the World Bank, the public expects their opinion to count when it comes to infrastructure or energy projects in their community.

community engagement

Stakeholders are important for the success of public projects; everything from large-scale resource projects and transportation infrastructure, to the creation of regional community facilities. Due to alleged shortcomings in participatory design and the standard of public consultation, recent high-profile projects in the fields of gas, energy, electricity, water, wind, waste, and transport have all attracted public controversy, outrage, and media attention. Some organisations have even hired security firms to facilitate community engagement in some areas due to a serious breakdown of relationships.

At every point in the lifetime of an infrastructure, from design to decommissioning, engineers are responsible for effectively interacting with local populations. The obligation extends across all organizational levels and stages of a person’s career, from an apprentice and graduate to a senior leader and policy maker.

Read Also
The Everyday Engineer

Community Involvement

Engaging the community during the initiation, planning, and execution of a project can help with increase and share gains. Furthermore, project delivery and results can be improved by minimizing and mitigating the potential adverse effects of the project on the host community. A community’s economic, environmental, and social outcomes may suffer significantly over time if communities are not involved in project development. It is now generally understood to be very important for each project to engage local people and other stakeholders in dialogue and develop trusting relationships.

community interaction in construction projects

Professor Sarah Bell, who serves as the Chair ICE Community Engagement Community of Practice, asserts that the Institution of Civil Engineering (ICE) has created a set of principles to support excellent practice in community interaction. According to her, “ICE Principles for Community Engagement with Engineering Community engagement takes many forms, depending on the site, project and community.”

The set of guidelines developed by ICE for community engagements are as follows;

  1. Supporting sustainable, thriving communities is a core purpose of the engineering profession.
  2. Community impacts and interests are integral to engineering design and delivery.
  3. Community engagement should begin at the conception of projects and continue throughout the engineering and infrastructure lifecycle.
  4. A tailored engagement approach with clear objectives, processes and expectations should be agreed among all stakeholders at the outset of infrastructure decision-making and planning.
  5. Engineering and infrastructure projects should identify the diverse needs of communities they work with, giving special attention to include groups that are typically marginalised.
  6. Community engagement should consider how individuals and groups of different race, age, faith, disability, gender, sexuality, family circumstances, economic status, and other characteristics may be differently impacted by infrastructure development and may welcome different forms of engagement.
  7. Methods of engagement should recognise power inequalities and enable two-way communication and learning between communities and engineering projects.
  8. Information about engineering projects and their impacts should be shared with community members as part of a two-way process, with information being accessible to all people.
engineers without borders

According to Sarah, “The ICE Principles for Community Engagement with Engineering were created based on existing literature and then refined with input from stakeholders and civil engineers.”

The principles are designed to be flexible enough to fit a variety of situations, locations, industries, and project sizes. They can assist engineers at various career junctures and power levels. They serve as a starting point for the creation of best practice case studies and instructions. Then, through engineering education and professional development, these can be shared. The guiding principles define the goal, significance, and character of effective community engagement.

They also issued a challenge to the industry, asking it to consider how to collaborate with communities as essential partners in the delivery of resilient and sustainable infrastructure. The guiding principles shed light on how the fundamental knowledge and expertise of civil engineers and other professionals working in the built environment must change in order to face this challenge.

List of Soil Tests for Foundation Design

By performing laboratory tests on soil samples collected from trial pits or boreholes, it is possible to measure the physical and mechanical properties of natural soils for foundation design. For example, calculating the ultimate bearing capacity of soils or the stability of slopes in foundation excavations and embankments can be done using the results of shear strength tests.

Furthermore, laboratory soil tests provide information from which soils can be categorised and predict how they would behave under foundation loads. The results of the soil tests can be used to develop ways for treating soils that will help excavations proceed more smoothly, particularly when dealing with groundwater issues.

It is important to keep in mind that natural soil deposits vary in composition and degree of consolidation, necessitating the need for considerable judgment based on common sense and experience when evaluating soil test results and determining when they should be disregarded. Laboratory tests shouldn’t be relied upon blindly, especially if there aren’t many samples of soils tested.

test
Triaxial soil test

Any bearing capacity estimates or other engineering design data should be confirmed, to the extent practicable, with known conditions and prior experience. The test results should be evaluated in conjunction with the borehole loggings and other site observations. The simplicity of laboratory tests should be maximised.

Expensive equipment tests are time-consuming, costly, and prone to serious error unless meticulously and diligently performed by highly skilled technicians. If the samples are few or if the cost is large relative to the project cost, such procedures could not be very justifiable.

Only if the enhanced accuracy of the data will result in substantial design savings or will eliminate the possibility of an expensive failure, as in the case of geotechnical category 3 investigations (very heavy and complex structures), are complex and expensive tests justified. An important argument in favour of conducting a suitable number of soil tests is the accumulation of relevant data over time linking test findings to foundation behaviour, such as stability and settlement, which gives engineers more confidence in the use of laboratory soil tests.

The soil test results are a useful corrective to engineers’ “wishful thinking” in their initial assessment of the strength of soil as it appears in the borehole or trial pit, at the very least giving a check on field descriptions of boreholes based on visual observation and handling of soil samples.

List of Soil Tests for Foundation Design

The soil mechanics tests made in accordance with BS 1377 which concern the foundation engineer are as follows;

(a) Visual examination
(b) Natural moisture content
(c) Liquid and plastic limits
(d) Particle-size distribution
(e) Unconfined compression
(f) Triaxial compression
(g) Shear box
(h) Vane
(i) Consolidation
(j) Swelling and suction
(k) Permeability
(l) Chemical analyses

Soil Classification Tests (Index Properties Test)

Tests (a) through (d) are necessary for soil characterisation (soil classification tests). Laboratory visual tests are used to note the colour, texture, and consistency of the site-received samples for disturbed and undisturbed samples. This should be done as a normal review of the descriptions provided by the field engineer or boring foreman.

Natural Moisture Content Test

In order to plan the schedule for shear strength tests and to make sure that testing on the softer soils (as suggested by the greater moisture content) is not skipped, natural moisture content test results are compared and related to the liquid and plastic limits of the relevant soil types.

Atterberg Limit Tests

Cohesive soils are subjected to liquid and plastic limit tests to classify them and predict their engineering characteristics. The compressibility of clays and silts can be predicted using the plasticity chart. It is important to know if the soil is of organic or inorganic origin to apply this chart.

PLASTICITY CHART
Plasticity Chart

The standard practice is to conduct liquid and plastic limit tests on a small number of carefully chosen samples of each primary soil type discovered in the boreholes. The different soil types can be grouped in general order of compressibility by comparing the results and showing the data on the plasticity chart, and samples can then be chosen accordingly for consolidation tests if they are necessary.

Particle Size Distribution Test

The particle-size distribution test is a type of classification test, where the soil particles are graded according to their sizes. The grading curves can be displayed on the graph using sieve analysis, sedimentation or hydrometer analysis, or a combination of both.

set of bs sieves for particle size distribution test
Set of BS Sieves for Particle Size Distribution Test

The grading curves are of no direct value in assessing allowable bearing pressure, and generally, this type of test need not be made in connection with any foundation investigation in clays or in the case of sands and gravels where the excavation is above the water table.

particle size distribution curve 1
Particle size distribution curves

However, the particle size distribution test is particularly useful when examining excavation-related issues in permeable soils below the water table because the results can be used to determine which of several geotechnical processes is practical for lowering groundwater levels or treating grouting problems.

Shear Strength Test

The ultimate bearing capacity of a foundation and the earth pressure on sheeted excavations (braced cuts or sheet pile walls) can both be calculated simply from the shear strength of the soil.

Unconfined Compression Strength (UCS) Test

The simplest type of shear strength test is the unconfined compression strength (UCS) test. Cohesionless soils, clays, and silts, which are too soft to stand in the machine without collapsing before the load is applied, cannot be subjected to UCS tests. The values are lower than the actual in-situ strength of fissured or brittle soils in this scenario.

Triaxial Test

In comparison to the unconfined compression test, the triaxial compression test is a more adaptable way to measure shear strength since it can be used for a greater variety of soil types. The test circumstances and observations can also be adjusted to address a variety of engineering problems.

triaxial testing in the lab
Triaxial Test

The Mohr-Coulomb equation is used to calculate the cohesiveness (c) and the angle of shearing resistance (ϕ) of soil under three different situations;

Undrained shear (total stresses)
su = Cu

Drained shear strength of sands and normally consolidated clays (effective stresses)
s = σn‘ tan ϕ’

Drained shear strength of over-consolidated clays
s = Cu + σn‘ tan ϕ’

Drained residual (large strain) of clays
Sr = Cr‘ + σr‘ϕr

The three main types of triaxial test are;
(1) Unconsolidated Undrained (UU)
(2) Consolidated Undrained (CU)
(3) Consolidated Drained (CD)

Unconsolidated Undrained (UU) Test

In the unconsolidated undrained test, the specimen is not permitted to drain while the all-around pressure is applied or while the deviator stress is applied, hence the pore pressure is not permitted to dissipate at any point during the test. This test approach reproduces the conditions that arise when the soil beneath the full-scale foundation is loaded or when the earth is removed from an open or sheeted excavation in the case of saturated fine-grained soil. Under these circumstances, the pore pressures in the soil behind the face of an excavation or beneath the laden foundation cannot dissipate during the application of load.

Consolidated Undrained (CU) Test

Total stresses are used in the assessments to determine the ultimate bearing capacity of the foundation soil or the initial stability of excavations. The specimen is allowed to fully consolidate during this stage of the test since the consolidated-undrained test protocol calls for letting the specimen drain while applying all-around pressure. During the application of the deviator stress, drainage is not permitted.

Consolidated Drained (CD) Test

When conducting a drained test, pore water from the specimen may be drained both during the stage of consolidation under all-around pressure and while the deviator stress is being applied. The time allotted for deviator stress application and consolidation under all-around pressure must be slow enough to prevent pore pressure buildup at any point during the test.

consolidated drained test
Mohr Circle for Consolidated Drained Test

The procedure for consolidated-undrained and drained tests corresponds to the conditions when the soil below the foundation level is sufficiently permeable to allow dissipation of excess pore-water pressure during the period of application of foundation loading, or when pore-water pressure changes can occur due to external influences at any time during the life of a structure.

Consolidated-undrained or drained tests are also used to look at the long-term stability of excavated slopes. These issues with long-term stability are examined in terms of effective stress. Standard soil mechanics textbooks are recommended for the reader to consult for explanations of test protocols and data interpretation. For category 3 investigations and to get small strain values of Young’s modulus for use in finite element analysis, the development of triaxial testing techniques, such as the insertion of probes or other devices into the test specimen, can be justified.

Vane Shear Test

Triaxial tests are often only used on weak rocks, peats, clays, and silts. The easiest way to empirically evaluate the angle of shearing resistance of sands and gravels is through in-situ tests. The vane shear test is more appropriate for use in the field than in a lab. However, the laboratory vane test has a useful application when very soft clays and silts have been successfully sampled undisturbed using standard techniques but it is impossible to prepare specimens from the tubes for shear strength tests using the unconfined or triaxial apparatus due to their softness.

Shear Box Test

The shear box test can be used to determine the shearing resistance of soils, but it is not used in preference to the triaxial test because of difficulties in controlling drainage conditions, and the fact that the failure plane is predetermined by the apparatus. However, in relation to studies of shaft friction in piles, the shear box has practical uses for evaluating the interface shear between soils and materials like concrete and steel.

direct shear box test apparatus
Direct shear box test apparatus

Additionally, the reversing shear box soil test offers a practical method for determining the residual or long-term shear strength needed to determine the stability of earth slopes when failure may occur on an old slip surface. The big strain parameters c and ϕ are also obtained using the ring shear test.

Consolidation Tests

Consolidation test results are used to estimate the amount and rate of soil consolidation (time-dependent settlement and compression of soils) beneath foundations. Because the material is contained within a metal ring and only one direction of stress is applied, the test is more appropriately referred to as a one-dimensional consolidation test. The instrument used is called an oedometer, also known as a consolidometer. The rate of settling of the full-scale structure can be calculated using the coefficient of consolidation (cv) that is derived from the test data.

consolidometer
Consolidometer

The coefficient of volume compressibility (mv) is determined from the pressure—voids ratio curve that is drawn using the load—settlement data received from the complete cycle of loading and unloading. This is used to determine the amount of consolidation settlement that will occur under a specific loading.

Since the theories on which settlement estimates are based are restricted to these sorts of fine-grained soils, consolidation tests are only applicable to clays and silts. The coefficient of consolidation as determined by oedometer tests on typical 75 mm specimens may be significantly off when used to calculate the rate of settlement. This is due to the possibility that a 75 mm specimen may not accurately depict the soil’s “fabric,” such as the presence of fissures, laminations, root holes, etc.

Consolidation tests should be performed on specimens with a diameter of 200 or 250 mm when soils display a type of fabric that will affect the permeability and, consequently, the rate of consolidation. As an alternative, it is possible to determine the rate of consolidation by observing how quickly large-scale buildings on comparable soil types settle. The settlement of buildings built on sands is typically assessed using data from field tests.

Swelling and Suction Tests

Swelling and suction tests are used to assess the effects of moisture content changes on desiccated clays and unsaturated soils.

Permeability Tests

Permeability tests can be made in the laboratory on undisturbed samples of clays and silts, or on sands or gravels which are compacted in cylindrical moulds to the same density as that in which they exist in their natural state (as determined from in-situ tests).

Permeability of soil
Permeability of soil experimental setup

However, it is questionable how useful the results of laboratory tests on a few samples from a vertical borehole will be in determining the representative permeability of the soil in order to determine how much water needs to be pumped from a foundation excavation or how quickly large foundations will settle. It is best to use tests like boreholes or field pumping tests to determine the permeability of the soil at a specific site.

Chemical Analysis

To determine whether the condition of buried steel and concrete foundation structures might deteriorate, chemical tests of soils and groundwater are necessary. Finding the pH value and chloride content of the soil and groundwater is typically sufficient for steel structures like permanent sheet piling or steel bearing piles.

The sulphate content and pH value are typically necessary for concrete buildings. Although the pH value, a measurement of how acidic or alkaline the soil or groundwater is, cannot be used to directly determine the type or amount of acidic or alkaline material present, it is a useful index in determining whether more information is needed to determine the precautions to be taken in protecting buried concrete structures.

soil pH
Soil pH Testing

For example, a low pH value indicates acid conditions, which might result from naturally occurring matter in the soil or which might be due to industrial wastes dumped on the site. In the latter case, detailed chemical analyses would be needed to determine the nature of the substances present, to assess the health risks to construction operatives and in the long term to the occupants of the site, and to assess their potential aggressiveness towards concrete.

Geological Disposal of Radioactive Wastes

Geological disposal has been deemed the safest permanent solution for disposing of nuclear wastes. This method entails burying the waste several hundred metres beneath solid rocks at a Geological Disposal Facility (GDF). In numerous countries, including Canada, Finland, France, Sweden, and Switzerland, this strategy has already been adopted. Some of these nations such as Sweden and Finland have made significant progress in creating their own GDFs.

The use of geological disposal is made possible by cutting-edge engineering, science, and technology. This entails isolating the radioactive waste in tunnels and vaults that are 200 to 1000 metres below the surface and are completely sealed. The radiation is safely contained in the vaults as it degrades naturally over time, and it is never allowed to rise to the surface in dangerously high concentrations.

Geological disposal facility 4

Solid radioactive waste is packed in safe, engineered containers, usually made of metal or concrete, and buried hundreds of metres below the surface in a stable rock formation with the containers encased in clay or cement. The term is referred to as the “multi-barrier method”.

Recently, the All-Party Parliamentary Group on Infrastructure (APPGI) in the UK has received an industry update on GDF from Karen Wheeler, CBE, the Deputy CEO and Major Capital Programmes Director in the UK. Karen disclosed the information to the Institution of Civil Engineers (ICE) UK. The APPGI is Parliament’s leading cross-party group dedicated to economic infrastructure in the UK. According to Karen, she was thrilled to inform the APPGI about the crucial infrastructure program that her organization is in charge of this month.

Environmental Sanitization

On the environmental clean-up, she explained, “For more than 60 years, nuclear technology has been a part of our daily life. It has been used to power houses and companies, identify and cure severe ailments, and defend our nation. Nevertheless, this technique has produced radioactive waste that must be handled carefully over an extended period. Although current above-ground storage is secure, it is not a long-term solution.”

The UK government has tasked Nuclear Waste Services (NWS), a division of the Nuclear Decommissioning Authority (NDA), with finding a long-term solution for higher activity radioactive waste in order to safeguard the environment and future generations. The use of Geological Disposal has been universally accepted as the long-term and sustainable solution to nuclear waste containment.

Geological disposal requires no ongoing maintenance, and it is less vulnerable than surface storage to human activities such as terrorism or war. Furthermore, it is less vulnerable than surface storage to natural processes such as climate change. With this approach, the waste will finally be permanently sealed to assure safety without the need for additional action after being deposited into a GDF, far below earth and away from humans and the environment.

fig3 sweden nuclear waste repository skb
Proposed  final deep geological repository for 12,000 tonnes of spent nuclear fuel in Forsmark, in Sweden

Sample Design of a Geological Disposal Facility

Kareen further discussed on locating a cooperative community and suitable location. She notes that it is necessary because the policy is consent-based and so it is important to select both a suitable site and a community that is open to it. Only having one or the other will not be sufficient.

In England or Wales, the ‘Working with Communities Policy’ outlines the procedure for interacting with potential host communities, including local decision-making to demonstrate willingness (or disinterest) to host a facility.

According to Karen, she and her team are working hard to address concerns about regional consequences, safety, security, transportation, and other challenges, both nationally and locally.

Furthermore, she added that involving locals in selecting what they want for their communities is most important. According to her, “This project is genuinely transformative. Large project of this nature, which will generate local investment, infrastructure, skills, and thousands of employment over the course of more than a century, can be advantageous to communities in the long run.”

Sample design of Geological Disposal facility.
Sample design of GDF ( Credit : Institution of Civil Engineers )

Geological Disposal Facilities: Facts and Figures

  • A GDF will be erected 200 to 1,000 meters below ground.
  • For surface amenities, it will be about 1 km2 large, or 800 Olympic-sized swimming pools.
  • Over 20 km2 will be devoted to subsurface dumping zones.
  • The GDF might build a network of disposal locations and tunnels 300–400 kilometers underground.
  • Additionally, it could have accessways and drifts that extend for miles.
  • The GDF will run for more than a century and generate a large number of employment.

Independent  Regulation

As a conclusion, Karen said “We collaborate closely with independent regulators. The suggested site, the designs for a GDF, and the underlying science will be examined by the Office for Nuclear Regulation and the Environment Agency to ensure safety.  Then the GDF can be constructed.”