8.7 C
New York
Saturday, April 20, 2024
Home Blog Page 12

Post-Tensioned Concrete: Principles and Applications

Post-tensioning is a type of prestressing that involves tensioning the tendons after the concrete has hardened, and predominantly transferring the prestressing force to the concrete through the end anchorages. The strength of concrete members is commonly enhanced by post-tensioning, which is a prestressing technique commonly used by engineers.

In post-tensioned concrete, compressive stresses are introduced into the concrete in prestressed members to lower tensile stresses induced by applied loads, such as the member’s own weight (dead load). Compressive stresses are applied to the concrete by means of prestressing steel, such as strands, bars, or wires.

Typical post-tensioned slab arrangement
Figure 1: Typical post-tensioned slab arrangement

Construction of post-tensioned concrete members

In post-tensioned concrete, the concrete is cast around hollow ducts that are fitted to any desired profile after the formwork is in place. Normally, the steel tendons are in the ducts during the concrete pour, unstressed in them. However, they can also be threaded through the ducts at a later point in time. Tendons are tightened after the concrete reaches the desired strength. Tendons can either be stressed from both ends, or from one end while the other is anchored.

At each stressed end of the concrete element, the tendons are then anchored. After the tendons are anchored, the prestress is maintained by bearing the end anchorage plates onto the concrete, which compresses the concrete during the stressing operation. Every time the cable’s direction changes, the post-tensioned tendons impose a transverse force on the member.

Multi-strand tendon system and anchorage block
Figure 2: Multi-strand tendon system and anchorage block

The tendons’ ducts are frequently filled with grout under pressure once they have been anchored and confirmed that no further stressing is needed. In this way, the tendons are bonded to the concrete and are more efficient in controlling cracks and providing ultimate strength. If a tendon is later lost or damaged, bonded tendons are also less prone to corrode or cause safety issues.

However, there are instances where tendons are not grouted for economic reasons and remain permanently unbonded. The tendons are grease-coated and enclosed in a plastic sleeve in this method of construction.

Unbonded post-tensioned slabs are frequently utilized in North America and Europe, despite the fact that they provide only around 75% of the ultimate strength of a beam or slab that is provided by bonded tendons. Post-tensioning is the most common in in-situ prestressed concrete. Relatively light and portable hydraulic jacks make on-site post-tensioning an attractive option.

Applications of post-tensioning

Prestress is typically applied on-site to a variety of structures using post-tensioning of concrete. Members such as slabs and beams are easily post-tensioned on site. Large-span bridge girders are segmentally built using post-tensioning as well.

When a structure is post-tensioned, there is a great deal of flexibility in how the prestress is delivered since the tendon profiles may be easily changed to match the applied loading and the support circumstances. Stage stressing, which involves applying incremental prestress as needed at various building stages as the external stresses progressively rise, is also well suited to post-tensioning.

Components of post-tensioned systems

The components of post-tensioned systems are prestressing strands, anchorages, corrugated galvanized steel or plastic ducts (including grout vents for bonded tendons), and grout. The ducts are fixed to temporary supports (typically attached to the non-prestressed reinforcement of a beam) at strategic intervals throughout the formwork to create the post-tensioned tendon profile.

The strands are typically supported on bar seats for slabs on the ground. As shown in Figure 3, respectively, the ducts that contain the prestressing tendons may be made of plastic ducting or corrugated steel sheathing in more modern innovations.

Figure 3: Prestressing tendons are made of plastic ducting

In a typical continuous floor slab, a post-tensioning strand is laid out schematically in Figure 4. A continuous beam would likewise be covered by the details. The design loads, as well as the placement and kind of supports, determine the prestressing tendon’s profile. The concrete is given time to cure after casting until it reaches the necessary transfer strength.

Figure 4: Tendon layout and details in a continuous post-tensioned slab.

Depending on the system being used or the requirements of the structural design, an initial prestressing force may be applied when the concrete compressive strength reaches about 10 MPa (to facilitate the removal of forms), and the strands will then be re-stressed up to the initial jacking force when the concrete has reached the required strength at transfer.

The grouting of the ducts following the post-tensioning procedure is a common practice in many regions of the world. At one end of the duct, grout is injected into it under pressure. To make sure that the wet grout completely fills the duct during the grouting operation, grout vents are placed at various points along the duct (as illustrated in Figure 4).

The post-tensioned tendon is essentially bound to the surrounding concrete once the grout has dried and set. The grout has various benefits, including enhanced tendon corrosion protection, increased prestressing steel utilization in bending under ultimate limit state conditions, and—most importantly—prevention of tendon failure owing to localized damage at the anchorage or an unintentional strand cutting.

A hydraulic jack working on the concrete at the stressing anchorage at the member’s one end (commonly referred to as the live end) is used to apply the prestress (Figure 5). Figure 5 shows a hydraulic jack stretching the multi-strands in a duct.

Figure 5: Typical hydraulic jack

An anchor head, accompanying wedges needed to secure the strands, and an anchorage casting or bearing plate make up the live end of a post-tensioning anchorage system (see Figure 2). Although these anchorages exist in a variety of sizes and shapes, their load transmission mechanism generally stays the same. The hydraulic jack pulls the strands sticking out behind the anchorage during the stressing process until the necessary jacking force is attained. Figures 3.6d and e depict typical live-end anchorages for a flat ducted tendon.

Figures 5 and 36 depict the wedges used to clamp the prestressed strands at the live end of a slab tendon prior to post-tensioning. The strands are typically painted prior to post-tensioning to make it easier to evaluate each strand’s elongation following the stressing procedure. The wedges in the anchor head secure the post-tensioned strands after jacking, and the anchor casting or bearing plate transfers the load from the jack to the structure.

Figure 6: Live end anchorage

When just one end of the member needs to be stressed, the non-stressing end is frequently in the form of an internal dead-end anchoring, where the ends of the strands are cast in the concrete (see Figure 7). This is true even if the live anchorage can also be utilized at an exterior non-stressing end.

Despite the fact that there are numerous variations on this anchorage, the basic idea is to use either swaged barrels bearing on a steel plate or extending out the exposed strand bundle to generate local anchor nodules or bulbs at the extremities beyond the duct.

Figure 7: Dead-end anchorage

To stop concrete from entering the duct during construction, it is sealed. Only after the surrounding concrete has acquired the necessary transfer strength is the tendon stressed. Figure 5 illustrates common anchorage systems for use with multi-strand setups. Following the completion of the stressing, the strands are cut off. Tendons within a member can be connected using tendon couplers and intermediate anchorages.

Grouting of the tendons

The durability of the structure depends on a well-designed grout mix and well-grouted tendons. The positioning of the grout vents, which are used to inject grout and release air from the duct at grout outlets, is one of many elements that determine whether a grouting operation is successful.

As the grout is injected into the duct at the tendon end or anchorage point, vents are needed at the high points of the tendon profile to release the air. Air and water can be evacuated from the crest of the duct profile using vents at or close to the high points. The vent at the far end of the duct emits grout, indicating that the duct is entirely filled with grout.
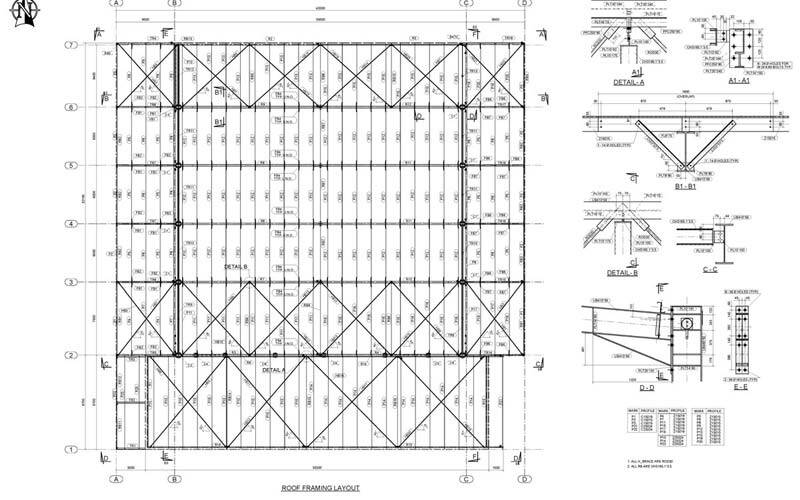
Figure 8: Typical post-tensioned slab

The installation of either temporary or permanent grout caps guarantees that the anchorages are completely filled and enable later grouting verification. Grout vents are frequently seen at the duct’s high points over the internal supports and at the end anchorages (as illustrated in Figure 4). The ducts into which the grout is injected must be big enough to allow for simple strand installation and unhindered grout flow during the grouting process.
Before grouting the duct, an air pressure test is typically conducted to ensure that the risk of grout leaking is reduced. Grouting has a set process and requires skilled labourers to be effective. The grout is continuously and continuously injected into the duct intake.

The vent is not shut off when the grout emerges from it until the emerging grout has the same viscosity and consistency as the grout being pumped into the intake. After confirming that the grout has the necessary consistency and viscosity, intermediate vents along the tendon are closed sequentially.

Types of Tendons used in Concrete Prestressing

Prestressed concrete is a special type of reinforced concrete. Concrete is weak in tension, and tends to crack when subjected to tensile stresses. Prestressing entails applying an initial compressive load to the structure, in order to reduce or eliminate the internal tensile stresses and, consequently, control or eliminate cracking. By acting on the concrete, highly tensioned steel reinforcement (tendons) apply and maintain the initial compressive load. 

A prestressed concrete section is significantly stiffer than an equivalent (often cracked) reinforced concrete section because cracking is minimized or eliminated. Additionally, prestressing may impose internal forces that have the opposite sign from the external loads, which may greatly reduce or even completely eliminate deflection.

The development of prestressing technologies utilized in the production of prestressed concrete has evolved throughout time, mostly as a result of research and development by specialized firms involved in the planning and construction of prestressed concrete structures. These companies regularly operate on related projects including lifting huge structures, cable-stayed bridges, suspension bridges, and soil and rock anchors that call for specialized knowledge and unique equipment, materials, and designs. Each company’s website or direct contact with that company will typically provide information on its items.

The fundamental types of prestressing and the prestressing components are discussed in this article with examples. These include the wire, strand, and bar steel tendons, that are utilized to prestress the concrete.

Types of Prestressing Steel

High-strength steel is typically utilized as tendons in prestressed concrete construction and comes in three basic types which are;

  1. Cold-drawn stress-relieved round wire;
  2. Stress-relieved strand; and
  3. High-strength alloy steel bars.
prestressing strands
Figure 1: Types of strand. (a) 7-wire strand. (b) 19-wire strand – alternative crosssections. (c) Cable consisting of seven 19-wire strands.

Cold-drawn stress-relieved round wire

Generally speaking, a wire, strand, or bar (or any distinct set of wires, strands, or bars) that is meant to be pre- or post-tensioned is referred to as a tendon. Wires are round, cold-drawn, solid steel parts having a diameter typically between 2.5 and 12.5 mm. Hot-rolled medium to high-carbon steel rods are pulled through dies to create wires of the desired diameter to create cold-drawn wires. Steel is cold-worked throughout the drawing process, changing its mechanical characteristics and improving its strength.

The wires are then continuously heated and straightened to relieve stress, increase ductility, and create the desired material qualities (such as low-relaxation). For wires, the normal characteristic tensile strength fpk ranges from 1570 to 1860 MPa. To enhance the bonding properties of wires, these techniques may be used.

Although wire diameters differ from country to country, they are typically between 4 and 8 mm. In prestressed concrete construction, the use of wires has decreased recently, with 7-wire strand being favoured in most situations.

Figure 2: Cables in post-tensioning

Stress-relieved strand

The most popular kind of prestressing steel is stress-relieved strand. There are options for both 7-wire and 19-wire strands. According to Figure 1a, a seven-wire strand is made up of six tightly coiled wires that are centred around a central core wire with a seventh, somewhat larger diameter wire.

The six spirally wound wires have a pitch that ranges from 12 to 18 times the normal strand diameter. The seven-wire strands’ nominal diameters range from 7 to 15.2 mm, and their typical characteristic tensile strengths fall between 1760 and 2060 MPa.

Pretensioned and post-tensioned applications both frequently use seven-wire strands. Two layers of 9 wires, or alternately two layers of 6 and 12 wires, are spirally coiled around a core wire to make a 19-wire strand. The spirally wound wires have a pitch that is 12–22 times the nominal strand diameter.

The usual cross-sections are depicted in Figure 1b, and the nominal diameters of 19-wire strands in common usage range from 17 to 22 mm. While 19-wire strand is used in post-tensioned applications, pretensioned applications, where the transfer of prestress depends on the surface area of the strand available for binding to the concrete, are not advised due to 19-wire strand’s comparatively low surface area to volume ratio.

By drawing the strand through a compacting die, the diameter of the strand can be reduced while keeping the steel’s cross-sectional area constant. Strand compression also makes it easier to grasp the strand at its anchorage. The strand’s mechanical characteristics differ slightly from those of the wire from which it is produced. This is due to the fact that when under tension, stranded wires have a tendency to somewhat straighten, which lowers the apparent elastic modulus. For design reasons, the elastic modulus is Ep = 195 × 103 MPa, and the yield stress of the stress-relieved strand is approximately 0.86fpk.

As seen in Figure 1c, cables are made up of a collection of strands that are frequently braided together from multiple wires. Typically, stay cables are produced straight from strands and are utilized extensively in cable-stayed and suspension bridges.

High-strength alloy steel bars

Hot-rolled high-strength alloy steel bars have alloying components added during the steelmaking process. To strengthen the relationship, some bars have ribs. Bars are single, straight lengths of solid steel that are larger in diameter than wire. They normally have diameters between 20 and 50 mm and typically have a minimum breaking stresses between 1030 and 1230 MPa.

Torsional Rigidity of Square CFST Members

In terms of structural performance and constructability, concrete-filled steel tubular (CFST) members provide a number of advantages over bare steel or reinforced concrete elements. These advantages have led to a wider range of practical applications, such as increased strength and ductility of the core concrete due to the steel tube’s confining effect, increased resistance to local buckling of the steel tube due to the core concrete’s restriction of inward deformations, improved fire resistance of CFST members due to the concrete’s heat sink effect, and improved constructability due to the steel tube acting as formwork during the concrete pouring.

Torsion occurs in structural members as a result of twisting due to an applied torque. CFST beams with curved on-plan surfaces, CFST corner columns of structures that twist under wind or earthquake loads, and I-beams with CFST compression flanges that experience lateral torsional buckling are common instances where such actions might occur in CFST members.

Furthermore, because the stiffness centre and the mass centre of these structures do not lie in the same location, in reality, the piers of curved bridges, skew bridges, and complicated building structures are always exposed to torsion under horizontal earthquake action.

It is well known that the shape of the cross-section affects the confinement effect in CFST members and that square CFST columns typically possess somewhat lower strength and ductility than similar circular CFST columns. Square CFST columns, however, are frequently used for practical reasons, such as more elaborate beam-to-column connections.

cfst sections
Concrete-filled steel tube columns (Zhang et al, 2022)

Numerous researchers have conducted experimental and numerical studies on the behaviour of square CFST members under various loading conditions. These include a number of tests on square CFST beam-columns that were loaded under pure compression to bending. Additionally, experimental tests have been conducted on square CFST beam-columns utilizing high-strength steel sections with yield strengths up to 750 MPa, along with computational calculations.  Interaction formulae for design purposes have been developed on the basis of the findings.

A paper on the torsional rigidity of CFST square columns was recently published in the journal Structures (Elsevier) by researchers from the Department of Civil and Environmental Engineering at Imperial College London in London, the School of Civil and Architecture Engineering at Northeast Petroleum University in Daqing, China, and the School of Civil Engineering & Architecture at Nanjing Institute of Technology in Nanjing, China.

According to the authors, available literature makes it obvious that while there have been several examinations into the structural response of square CFST sections in compression and bending, there has been less research into the torsional performance of square CFST sections.

To address the knowledge gap, the authors used the concept of minimum strain energy to develop an analytical equation for the uniform torsional rigidity of square CFST sections. Since it is generally known that uniform torsional stiffness prevails over non-uniform (warping) torsional rigidity in the case of closed sections, emphasis is made on the uniform torsional rigidity of square CFST sections.

The accuracy of the obtained formula was then evaluated using current theoretical findings, test data, and the finite element simulations carried out in the study. Finally, the significance of the theoretical formulation’s constituent parts is examined, and a simplified design formula was provided.

Torsional deformation of square CFST cross-section (Zhang et al, 2022)

Basic Assumptions in the Determination of Torsional Rigidity

When determining the torsional rigidity of square CFST sections, the following fundamental presumptions are made:

(1) Every point in the cross-section rotates via the angle θ(z) about the centre of twist because the square CFST members’ cross-sections do not deform in-plane when they are twisted. The stiff peripheral assumption of thin-walled bars made by Vlasov is analogous to this one. This assumption allows for the determination of the transverse deformations at any location on the cross-section of square CFST members.

(2) During uniform torsion of the square CFST members, there is no longitudinal slip at the interface between the core concrete and the steel tube, i.e., the longitudinal warping of the steel and concrete are compatible at the interface.

(3) Pure torque is applied to the square CFST component, which results in no restrictions on any variations in the longitudinal warping and does not vary along the length of the member.

The notations used in the study are as follows:
Es, Gs, and μs are the steel cross-modulus sections of elasticity, shear modulus, and Poisson’s ratio, whereas Ec, Gc, and μc are the filled concrete’s modulus of elasticity, shear modulus, and Poisson’s ratio. The section depth and wall thickness of the steel tube are designated by D and t, respectively, while the length of the square CFST member is denoted by L.

Torsional deformation occurs when a member is subjected to a torsional moment (T), where θ(z) is the angle at which the cross-section is twisted. For a member of length L, the angle of twist at the tip, or tip rotation, is given by:

θL = TL/(GJ)k ——— (1)

where (GJ)k is the torsional rigidity of CFST cross-sections, considering the contributions of both the concrete core and the steel tube, to be determined in this study.

Theoretical Formulations

In the study, the strain energy of the concrete core and the steel tube was determined as;

U = ½(GJ)k,SEϕ2L ——– (2)

where (GJ)k,SE is the uniform torsional rigidity derived from the principle of minimum strain energy of a square CFST cross-section, which can be expressed as follows:

(GJ)k,SE = 0.1407D4GcΨ(m, α) ——– (3)

Where;
Ψ is the non-dimensional constant of uniform torsional rigidity of square CFST sections, m = Gs/Gc is the ratio of the shear modulus of steel to that of concrete, α = As/Ac, referred to as the steel ratio, is the ratio of the cross-sectional area of the steel As to the cross-sectional area of the concrete Ac, and can be approximated as α ≈ 4t/D.

When the steel ratio α = 0, the equation (3) reduces to the uniform torsional rigidity of a square section of a single material (pure concrete), i.e.

(GJ)k,SE ≈ 0.1407D4Gc ——– (4)

The exact solution, as given by Timoshenko and Goodier (1970), is:

(GJ)k,TG = 0.1406D4Gc ——– (5)

It can be seen that the difference between the analytical solution and the exact solution is only 0.1%. This shows that the longitudinal displacement mode assumed in the paper is reasonable, and that the principle of minimum strain energy has been suitably applied.

Experimentation Verification

The outcomes of a torsion test performed by prior researchers on a square CFST member were taken into consideration in order to further confirm the accuracy of the derived uniform torsional rigidity. The tested member’s geometrical and material characteristics are shown in the Table below where fy is the steel’s yield strength, fcu and fck are concrete’s cube and cylinder strengths.

PropertyChen (2003)Kitada and Nakai (1991)
Length L (mm)16201590
Depth D (mm)200123.5
Thickness t (mm)4.54.5
fy (MPa)261.4274
fcu (MPa)39.025.6
fck (MPa)26.117.2
Es (GPa)206206
Ec (GPa)32.428.1

The calculated rigidity of the member, as determined from Eq. (3), is also plotted in Fig. 3(a) (with G = E/[2(1 + μ)] and μc = 0.2 for concrete and μs = 0.3 for steel) and can be seen to be in good agreement with the test result in the elastic range (i.e. up to about T = 40 kNm for the case shown). Similarly, good predictions of torsional rigidity (within about 12%) were achieved following comparisons with the experimental results reported in (Kitada and Nakai, 1991), as shown in Fig. 3(b), the key properties of which are provided in Table 1 above.

Comparison between test T-θ curve from (a) [Chen, 2003] and (b) [Kitada and Nakai, 1991] and Eq. (3). (Zhang et al, 2022)

Finite Element Verification

Additionally, the authors used finite element modelling to confirm the derived uniform torsional rigidity found in Eq. (3). Using SOLID65 and SHELL181 elements, respectively, for the core concrete and steel tube and concrete, a series of square CFST members were modelled in ANSYS software. Following a convergence study, an element size of 20 mm in all directions was chosen. To model the contact between the steel and the concrete, the contact elements TAGRE170 and CONTAL173 were employed.

At the tips of the members, a MASS21 mass element with rotational degrees of freedom was introduced to add torque, and all node degrees of freedom were constrained at the fixed ends of the members.

Twelve square CFST members with varying lengths and depths were modelled. Each member was made of a Q235 steel SHS outer tube (Es = 206 GPa and μs = 0.3) and a C40 concrete core (Ec = 32.4 GPa and μc = 0.2). Tip rotations were calculated using two methods:

(1) the FE models, which provided θL,FE; and
(2) Eq. (3), which combined the uniform torsional rigidity (GJ)k provided by Eq. (3) to provide θL,SE (referred to as the “Theory”).

The results, along with the forecasts’ mean and standard deviation, are given in the Table below. The results show that the theoretical tip rotations and the finite element tip rotations correspond quite closely, with the largest absolute difference being less than 0.5%.

Statistical Sensitivity

The uniform torsional stiffness of a square CFST section and the sensitivity of the non-dimensional parameter to variations in the steel ratio and the ratio of the shear modulus of steel to that of concrete were also taken into consideration in the study. For a value of Es = 210 GPa and μs = 0.3, the shear modulus of steel is given by Gs = Es/[2(1 + μs)], which corresponds to a value of Gs ≈ 81 GPa. Depending on the concrete grade, the shear modulus of concrete Gc typically ranges from 12.5 GPa to 15.8 GPa. As a result, m virtually solely affects the grade of concrete, and its value falls between 5.1 and 6.4.

The relationship between Ψ and m for various steel ratios was displayed on a graph, and the following was noted:

(1) As α changes, the trend of the Ψ -m relationship remains similar, indicating that the relationship between Ψ and α is approximately linear
(2) As m increases, Ψ decreases.

The Ψ -α relationship for different values of m showed that:

(1) As m changes, the trend of the Ψ -α relationship also remains similar indicating that the relationship between Ψ and m is approximately linear
(2) As α increases, Ψ also increases.

Overall, it may be concluded that Ψ varies approximately linearly with both α and m, and that the influence of the steel ratio α is more significant.

Simplified Design Formula 

The principle of superposition may be used now that it has been established that the relationships between ψ and both m and α are roughly linear. Consequently, the uniform torsional rigidity of a square CFST section can also be written as:

(GJ)ksup =(GJ)s +(GJ)c

where the first term is the torsional rigidity of a thin-walled square steel tube (GJ)s, and the second term is the torsional rigidity of a solid square concrete core (GJ)c.

The following results were reached after studying the uniform torsional rigidity of square concrete-filled steel tubular (CFST) sections:

  1. It has been established that an analytical formula for determining the uniform torsional rigidity of square CFST sections yields highly precise predictions of the numerical data (within 0.5%). The findings of earlier experiments were accurately predicted as well.
  2. It has been demonstrated that the uniform torsional stiffness varies roughly linearly with both the steel ratio and the ratio of the shear modulus of steel to concrete, with the steel ratio being more significant.
  3. Continuing from (2), the uniform torsional rigidity of square CFST cross-sections has been satisfactorily simplified by the principle of superposition.
  4. By combining the data provided here with those of previous researchers, a very accurate predictive model for the full range elastic-plastic torsion moment-deformation response of CFST members may be created.
  5. The work that has been described can be expanded to examine the uniform torsional rigidity of CFST components with different cross-sectional forms.

Article Credit:

Zhang W. F., Gardner L., Wadee M.A., Chen K.S., Zhao W.Y. (2022): On the uniform torsional rigidity of square concrete-filled steel tubular (CFST) sections. Structures 43 (2022) 249–256. https://doi.org/10.1016/j.istruc.2022.06.046

The contents of the cited original article published by Cement and Concrete Research (Elsevier) is open access, under the CC BY license (http://creativecommons.org/licenses/by/4.0/) which allows you to share and adapt (remix) the article provided the appropriate credit is given, and the link to this license provided.

References

[1] Chen Y.W. (2003): Research on torsion and section behaviour of concrete-filled steel tubular columns. Taiwan Central University, 2003.
[2] Kitada T, Nakai H. (1991): Experimental study on the ultimate strength of concrete-filled square steel short members subjected to compression or torsion. Proceedings of the Third International Conference on Steel Concrete Composite Structures. Fukuoka, Japan, 1991.
[3] Timoshenko SP, Goodier JN. (1970): Theory of Elasticity. 3rd Edition, 1970, McGraw-Hill, New York.
[4] Zhang W. F., Gardner L., Wadee M.A., Chen K.S., Zhao W.Y. (2022): On the uniform torsional rigidity of square concrete-filled steel tubular (CFST) sections. Structures 43 (2022) 249–256. https://doi.org/10.1016/j.istruc.2022.06.046

Design of Steel Columns | EN 1993-1 and BS 5950-1:2000

Structural elements subjected to axial compressive forces are described as either columns or struts. Columns are a fundamental load-carrying element typically oriented in a vertical direction within structures. Struts, on the other hand, represent a more general term encompassing any member experiencing compression. These elements can be found in various configurations, including vertical elements in building frames, the top chords of trusses, or indeed, any location within a three-dimensional space frame.

In structural members subjected to compressive forces (e.g. steel columns and struts), secondary bending caused by imperfections within materials during fabrication processes, inaccurate positioning of loads or asymmetry of the cross-section etc, can induce premature failure either in a part of the cross-section, such as the outstand flange of an I-section, or on the element as a whole. In such cases, the failure mode is predominantly buckling and not squashing.

The design of most steel column members is governed by their overall buckling capacity, i.e. the maximum compressive load which can be carried before failure occurs by excessive deflection in the plane of greatest slenderness.

Compression members (i.e. struts and columns) should be checked for;
(1) resistance to compression
(2) resistance to buckling

The design of steel columns for buckling is well covered in clause 4.7 of BS 5950-1:2000 while the buckling resistance of members is covered in clause 5.5 of EN 1993-1-1:1992 (EC3). The checks for uniform compression in EC3 are found in clause 5.4.4.

In the design of steel columns, the design compressive axial force (NEd) should not exceed the design compression resistance (Nc,Rd) such that;

NEd/Nc,Rd ≤ 1.0
Nc,Rd = (A.fy)/γmo

Where;
A is the gross area of the section
fy is the yield strength of the section
γmo is the material factor of safety.

Similarly, the design axial force should not exceed the buckling resistance of the steel column (Nb,Rd) such that;

Nb,Rd = χAfymo

Where;
χ is the buckling reduction factor
A is the gross area of the section
fy is the yield strength of the section
γmo is the material factor of safety.

Design Process of Steel Columns

Designing a steel column involves a systematic approach that balances strength, stability, and economy. Here’s a breakdown of the key steps:

  1. Load Determination:
    • Identify all characteristic loads acting on the steel column, including dead loads (self-weight of the column, beams, and slabs), live loads (occupancy, furniture), and wind or seismic loads.
    • Apply appropriate load factors as per design codes (e.g., AISC 360 in the US, Eurocode 3 in Europe) to account for uncertainties and safety margins.
    • Define load combinations representing different scenarios (e.g., dead + live, dead + live + wind).
  2. Material Properties:
    • Specify the steel grade for the column, considering its yield strength (fy) and ultimate strength (fu). Common grades include A36, A572, S275, S355, and high-strength steels.
  3. Column Selection (Trial and Error):
    • Assume an initial steel section size (e.g., wide flange section – W shape, universal column UC section – H section, hollow structural section – HSS).
    • Calculate the effective length (Le) of the steel column, which considers the actual length and end conditions (pin-ended, fixed, etc.).
    • Determine the slenderness ratio (λ) by dividing the effective length by the radius of gyration (r) of the chosen column section. The radius of gyration is a geometric property that reflects the distribution of area within the section. Steel design codes provide tables for r values for various sections.
  4. Compression Capacity:
    • Calculate the design load capacity (Nc,Rd) of the steel column for pure compression: Nc,Rd = fy × A
  5. Buckling Capacity:
    • Evaluate the buckling capacity (Nb,Rd) of the steel column using design code provisions. This typically involves a buckling reduction factor (χ) that accounts for the column’s slenderness, type of section, and potential for inelastic buckling. The buckling capacity is generally expressed as: Nb,Rd = χ × fy × A (where A is the cross-sectional area)
    • Design codes provide charts or equations for determining χ based on the slenderness ratio.
  6. Moment Capacity Checks (Optional):
    • For columns subjected to bending moments in addition to axial loads, perform additional checks to ensure adequate flexural strength. This may involve calculating the moment capacity of the section and comparing it with the design moment demands.
  7. Capacity Checks:
    • Compare the factored design loads NEd (from step 1) with the steel column’s capacities (Nc,Rd and Nb,Rd). The design is safe if:
      • For all load combinations: NEd ≤ Nc,Rd
    • If the steel column is slender (high λ), buckling capacity (Nb,Rd) becomes the governing factor:
      • Factored Design NEd ≤ Nb,Rd
  8. Iterative Process:
    • If the initial section fails the capacity checks, select a larger section and repeat steps 3-6. This iterative process continues until a suitable section is found that satisfies all design criteria.

Design Considerations

  • Connection Design: Ensure the steel column connections (welded, bolted) can transfer the forces safely to beams or other elements.
  • Fire Resistance: If the column is part of a fire-resisting structure, consider the impact of fire on its strength and stability. Fireproofing materials may be required.
  • Corrosion Protection: Depending on the environment, the column may require corrosion protection through painting, galvanizing, or other methods.

Tools and Resources

  • Steel design codes (AISC 360, Eurocode 3) provide detailed design procedures and design tables.
  • Structural analysis software can be used to model the structure and determine the loads acting on the columns.
  • Steel manufacturer tables list the properties of various steel sections for selection.

Design Example of Steel Columns

In the downloadable solved example, the capacity of a 4m universal column (UC 305 × 305 × 158) pinned at both ends was investigated for its capacity to carry an axial load of 3556 kN according to the requirements of Eurocode 3 and BS 5950.

READ ALSO ON THIS BLOG…

On the Shear Deformation of One Span Beams Using Virtual Work Method
Example on Analysis of Statically Determinate Frames 

SOLUTION
The first step is to outline the properties of the section we wish to investigate.

Properties of UC 305 × 305 × 158

D = 327.1 mm; B = 311.2 mm; tf = 25mm; tw = 15.8mm; r = 15.2mm; d = 246.7mm, b/tf = 6.22; d/tw = 15.6; Izz = 38800 cm4; Iyy = 12600 cm4; iy-y = 13.9cm; iz-z = 7.9 cm, A = 201 cm2

Universal steel column section

Column Design according to EN 1993-1-1 (Eurocode 3)

Thickness of flange tf = 25mm. Since tf > 16mm, Design yield strength fy = 265 N/mm2 (Table 3.1 EC3)

Section classification
ε = √(235/fy) = √(235/265) = 0.942

We can calculate the outstand of the flange (flange under compression)
C = (b – tw – 2r) / (2 ) = (327.1 – 15.8 -2(15.2)) / (2 ) = 140.45 mm
We can then verify that C/tf = 140.45/25 = 5.618
5.618 < 9ε i.e. 5.618 < 8.478.

Therefore the flange is class 1 plastic

Web (Internal compression)
d/tw = 15.6 < 33ε so that 15.6 < 31.088. Therefore the web is also class 1 plastic

Resistance of the member to uniform compression

Nc,Rd = (A.Fy)/γmo = (201 × 102 × 265) / 1.0 = 5326500 N = 5326.5 kN

NEd/Nc,Rd = 3556/5326.5 = 0.6676 < 1

Therefore section is ok for uniform compression.

Buckling resistance of member (clause 5.5 EN 1993-1-1:1992)

Since the member is pinned at both ends, the critical buckling length is the same for all axis Lcr = 4000mm

Slenderness ratio ¯λ = Lcr/(ri λ1)
λ1 = 93.9ε = 93.9 × 0.942 = 88.454

In the major axis
(¯λy ) = 4000/(139 × 88.454) = 0.3253
In the minor axis
(¯λz ) = 4000/(79 × 88.454) = 0.5724

Check D/b ratio = 327.1/311.2 = 1.0510 < 1.2, and tf < 100 mm (Table 5.5.3 EN 1993-1-1:1992)

Therefore buckling curve b is appropriate for y-y axis, and buckling curve c for z-z axis. The imperfection factor for buckling curve b, α = 0.34 and curve c = 0.49 (Table 5.5.1)

Φ = 0.5 [1 + α(¯λ – 0.2) + ¯λ2]

Φz = 0.5 [1 + 0.49 (0.5724 – 0.2) + 0.57242] = 0.7551
Φy = 0.5 [1 + 0.34 (0.3253 – 0.2) + 0.32532] = 0.5742

X = 1/(Φ+ √(Φ2 -¯λ2))
Xz = 1/( 0.7551 + √(0.75512 – 0.57242)) = 0.8015 < 1 ok
Xy = 1/( 0.5742+ √(0.57242 – 0.32532)) = 0.9548 < 1 ok

In this case, the lesser holds for the calculation of the buckling load.

Therefore Nb,Rd = (Xz A.Fy)/γm1 = (0.8015 × 201 × 102 × 265) / (1.0 ) = 4269189.75 N = 4269.189 kN

NEd/Nb,Rd = 3556/4269.189 = 0.8329 < 1

Therefore section is ok for buckling.

Summarily, the section is ok to resist axial load on it.

Column Design According to BS 5950-1:2000

From Table 9 BS 5950-1:2000
Since the thickness of the flange is > 16mm but < 40mm, Py = 265 N/mm2

Obviously, the column will buckle about the z-z axis, which is the weaker axis in terms of buckling. It is however important to realise that axes are not labelled in the same way using the two codes. The z-z axis in EC3 is the y-y axis in BS 5950, while the y-y axis in EC3 is called the x-x axis in BS 5950.

ε = √(275/fy) = √(275/265) = 1.0186
b/tf = 6.22 < 15ε = 15.28; d/tw = 15.6 < 40ε = 40.74

Hence the UC section is not slender.
Therefore, let us focus on the weaker axis (z-z) in order to verify the buckling load.
Slenderness ratio = λ = Lcr/rz = 4000/79 = 50.633

From Table 23 of BS 5950, for H sections of thickness < 40mm, strut curve c is appropriate for calculating our compressive strength PC (N/mm2). We can go through the stress of calculating the compressive strength PC using the formulas outlined in ANNEX C of BS 5950 or simply read them from Table 24 of the code. We will use the two methods in this example.

Calculating using formula
Limiting slenderness λ0 = 0.2 [(π2E)/Py ]0.5 = 0.2 [(π2 × 210000) / 265]0.5 = 17.6875

Perry factor for flexural buckling under axial load η = [a(λ – λ0)]/1000 where a = 5.5 for strut curve c
η = [5.5(50.633 – 17.6875)] / 1000 = 0.1812
Euler load PE = (π2E)/λ2 = (π2 × 210000) / 50.6332 = 808.447 N/mm2
Φ = [Py + (η+1)PE] / 2 = [265 + (0.1812 + 1) × 808.447] / 2 = 609.9688 N/mm2

Therefore, the compressive strength Pc = (PE Py) / (Φ + (Φ2 – PE Py)0.5)

Pc = (808.447 × 265) / (609.9688 + [609.96882 – (808.447 × 265)]0.5) = 212.699 N/mm2

If we had decided to read from the chart, strut curve C, λ < 110, Py = 265 N/mm2

Knowing that λ = 50.633. Interpolate between λ = 50 and 52 to obtain Pc = 212 N/mm2
So let us use PC = 212.699 N/mm2
Hence Buckling load, PX = AgPc = 201 × 102 × 212.699 = 4275249.9 N = 4275.2499 kN

Therefore, N/PX = 3556/4275.2499 = 0.8317 < 1.0. Hence the section is okay for buckling.

The difference in result between EC2 buckling load (Nb,Rd = 4269.189 kN) and BS 5950 buckling load (PX = 4275.2499 kN) for axially loaded columns disregarding load factor is just about 0.144%.

You can download the paper HERE and compare the results from the two codes.

Like us on Facebook by clicking on www.facebook.com/structville

Water Pressure, Piping, and Flow Nets in Cofferdams

The effect of water pressures on the soils at the formation level can have a negative impact on a cofferdam‘s stability to the point where collapse may happen. Excessively high water pressure in granular soils results in piping, whereas it causes heaving in cohesive or extremely densely packed soils.

When the pressure exerted on the soil grains by the water flowing upward is so great that the effective stress in the soil is close to zero, piping occurs. The soil in this circumstance lacks shear strength and transforms into a state that might be compared to quicksand, making it incapable of supporting any vertical weight. When this occurs, the cofferdam workers are obviously in a highly risky situation, and the soil’s passive resistance to the cofferdam wall will also be significantly reduced.

In extreme circumstances, this may result in the cofferdam failing and the wall losing all support. By constructing a flow net, an engineer may predict the chance of piping for a specific cross section and determine the exit hydraulic gradient. The factor of safety against piping will be revealed by comparing the estimated value to the critical hydraulic gradient; for clean sands, this should typically lie between 1.5 and 2.0.

When designing circular cofferdams and the corners of rectangular constructions, care should be taken because these situations present more of a three-dimensional challenge than a long wall would. Installing the sheet piles at a deeper depth increases the flow path and lowers the hydraulic gradient, enhancing the factor of safety against piping.

Minimum cut-off depth in cofferdams (ArcelorMittal, 2008)
Width of cofferdam (W)Depth of cut-off (D)
2H or more0.4H
H0.5H
0.5H0.7H

If the force of the water pressure acting on a block of material inside the cofferdam exceeds the bulk weight of the block, base heave may happen. This can happen in cohesive or very tightly packed granular material. Using a flow net, it is possible to determine the average water pressure acting on the line drawn between the piles and translate it to an uplift force acting on the soil plug inside the cofferdam in order to determine the likelihood of heave.

The groundwater level can be lowered using well points outside of the cofferdam to lessen the flow of water into the structure. As an alternative, pumping from well sites inside the cofferdam that is at or below pile toe level can minimize flow into the structure. However, it should be kept in mind that when a cofferdam’s stability or convenience of use depends on pumping, the dependability of the pumps is crucial, and backup capacity must be available to handle any problems.

Flow nets in Cofferdams

The construction of flow nets is a helpful tool because it gives the engineer a visual depiction of the soil’s flow regime and the ability to compute the water pressures in a specific situation. The following notes show how a net can be drawn given uniform soil conditions and permeability. The shape and complexity of a flow net depend on the homogeneity and permeability of the soil.

• A scaled cross-section drawing of the problem should be produced.
• A datum level should be marked on the cross-section either at an impermeable boundary or at a suitable level below the cofferdam.
• The flow criteria must be determined.
• External water level.
• Internal water level.
• Centre line of cofferdam (this is the axis of symmetry).
• Lines of flow must be parallel to the cofferdam walls and the impervious datum.

The net is created using flow lines and equipotential lines using the aforementioned guidelines (a standpipe at any point on an equipotential line would register the same height H above the datum level). These are roughly square-shaped and at right angles to one another. Trial and error is a big part of this procedure, but with practice, you’ll be able to construct the flow net reasonably quickly and accurately.

piping prevention in cofferdam using flow net
Typical flow net for a cofferdam (ArcelorMittal, 2008)

In order to determine the pore water pressure ‘u’ at any location (using the example above);

• Determine the probable head ‘H’ at the targeted location (note that the potential head drop is always the same between successive equipotential lines once a square net has been formed)

H = H1 – (H1 – H2) × n/Nd

where;
n = number of equipotential drops to the point being considered
Nd = total number of drops

Hence at point A,
H = H1 – (H1 – H2) × (2/10)

• At any point H = u/γw + z

where;
u = pore water pressure
γw = density of water
z = height of point above datum

As H, γw and z are known, u can be calculated;
u = (H – z) × γw

Flow nets can also be used to estimate the approximate volume of water flowing around the toes of the piles into the cofferdam. The flow volume ‘Q’ m3/s per metre run of wall is given by;

Q = k(H1 – H2) × Nf/Nd

where;
k = coefficient of permeability of the ground (m/s)
H1 – H2 = total head drop (m)
Nf = number of flow channels (in half width of cofferdam)
Nd = number of potential drops

The factor of safety against piping

The “exit hydraulic gradient” right below the formation level inside the cofferdam can be calculated using the flow net. The hydraulic gradient ‘i‘ (which is dimensionless), is the loss of head per unit length in the direction of flow. The exit gradient (ie) in the aforementioned case is represented by;

ie = [(H1 – H2)/Nd] × (2Nf/B)

Where;
B/2Nf is the width of each exit flow net square since B/2 is the half-width of the cofferdam
Nf is the number of flow channels in the half-width of the cofferdam

The critical hydraulic gradient at which piping takes place and the effective soil stress drops to zero for ground with a saturated bulk weight of around 20 kN/m3 is ic = 1.0. The factor of safety against piping is defined as;

FoS = ic/ie, which roughly equals (1.0/ie).

A flow net like the one used as an example is merely a section of a very long cofferdam. The 3-dimensional nature of the flow has the effect of further concentrating the head loss within the soil plug between the sheet pile walls for square or circular cofferdams. The head loss per field on the inside face of the cofferdam should be corrected using the following correction factors:

Circular cofferdams = parallel wall values x 1.3
In the corners of a square cofferdam = parallel wall values x 1.7

For clean sands, the factor of safety against piping (1.0/ie)should be between 1.5 and 2.0

Source: ArcelorMittal (2008): Piling handbook (8th Edition)

Cofferdams: Uses, Types, Design, and Construction

A cofferdam is a structure used to keep soil and/or water out of an area where construction work must be done to a depth below the surface. The effects of water penetration must always be taken into consideration in any calculations, even though the total exclusion of water is frequently unnecessary and occasionally not practicable.

The cofferdam should always be taken into consideration by the designer when constructing a basement. The use of steel sheet piles as the main permanent structural wall can result in significant time and cost savings. The wall can be built to support vertical loads and water tightness can be achieved by using the right sealing technique.

The use of top-down construction should be taken into consideration when controlling ground movement is a particular concern. This will prevent secondary movement from happening when the lateral soil loading is transferred from the temporary supports, as they are removed, to the permanent structure. It will also ensure that movement of the top of the wall is restricted with the introduction of support at ground level prior to the commencement of excavation.

There are two main methods for designing cofferdams. Although single-skin structures are more frequently employed, double-wall or cellular gravity structures may be used for very large or deep excavations and marine works.

Requirements for a Cofferdam

The cofferdam’s design must adhere to the following requirements:

  • The structure must be capable of withstanding all of the different loads applied on it.
  • Pumping must be capable of controlling the amount of water entering the cofferdam.
  • The formation level must be stable and not be prone to uncontrollable heaving, boiling, or piping at any stage of construction.
  • The permanent structure or any other existing structure next to the cofferdam shall not be impacted by the deflection of the cofferdam walls and bracing.
  • It must be demonstrated that overall stability exists in the face of out-of-balance earth forces brought on by sloping terrain or probable slip failure planes.
  • The cofferdam needs to be the right size for the construction work that will be done inside of it.
  • The construction of temporary cofferdams must be done in a way that allows for the greatest possible quantity of construction waste to be recycled.

Planning a Cofferdam

Before starting the design of a cofferdam, the designer must have a clear understanding of their goals. In order for the design to account for all the load situations related to the construction and takedown of the cofferdam, the sequence of construction operations must be established. The designer can find the key design instances from this sequence and then compute the minimal penetrations, bending moments, and shear forces necessary to establish the pile section and length.

The designer should conduct a risk assessment of the effects of any departure from the intended sequence as part of the analysis of the construction activities. These deviations could take the form of excessive excavation at any stage, a failure to reach the required piling penetration, the installation of the support at the incorrect level, or the imposition of a significant surcharge loading from construction equipment or materials.

The site management should be informed and contingency plans should be prepared to minimize any risk if any stage of the cofferdam construction is particularly fragile. This will reduce the likelihood that critical conditions will materialize.

The bulk of cofferdams are built as temporary works, hence it might not be cost-effective to plan for every conceivable loading scenario. When evaluating the design instances, decisions will need to be made, typically including the site management. An example of this may be when evaluating the hydraulic loading on a cofferdam. Flood conditions are typically seasonal, therefore creating a cofferdam that will always keep water out may need a significant increase in pile size, strength, and construction.

The design philosophy may call for evacuating the cofferdam in a severe flood situation and letting it overtop and flood instead. Under these circumstances, the designer must account for overtopping, taking into account the impact of any trapped water on the stability after the flood subsides as well as the effect of the abrupt ingress of water on the base of the cofferdam.

The site area should be cleared before construction begins to make room for the installation of plant and guide frames. Excavation shouldn’t start until all the necessary machinery and supplies, including pumping equipment when needed, are on hand to support the piles.

The cofferdam and support frames should be checked when excavation is finished to make sure they are functioning as planned and to give as early a warning as possible of any safety-critical issues. In the UK, it is required by law to keep a written record of such monitoring, which is good practice.

Below are a few potential causes of failure, and it will be clear that many of them have to do with issues that could develop after the cofferdam is complete.

Common Causes of Cofferdam Failures

  Cofferdam failure may have a variety of causes, but in reality, it is typically caused by one or more of the following:

  • The structure’s installation and design lacked attention to detail.
  • Failing to consider the range of probable water levels and conditions.
  • Failing to compare facts learned during excavation with design calculations.
  • Excessive excavation during any phase of the construction process.
  • The amount and quality of the framework used to support the loads is insufficient.
  • Loads on frame members that were not considered during the design, such as those caused by walkways, materials, pumps, and other structures supported by walings and struts.
  • Accidental damage to structural components that are left unrepaired.
  • Inadequate penetration to prevent heaving or pipework. Failure to take into account how pipes or heave will affect soil pressures.
  • A breakdown in communication between the designers of permanent and temporary works, as well as between designers and site management or site management and workers.

In many circumstances, the occurrence of several of the aforementioned conditions at once might result in failure, even though any one of them might not have been enough to produce the failure on its own.

Design of Cofferdams

The ensuing remarks are especially pertinent to the design and construction of cofferdams. In order to choose the proper geotechnical parameters for the soils in which the cofferdam is to be built, the longevity of the cofferdam construction must be evaluated. Since the cofferdam is a temporary structure, total stress values can often be employed.

However, the designer must determine each clay’s susceptibility to the quick attainment of a drained condition and, if in doubt, should examine the final construction using effective stress parameters. Generally speaking, it is advised to use effective stress strength parameters when designing cofferdams that will be in use for three months or longer. It may be suitable to utilize effective stress criteria for considerably shorter periods of time since the existence of silt laminations or layers inside clays can quickly lead to the attainment of drained conditions.

The types of cofferdams to be discussed in this section are;

  1. single-skin cofferdams
  2. double skin/walled cofferdams
  3. Cellular cofferdams

Single  skin Cofferdams

Sheet piles that are either internally propped or externally anchored are generally used to create single skin cofferdams. Depending on the kind of soil, the piles will need to be driven to a level that will create enough passive resistance even though they are just intended to provide support between frames and below the lowest frame. If there are at least two frames, the wall will still be stable if the cut-off of the piles below the excavation is insufficient to give the required passive support, and the pile beneath the lowest frame can be thought of as a cantilever.

Nevertheless, this will result in significant stresses in the lowest frame and is to be avoided whenever possible. In every situation, the penetration below formation level must be sufficient to prevent water from entering the excavation.

Driving of sheet pile walls

Records should be kept when driving to look for any signs of the piles declutching. To prevent seepage in such a situation, grouting may be required behind the piles. The same restrictions that apply to cantilever retaining walls apply to cantilever pile cofferdams as well, particularly in terms of the retained height that can be achieved. When the cofferdam has very wide plan dimensions but a modest depth, slanted struts or external anchorages are frequently more cost-effective to include. However, it should not be overlooked that space beyond the cofferdam area is needed for the installation of external anchorages, and wayleaves may be needed to place the anchors beneath neighbouring homes.

A system of internal frameworks in the form of steel sections or specialized bracing equipment is often used for a cofferdam with a depth of more than 3 meters. In order to accurately represent the construction process, the design should be carried out in stages. Excavation and dewatering to just below the top frame level would typically be followed by the installation of the first frame. This process would be repeated for each additional frame.

It should be noted that in the case of cofferdams submerged in water, the forces experienced during dewatering and frame installation may be significantly greater than those present in the finished cofferdam. It is recommended to use a specific interlock sealant for cofferdams in water. It is frequently more efficient to install all of the framing underwaters before beginning the dewatering process when a cofferdam is to be utilized exclusively for the purpose of excluding water and the depth of soil to be excavated is merely nominal.

The ideal frame spacing for this construction style is shown below. The spacing causes the second and succeeding frames to be loaded almost equally.

Walls/double skin Cofferdams

Double wall cofferdams are made up of two parallel lines of sheet piles that are joined at one or more levels by a network of steel tie rods and walings. Sand, gravel, or crushed rock are common granular materials used to fill the area between the walls. The outer line of piles serves as the anchorage, and the exposed or inner wall is intended to serve as an anchored retaining wall. For this type of construction, U or Z profile sheet piles are ideal.

The wall should be analyzed as a whole as a gravity structure, and it will typically be observed that the width should not be less than 0.8 of the retained height of water or soil in order to ensure acceptable factors of safety against overturning and sliding. It is advised that the logarithmic spiral approach developed by Jelinek be used to assess the structure’s overall stability.

Transverse bulkheads should be installed to create strong points at the ends and in the middle of the structure to facilitate construction and contain any potential damage. A square or rectangular cell tied in both directions may make up the strong points. Both within and outside of the construction, the water regime is crucial. Weepholes should be installed on the inner side of the building close to the bottom of the exposed piles to allow for unrestricted drainage of the fill material, lowering pressures on the inner wall and preventing the fill’s shear strength from deteriorating over time.

Weepholes are only useful for small constructions, and it’s not always practicable to drain the fill completely. If necessary, wellpoints and pumps give a speedy alternative for drainage. However, any water pressure acting on the piles should always be taken into consideration by the designer. It is crucial to avoid using clay or silt as fill material, and any of this kind that is found within the cofferdam and is above the primary foundation stratum must be removed before the fill is added.

The piles must be driven deep enough into the ground to produce the necessary passive resistance, which is below excavation or dredging level. Under these circumstances, the structure will lean toward the side that was excavated, and the lateral earth forces on the side that was retained may be regarded as active. The penetration of the piling must also be sufficient to control the effects of seepage when cohesionless soils are present at or below the excavation level. The structure’s weight and any additional loading should be compared to the founding stratum’s bearing capacity.

This type of cofferdam is inappropriate since there is rock at the excavation level unless:

• The type of the rock makes it possible to drive sheet piles into it deeply enough.
• Tie rods can be mounted at a low height (probably underwater).
• The piles can be positioned and grouted into a prepared trench in the rock.
• Dowels inserted into rock sockets can be used to pin the pile toes.

Base friction and gravity forces should be enough to prevent overturning and sliding if the piles are driven onto hard rock or to a nominal depth below the dredged level. Depending on the degree of deflection, the lateral earth pressure on the retained side will be somewhere between at rest and active in this situation.

Because of the uneven distribution of vertical stresses within the cofferdam (owing to moment effects), the internal soil pressures operating on the outside walls are likely to be greater than active, hence the design should be based on pressures that are 1.25 times the active values.

Cellular Cofferdams

Self-supporting gravity structures known as cellular cofferdams can be formed into a variety of designs utilizing straight web sheet piles. After being forced together, the piles form closed cells that are filled with cohesionless material. The circular cells are joined together using manufactured junction piles and brief arcs to achieve wall continuity.

They only need a small amount of penetration to be stable, provided the foundation material is solid. Pile penetration will help in the vulnerable period before the fill has been deposited and the cell has become intrinsically stable by assisting in the resistance of any lateral stresses that may arise during construction.

Cofferdams made of cells are used to hold back large amounts of water or later-placed fill. They are frequently used to create quay walls, breakwaters, and dock closure cofferdams. The straight web pile section, in particular the interlocks, has been created to resist the circumferential tension that forms in the cells as a result of the contained fill’s radial pressure while also allowing for enough angular deflection to allow for the formation of cells with a useful diameter.

The steel can be placed in cellular construction such that the maximum tensile resistance is created across the profile because no bending moments are developed in the sheet piles. Because of this, the sections have very limited bending strength and cannot be used to build standard straight sheet pile walls. Tie rods and walings are not necessary.

Dispersive Soils

When the repulsive forces between clay particles in soils are greater than the attractive forces, deflocculation results, causing the particles to resist one another and form colloidal suspensions in the presence of relatively pure water. Such soils are known as dispersive soils. In terms of erosion control, there is a specific threshold velocity below which running water does not erode non-dispersive soil. Only water flowing with a specific amount of erosive energy can separate the individual particles, which otherwise stick to one another.

Contrarily, dispersive soil does not have a threshold velocity because the colloidal clay particles remain suspended even in still water, making these soils extremely prone to erosion and piping. Except for the possibility that soils with less than 10% clay particles may not have enough colloids to sustain dispersive pipes, there are no notable differences between the clay fractions of dispersive and non-dispersive soils. Dispersive soils have a moderate to high clay material concentration.

In comparison to regular soils, dispersive soils have a higher concentration of dissolved salt (up to 12%) in their pore water. Clay particles occur as aggregates and coatings around silt and sand particles in soils with high salt levels, and the soil is flocculated as a result.

When free salts are present in the pore water, the sodium adsorption ratio (SAR) is used to assess the contribution of sodium. Sodium adsorption ratio (SAR) reflects the proportion of sodium ions to the total amount of calcium and magnesium ions in water and is defined as:

SAR = [Na+] / [(Ca2+ + Mg2+)/2]0.5

with units expressed in meq/litre of the saturated extract.

The exchangeable ions in the layers of adsorbed clay particles are correlated with the electrolyte concentration of the pore water. The type of clay minerals present may have an impact on this relationship in addition to the pH value. As a result, it is not always constant. An SAR value greater than 10 was regarded indicative of dispersive soils by Gerber and Harmse (1987), between 6 and 10 was considered moderate, and less than 6 was considered non-dispersive.

Sodium Adsorption Ratio (SAR)Degree of dispersivenenss
< 6Non-dispersive
6-10Moderate
> 10Dispersive soil

The key chemical determinant of dispersive behaviour in soils is the availability of exchangeable sodium. In terms of the exchangeable sodium percentage (ESP), this is stated as follows:

ESP = Exchangeable [(Na)/(Ca + Mg + K + Na)] x 100

where the units are expressed as meq/100 g of dried clay.

Elges (1985) suggested a 10% ESP cutoff point over which soils that have their free salts leached by seepage of reasonably pure water are susceptible to dispersion. ESP values exceeding 15% indicate very dispersive soils (Bell and Maud, 1994). At ESP values of 6% or below, it was discovered that those with low cation exchange values (15 meq/100 g of clay) were absolutely non-dispersive. Similar to this, soils with high cation exchange capacity numbers and a plasticity index higher than 35% swell to the point where dispersion is negligible.

Exchangeable Sodium Percentage (ESP)Classification
< 6Non-sodic
6-10Sodic
10-15Moderately sodic
15-25Strongly sodic
> 25Very strongly sodic

Regrettably, standard soil mechanics testing cannot distinguish between dispersive and non-dispersive soils. No single test can be relied on totally to detect dispersive soils, despite the fact that several specialized tests have been employed to identify them (Bell and Maud, 1994).

Physical and chemical testing can be used to categorize them. The former includes the pinhole test, the modified hydrometer or turbidity ratio test, the dispersion or double hydrometer test, and the crumb test. Craft and Acciardi (1984) discovered that the pinhole and crumb tests occasionally produced contradictory findings from the same soil samples.

Then, Gerber and Harmse (1987) demonstrated that when free salts were present in solution in the pore water, as is frequently the case with sodium-saturated soils, the crumb test, the double hydrometer test, and the pinhole test were unable to identify dispersive soils.

Dispersive Soils in Construction

Dispersive soils have been employed in the construction of earth dams, resulting in serious piping damage to embankments (Bell and Maud, 1994). After a rainstorm, deep gullies caused by severe erosion damage can develop on earthen embankments. Small leaks of muddy-colored water from an earth dam after the reservoir has been initially filled are signs of pipework.

There is a risk that the dam will fall as a result of the rapidly expanding pipes. Dispersive erosion can be brought on by initial seepage through an earth dam in regions with higher soil permeability, particularly in places where compaction may not be as effective, such as near conduits, up against concrete structures, and at the foundation interface; or by desiccation cracks, differential settlement cracks, or cracks brought on by hydraulic fracturing.

There is often no other viable option economically in many locations where dispersive soils are present but to employ these soils to build earth dams. Experience suggests that an earth dam should be sufficiently safe even if it is constructed with dispersive soils provided there is thorough construction control and includes filters.

Sodicity and Dispersive Soils

According to Vacher et al. (2004), dispersive soils, which typically contain more than 6.0% exchangeable sodium, are where tunnel erosion mostly occurs (ESP). In the past, these soils may have been referred to as solodic, solonetz, or solodized – solonetz (Doyle and Habraken, 1993). These soils are known as sodic soils or Sodosols (Isbell, 2002). Sodic or dispersive soil layers may also be present in other soil types, including Vertosols, Kurosols, and Kandosols.

Dispersion is the process by which individual clay platelets split from the aggregate when sodic soil comes into contact with non-saline water. Water molecules are pulled in between the clay platelets, causing the clay to inflate to such an extent that they separate from the aggregates.

Small aggregates appear to “dissolve” into a milky ring or halo when they are placed in a dish of distilled water. The clay platelets that were ejected from the clay aggregate are what make up this milky ring. Dispersed platelets are frequently so tiny that they are perpetually suspended, which explains why dams made of dispersive clays never settle and consistently have a “muddy” or “milky” appearance.

Even while sodic soils tend to scatter, it’s crucial to recognize that not all sodic soils do, and not all dispersive soils are sodic (Sumner, 1993). While organic matter, clay mineralogy, acidity, and high iron content may inhibit sodic soils (ESP > 6%) from dispersing, factors like silt and high magnesium content may encourage non-sodic soils (ESP 6%) to do so (Raine and Loch, 2003; Rengasamy, 2002).

Despite possessing less than 6.0% ESP, degraded kurosols in southern Tasmania are known to be dispersive. In addition, until the salt is leached from the soil profile, usually after subsurface drainage, saline soils that are also sodic do not scatter or behave like sodic soils (Rengasamy and Olsson, 1991).

Sodic soils swell but typically don’t disperse in water that is moderately electrolyte (salty) concentrated or somewhat saline. Clay platelets are not broken. Salts in the soil water lower the osmotic gradient between the clay platelets’ outside and inside, preventing the last stage of swelling that would otherwise lead to dispersion (Nelson, 2000). One of the most crucial defenses against gully erosion and soil erosion that sodic soils have is the maintenance of salts in the soil water.

References

[1] Bell F.G. and Maud R.R. (1994): Dispersive soils: A review from South African Perspective. Quarterly Journal of Engineering Geology and Hydrogeology 27:195-210
[2] Craft D., and Acciardi R. G. (1984): Failure of Pore-Water Analyses for Dispersion, Journal, Geotechnical Engineering Division, ASCE, Vol. 110, No. 4, Apr. 1984.
[3] Doyle R. and Habraken F.M. (1993): The distribution of Sodic Soils in Tasmania. Australian Journal of Soil Research 31 (6), 931-947.
Elges, H. F. W. K. (1985) ‘Dispersive soils: problem soils in South Africa-state of the art’, Civil Engineer in South Africa, 27(7):347-349.
[4] Gerber, F.A. and Harmse, H.J. von M. (1987): Proposed procedure for identification of dispersive soils by chemical testing. The Civil Engineer in South Africa, 29:397-399.
[5] Isbell R.F. (2002): ‘The Australian Soil Classification’. Australian Soil and Land Survey Handbooks Series Volume 4, (CSIRO Publishing: Collingwood, Vic.).
[6] Nelson P.N. (2000): Diagnosis and Management of Sodic Soils Under Sugarcane, BSES Publications.
[7] Raine S. R. and Loch R.J. (2003): What is a sodic soil? Identification and management options for construction sites and disturbed lands. In ‘Road, Structures and Soils in South East Queensland 29-30th’ (Department of Main Roads, Queensland).
[8] Rengasamy P. (2002): Clay dispersion, In Soil Physical Measurement and Interpretation for Land Evaluation, Australian Soil and Land Survey Handbook Series, Vol. 5, Eds McKenzie N., Couglan K, and Creswell H. pp 200-210. CSIRO publishing, Collingwood, Victoria.
[9] Rengasamy P. and Olsson K.A. (1991): Sodicity and soil structure. Australian Journal of Soil Research 29:935-952
[10] Sumner M.E. (1993): Sodic Soils: New perspectives. Australian Journal Soil Research 31:683 – 750.
[11] Vacher C.A., Loch R.J. and Raine S.R. (2004): Identification and Management of Dispersive Mine Spoils. Final Report for Australian Centre for Mining Environmental Research, Kenmore Queensland.


Ground Improvement Using Stone Columns

Stone columns are vertically positioned piles of compacted, gravel-sized stone particles used to enhance the performance of soft or loose soils. The stone can be compacted using impact techniques, such as vibroflots, impact compactors, falling weights, and so on. The technique is used to increase bearing capacity (up to 5 to 10 ksf or 240 to 480 kPa), decrease foundation settlements, improve slope stability, reduce seismic subsidence, reduce lateral spreading and liquefaction potential, allow construction on loose/soft fills, and prevent sinkholes from pre-collapsing in karst regions.

A stone column’s performance is greatly influenced by its diameter. Greater strengths are more likely in larger columns, which is linked to a higher area replacement ratio. The in-situ soft soil is typically partially replaced, resulting in a denser ground that is further improved by adding more fill material.

The moisture content of the nearby base soil also has an impact on the connection between the imported material and the in-situ soil. Since the confinement pressure of the surrounding soil is what generally causes stone columns to function, it is obvious that reduced confinement forces (resulting from wetter soils) will have an effect on the column strength.

Applicable Soil Types

The performance of soils is enhanced by stone columns in two ways: first, by densifying the surrounding granular soil, and second, by reinforcing the soil with a stiffer, higher shear strength column. Table 1 displays the anticipated improvement for various soil types. In most cases, it doesn’t matter how deep the groundwater is.

Soil DescriptionDensificationReinforcement
Gravel and sand <10% silt, no clayExcellentVery good
Sand with between 10 and 20% silt and <2% clayVery goodVery good
Sand with >20% silt and nonplastic siltMarginal (with large displacements)Excellent
ClaysNAExcellent
Table 1: Expected Densification and Reinforcement Achieved with Stone Columns

In general, stone columns can be utilized to enhance the ground when lightweight constructions are built on poor soils. The installation of these columns might be done with the hard stratum in contact or floating above it. Extending it to the hard stratum is preferred. By using this installation method, there is no chance of columns punching through the soil. As a result, differential settlement is greatly reduced. A few test investigations of stone columns that were extended to the hard stratum revealed that the tested columns only bulged in the upper third of the column, thus demonstrating their appropriate load-bearing capability.

Rammed stone columns may be used to support light weights in the following situations, depending on the common local applications requiring improvement of the ground conditions for construction purposes: strip footings, houses (up to two stories), embankment support, storage tanks like oil tanks, and slope stability. Due to the high permeability of crushed aggregates, which promotes faster drainage, the technique would be of utmost importance in soft soils that are heavily saturated.

The procedure of Stone Column Installation

Stone column construction begins at the bottom of the treatment depth and is worked up to the surface. With the help of its weight, vibration, and often water jets in its tip, the vibrator penetrates the ground using the wet top feed technique. The firm soils may also be predrilled through if poor penetration is experienced.

The stone is placed around the vibroflot by a front end loader at the surface of the ground, and it falls to the tip of the vibroflot through the flushing water. The stone then falls around the vibroflot to the tip, filling the void created when the vibroflot is lifted, and the vibrator is then raised a few feet. The stone is subsequently compacted and displaced in lifts of 2 to 3 feet (0.75 to 0.9 m) when the vibroflot is periodically raised and lowered as it is extracted.

Stone column installation
Schematics of Stone column construction

Typically, the flushing water is sent to a settlement pond where it is permitted for the soil fines suspended in the water to settle. When using the dry bottom feed process, the vibroflot only needs its weight and vibrations to help it enter the earth. Predrilling may once more be performed if required or preferred. The subsequent steps are then similar, with the exception that the stone is sent through the tremie pipe to the tip of the vibroflot. It has been possible to treat at depths of up to 100 feet (30 meters).

In general, two mechanical techniques—vibration and ramming—are used to install these columns. Rammed columns are placed by first generating a pre-bored hole which is afterwards filled with a compacted material in many layers as opposed to vibrated columns which employ a vibratory probe to generate an opening for granular fill placement by either the displacement or the replacement method.

Figure 1: Installation of a pre-bored rammed stone column

The difficulty of the installation is what distinguishes the two methods. Vibrated columns are more expensive than rammed columns because they require more advanced equipment and experienced labour. Figure 1 depicts how a typical rammed stone column is installed.

Equipment

The setup and equipment utilized when jetting water is used to advance the vibroflot are similar to VC. For a given project, the dry bottom feed method can be employed if water jetting is not desired. Stone is fed to the vibroflot’s tip through a tremie pipe that is affixed to the side of the vibroflot. A front-end loader fills a stone skip with stone on the ground, and a different cable lowers the skip to a chamber at the top of the tremie pipe.

Vibro piers are an application in particular. Short, tightly spaced stone columns are used in the procedure to form a strong block that will boost bearing capacity and lower settlement to acceptable levels. In cohesive soils where a predrill hole may be dug to its maximum depth and remain open, vibro piers are often built. The stone is rammed and vibroflotted into 1 to 2 foot (0.4 to 0.8 m) lifts before being compacted.

Materials

Although natural gravels and pebbles have been utilized, the stone is often a hard rock that has been graded and crushed. The modulus and shear strength of the column increase with the stone’s friction angle.

Design of Stone Columns

There are numerous analysis techniques available. One technique for static analysis involves generating weighted averages of the soil and stone column parameters (cohesion, friction angle, etc.). The weighted averages are then utilized in conventional geotechnical analysis techniques (bearing capacity, settlement, etc.). The treatment limits and foundation limits are often equivalent in static applications.

Stone columns have several advantages for liquefaction analysis, including densification of nearby granular soils, a decrease in cyclic stress in the soil due to the presence of stronger stone columns, and drainage of the excess pore pressure. In liquefaction applications, the treatment typically extends laterally outside the sections to be protected and covers the whole footprint of the structure, which is equal to two-thirds of the thickness of the liquefiable zone. This is required to prevent the treated region beneath the foundation from being negatively impacted by the nearby untreated soils.

Quality assurance and quality control

Location, depth, ammeter increments, and the quantity of stone backfill utilized are crucial construction factors to track and record. To gauge the improvement made in granular soils, post-treatment penetration tests can be done. With test footings as large as 10 feet square (3.1 meters) and loaded to 150% of the design load, full-scale load testing are increasingly prevalent.

Design of Masonry Walls | EN 1996-1

Durability and strength are the two main types of limit states relevant to the design of masonry structures and masonry walls. The selection of masonry units and mortars for certain construction types and exposure classes is a key component of design for durability. The compressive strength of the masonry fd, is determined by;

fd = fkM

where;
fk is the characteristic compressive strength of masonry
γM is the partial factor for materials.

The following product/material characteristics affect the characteristic compressive strength of masonry:

• Group number of masonry unit
• Normalised mean compressive strength of masonry unit
• Compressive strength of the mortar.

The partial factor for materials is a function of the following aspects:

• Category of (masonry unit) manufacturing control
• Class of execution control.

In Europe, a wide range of masonry units are used. Numerous characteristics of the units vary, including the percentage, size, and orientation of voids or perforations, as well as the thickness of webs and shells. Therefore, the EN 1996-1-1:2004 (EC 6) drafting panel had to come up with strategies that would enable the usage of the vast majority of masonry materials that are currently offered in Europe. Producing European specifications for popular masonry unit types was how the process was really developed:

  • clay
  • calcium silicate
  • aggregate concrete (sandcrete blocks)
  • autoclaved aerated concrete
  • manufactured stone and
  • natural stone.
Natural stone masonry wall

Each of the product properties in these requirements is backed by an appropriate test method using a declaration system. The superior structural use masonry units are put in Group 1, and the remaining masonry units are divided into Groups 2, 3, and 4, according to the product characteristics. Group 1 units typically contain no more than 25% void space. Between 25 and 55% of Group 2 clay and calcium silicate units are voids, while 25 to 60% of Group 2 aggregate concrete units are voided.

Normalised Compressive Strength of Masonry

The compressive strength of masonry units had to be normalised because to variations in unit sizes that are available throughout Europe and in testing methods. The compressive strength is converted to the air-dried compressive strength of an identical 100 mm wide 100 mm high unit of the same material to provide the normalised compressive strength, or fb.

The masonry’s normalised compressive strengths, fb, are given by;

fb = conditioning factor × shape factor × declared mean compressive strength

Compressive Strength of Mortar

Table 1 below lists the masonry mortar mixtures that the UK recommends using to reach the required strength specified in EC 6. Since the selection and designation of masonry mortars in EC 6 and BS 5628 are identical, similar mortars may be specified for a certain application or exposure.

Masonry mortars may be described by their compressive strength, which is indicated as the letter M followed by the compressive strength in N/mm2, for example, M4, or by their mix proportion, for example, 1:1:6, which denotes the cement-lime-sand proportions by volume. The latter, however, has the advantage of producing mortars that are known to be durable and should generally be employed in practise.

Compressive StrengthCement-lime-sand with or without air-entrainmentCement-sand with or without air-entrainmentMasonry cement-sandMasonry cement-sandMortar designation
M121:0 to 1/4:3(i)
M61:1/2:4 to 4.51:3 to 41:2.5 to 3.51:3(ii)
M41:1:5 to 61:5 to 61:4 to 51:3.5 to 4(iii)
M21:2:8 to 91:7 to 81:5.5 to 6.51:4.5(iv)
Table 1: Types of mortars (Table 2 of National Annex to EC 6)

Unit Manufacturing Control

According to the manufacturing control, units produced in compliance with European criteria can also be divided into Category I or Category II. Category I units are those when the manufacturer employs a quality-control programme and there is a less than 5% chance that the units will not achieve the specified compressive strength. Masonry units rated as Category II are not meant to meet the Category I degree of trust. The category of the masonry unit delivered must be declared by the manufacturer.

Class of Execution Control

EC 6 permits up to five classes of execution control, but, like BS 5628, the UK National Annex only uses two classes, namely 1 and 2. The requirements for workmanship in EN 1996: Part 2 (EC 6-2), including adequate supervision and inspection, shall be followed whenever the work is performed, in accordance with Table 1 of the National Annex, and in addition:

(a) The specification, supervision, and control ensure that the construction is compatible with the use of the appropriate safety factors specified in EC 6; 
(b) the mortar complies with BS EN 998-2, if it is manufactured in a factory, or if it is site-mixed, preliminary compressive strength tests conducted on the mortar to be used, in accordance with BS EN 1015-2 and BS EN 1015-11, indicate conformity to the strength requirements specified in EC 6.

Every time the work is completed in accordance with the craftsmanship guidelines in EC 6-2, including the necessary supervision, class 2 execution control should be adopted. According to BS 5628, Class 1 execution control is equivalent to the “special” category of construction control, whereas Class 2 is equivalent to the “regular” category.

Characteristic Compressive Strength of Masonry

The characteristic compressive strength of unreinforced masonry, fk, built with general-purpose mortar can be determined using the following expression

fk = Kfb0.7fm0.3

where;
fm is the compressive strength of general-purpose mortar but not exceeding 20 N/mm2 or 2fb, whichever is the smaller
fb is the normalised compressive strength of the masonry units
K is a constant obtained from the Table below (Table 4 of the UK Annex to EC6).

Masonry UnitGroup Values of K for general-purpose mortar
ClayGroup 1
Group 2
0.50
0.40
Calcium SilicateGroup 1
Group 2
0.50
0.40
Aggregate ConcreteGroup 1
Group 1 (units laid flat)
Group 2
0.55
0.50
0.52
Table 2: Values of K (based on Table 4 of the National Annex to EC 6)

Partial Factor for Materials (γM)

The values of the material property partial factors for the ultimate limit state listed in Table 1 of the National Annex to EC 6 are shown in Table 3. As is evident, they essentially depend on the type of unit, the type of execution control, and the level of stress.

Class of execution control 1Class of execution control 2
When in a state of direct or flexural compression
Unreinforced masonry made with:
units of category I
units of category II


2.3
2.6


2.7
3.0
When in a state of flexural tension
units of category I and II
2.32.7
Table 3: Values of γM for ultimate limit state (based on Table 2.3 of EC 6 and Table 1 of the National Annex to EC 6)

Design of unreinforced masonry walls subjected to vertical loading

Having discussed the basics, the following outlines EC 6 rules for the design of vertically loaded walls as set out in section 6.1. The approach is very similar to that in BS 5628 and principally involves checking that the design value of the vertical load, NEd, is less than or equal to the design value of the vertical resistance of the wall, NRd, i.e.

NEd ≤ NRd

According to clause 6.1.2.1 of EC 6, the design vertical load resistance of a single leaf unreinforced masonry wall per unit length, NRd, is given by;


NRd = Φi,m tfkM

where;
Φi,m is the capacity reduction factor, Φi or Φm, as appropriate
t is the thickness of the wall
fk is the characteristic compressive strength of masonry
γM is the material factor of safety for masonry determined from Table 3.

Effective Height of Masonry Wall

The effective wall height is a function of the actual wall height, h, and end/edge restraints. It can be taken as;

hef = ρnh

ρn is a reduction factor where n = 2, 3 or 4 depending on the number of restrained and stiffened edges. Thus, n = 2 for walls restrained at the top and bottom only, n = 3 for walls restrained top and bottom and stiffened on one vertical edge with the other vertical edge free and n = 4 for walls restrained top.

Worked Example on Masonry wall panel design

In accordance with EN1996-1-1:2005 + A1:2012 incorporating Corrigenda February 2006 and July 2009 and the UK national annex

Masonry panel details
Unreinforced masonry wall without openings
Panel length; L = 3600 mm
Panel height; h = 2700 mm
Panel support conditions: All edges supported                                                                                        

Effective height of masonry walls
Reduction factor; ρ2 = 1.000
ρ4 = ρ2 / (1 + [ρ2 × h/L]2) = 0.640
Effective height of wall – eq 5.2; hef = ρ4 × h = 1728 mm

Single-leaf wall construction details
Wall thickness; t = 150 mm
Effective thickness;   tef = t = 150 mm

Masonry details
Masonry type; Aggregate concrete – Group 2
Compressive strength of masonry; fc = 2.9 N/mm2
Height of unit; hu = 225 mm
Width of unit;  wu = 150 mm
Conditioning factor;  k = 1.0 – Conditioning to the air dry condition in accordance with cl.7.3.2
Shape factor – Table A.1;  dsf = 1.3

Norm. mean compressive strength of masonry;  fb = fc × k × dsf = 3.77 N/mm2

Density of masonry; γ = 18 kN/m3
Mortar type; M2 – General purpose mortar
Compressive strength of masonry mortar; fm = 2 N/mm2
Compressive strength factor – Table NA.4; K = 0.70

Characteristic compressive strength of masonry – eq 3.1 
fk = K × fb0.7 × fm0.3 = 2.182 N/mm2

Characteristic flexural strength of masonry having a plane of failure parallel to the bed joints – Table NA.6
fxk1 = 0.167 N/mm2

Characteristic flexural strength of masonry having a plane of failure perpendicular to the bed joints – Table NA.6
fxk2 = 0.338 N/mm2

Lateral loading details
Characteristic wind load on panel; Wk = 0.700 kN/m2

Vertical loading details
Permanent load on top of wall; Gk = 21 kN/m;
Variable load on top of wall; Qk = 7 kN/m;

Partial factors for material strength
Category of manufacturing control; Category II
Class of execution control; Class 2
Partial factor for masonry in compressive flexure; γMc = 3.00
Partial factor for masonry in tensile flexure; γMt = 2.70
Partial factor for masonry in shear; γMv = 2.50

Slenderness ratio of masonry walls
Allowable slenderness ratio;SRall = 27
Slenderness ratio; SR = hef / tef = 11.5

PASS – Slenderness ratio is less than maximum allowable

Partial safety factors for design loads
Partial safety factor for permanent load; γfG = 1.35
Partial safety factor for variable imposed load; γfQ = 1.5
Partial safety factor for variable wind load;   γfW = 0.75

Reduction factor for slenderness and eccentricity – Section 6.1.2.2

Vertical load at top of wall; Nid = γfGGk + γfQQk = 38.85 kN/m
Moment at top of wall due to vertical load; Mid = γfGGkeG + γfQQkeQ = 0 kNm/m
Initial eccentricity – cl.5.5.1.1; einit = hef / 450 = 3.8 mm
Moment at top of wall due to horizontal load; MEid = 0 kNm/m
Eccentricity at top of wall due to horizontal load; eh = 0 mm

Eccentricity at top of wall – eq.6.5;                                
ei = max(Mid / Nid + eh + einit, 0.05t) = 7.5 mm

Reduction factor at top of wall – eq.6.4;                       
Φi = max(1 – 2ei/t, 0) = 0.9

Vertical load at middle of wall;                                      
Nmd = γfG(Gk + γth/2) + γfQQk = 43.771 kN/m

Moment at middle of wall due to vertical load;           
Mmd = γfGGkeG + γfQQkeQ = 0 kNm/m

Moment at middle of wall due to horizontal load; MEmd = 0.087 kNm/m
Eccentricity at middle of wall due to horizontal load; ehm = MEmd / Nmd = 2 mm
Eccentricity at middle of wall due to loads – eq.6.7; em = Mmd / Nmd + ehm + einit = 5.8 mm
Eccentricity at middle of wall due to creep; ek = 0 mm
Eccentricity at middle of wall – eq.6.6; emk = max(em + ek, 0.05t) = 7.5 mm

From eq.G.2; A1 = 1 – 2 × emk/t = 0.9

Short-term secant modulus of elasticity factor; KE = 1000
Modulus of elasticity – cl.3.7.2; E = KE × fk = 2182 N/mm2
Slenderness – eq.G.4;  λ = (hef / tef) × √(fk / E) = 0.364
From eq.G.3;  u = (λ – 0.063) / (0.73 – 1.17emk/t) = 0.449

Reduction factor at middle of wall – eq.G.1;                
Φm = max(A1 × ee-(u × u)/2, 0) = 0.814

Reduction factor for slenderness and eccentricity;    
Φ = min(Fi, Fm) = 0.814

Verification of unreinforced masonry walls subjected to mainly vertical loading – Section 6.1.2

Design value of the vertical load;                                  
NEd = max(Nid, Nmd) = 43.771 kN/m

Design compressive strength of masonry;                 
fd = fkMc = 0.727 N/mm2

NRd = Φ × t × fd = 88.786 kN/m

PASS – Design vertical resistance exceeds applied design vertical load

Unreinforced masonry walls subjected to lateral loading

Partial safety factors for design loads

Partial safety factor for permanent load; γfG = 1
Partial safety factor for variable imposed load; γfQ = 0
Partial safety factor for variable wind load; γfW = 1.5

Limiting height and length to thickness ratios for walls under the serviceability limit state – Annex F

Length to thickness ratio;  L/t = 24
Limiting height to thickness ratio – Figure F.1; 80
Height to thickness ratio; h/t = 18

PASS – Limiting height to thickness ratio is not exceeded

Design moments of resistance in panels

Self-weight at middle of wall;                                         
Swt = 0.5 × h × t × γ = 3.645 kN/m

Design compressive strength of masonry;                 
fd = fkMc = 0.727 N/mm2

Design vertical compressive stress;                             
sd = min(γfG × (Gk + Swt) / t, 0.15Ffd) = 0.089 N/mm2

Design flexural strength of masonry parallel to bed joints
fxd1 = fxk1Mt = 0.062 N/mm2

Apparent design flexural strength of masonry parallel to bed joints
fxd1,app = fxd1 + σd = 0.151 N/mm2

Design flexural strength of masonry perpendicular to bed joints
fxd2 = fxk2Mt = 0.125 N/mm2

Elastic section modulus of wall;                                    
Z = t2/6 = 3750000 mm3/m

Moment of resistance parallel to bed joints – eq.6.15
MRd1 = fxd1,appZ = 0.564 kNm/m

Moment of resistance perpendicular to bed joints – eq.6.15
MRd2 = fxd2Z = 0.469 kNm/m

Design moment in panels
Orthogonal strength ratio;  m = fxd1,app / fxd2 = 1.20

Using yield line analysis to calculate bending moment coefficient
Bending moment coefficient; α = 0.027
Design moment in wall; MEd = γfW × α × Wk × L2 = 0.367 kNm/m

PASS – Resistance moment exceeds design moment

Summary

 AllowableActualUtilisation 
Slenderness ratio;2711.50.427PASS
Vertical loading on wall;88.786 kN/m43.771 kN/m0.493PASS
Height to thickness ratio;80.00018.0000.225PASS
Design moment to wall;0.469 kNm/m0.367 kNm/m0.782PASS

Digital Twin in the AEC Industry

Is there a better way to show and view a project than by digital twin? For example, suppose you plan to stay true to the design of a project during construction. Is there a better way to achieve this than by digital twin? Perhaps what comes to your mind when you hear “digital twin” is BIM. But, then, you may be surprised to know that digital twin goes beyond BIM.

For instance, BIM focuses on the system and sub-systems that ensure a building is constructed correctly. However, digital twin can be a combination of a building and a computational model to monitor, manage, and optimize the building. Thus, digital twin concentrates on the operation, performance, and functionality of the building, including use patterns, occupant behaviours, and space utilization. Nevertheless, both tools are vital in this age of intelligent building design, operation, maintenance, and management.

This article covers everything about digital twin in the architecture, engineering, and construction (AEC) industry, including the purpose, types, examples, and benefits of digital twin in construction. By reading this article, you will discover why digital twin is an essential tool in the construction industry and built environment and why you should now adopt and invest in digital twin.

Purpose of Digital Twin

At present, digital twin is growing in importance in the AEC industry because it is used to integrate real-time data from an existing asset with its digital representation to provide insights across the asset’s lifecycle. Digital twin is a proven game-changer in the AEC industry because it solves significant asset design, construction, and operation challenges. Adopting digital twins is also the best way to improve asset performance.

When you think of digital twin, virtual creations or exact digital replicas of an asset should come to your mind. For example, digital twin is like the 3D interior renderings of a building, and it is a tool that helps to utilize, manage, and optimize the spaces in the building. Thus, with the digital twin, you can easily make simulations and predictions based on real-world data and conditions to make informed decisions and develop failure-proof working methods.

You may ask where BIM comes in or how digital twin uses BIM. The fact is that BIM remains the most efficient path to creating an accurate, high-value digital twin. Usually, BIM uses the data created during the planning and design of a project. Likewise, digital twin uses this same data and the data created during the construction and operation of the completed project. Thus, this data can also be used to make calculated and informed decisions for future projects.

Types of Digital Twin

Depending on the degree of maturity and digital transformation you desire, the types of digital twin are briefly discussed below.

digital twin

Descriptive twin

3D architectural models and renderings and BIM comprise descriptive twin. Descriptive twin provides data and editable visual and photorealistic representations of a project for scheduling construction processes and actual construction.

Informative twin

When you need to make informed decisions about facility management operation and estimation, you need information twin. Information twin involves using BIM with sensors, simulations, and operations data to draw insights at any given time within an asset’s lifecycle.

Predictive twin

Predictive twin involves using BIM with IoT technologies to track, capture, visualize, and analyze real-time data to identify potential issues during an asset’s lifecycle.

Comprehensive twin

Comprehensive twin involves leveraging BIM and AI for data-based advanced modelling and simulation to carry out prescriptive analysis and make recommendations to aid decision-making in future situations.

Autonomous twin

An autonomous twin is the ideal digital twin. Unlike comprehensive twin, where professionals still make final decisions, autonomous twin goes further to make decisions through AI-driven advanced simulation and 3D visualization algorithms.

Examples of digital twin

A digital twin is several things to the AEC industry, mainly because it is linked to assets, the spaces in assets, and the people who use these assets and spaces. For instance, digital twin is a tool for safety planning, asset management, space optimization, and improving occupant or employee experience. Examples of digital twin in the AEC industry are highlighted below.

Developing new building construction models

There are several designs that architects conceive, but that never come to reality. This happens because architects sometimes need clarification on the practicality of such designs and if these designs meet all stability and safety requirements. To make matters worse, unfortunately, it is almost impossible to test such designs in the real world to see if they will work or not because of the capital, time, and other resources involved. However, a digital twin can solve this challenge.

With a digital twin, architects and other professionals in the AEC industry can test a design idea in reality-based simulations that would use real-world data and involve all the necessary real-world factors. Similarly, they can test such design’s stability, safety, sustainability, and practicality and get accurate feedback as if the design was executed in the real world.

Reduction of construction and operating costs during building renovations

One significant advantage of digital twin is that it makes coordinating teams and construction processes easier. In addition, one can run several sequencing and logistics scenarios in advance. Thus, giving you an idea of what you are to do and how you are to do them during the construction of a project. Also, it is possible to feed back real-world data to the digital twin in cases where situations and events change.

“What if” analysis of safety systems and emergency action plans

With “what if” analysis, you can simulate a scenario to know how a particular asset is performing and will perform under specific conditions. For example, a digital twin can be used to understand how a rail line was designed and constructed, how it functions, and its limitations. Similarly, a digital twin can provide workers with real-time tracking and alerts of work areas. Thus, reducing risks to workers, making construction attractive to people, and increasing overall efficiency and work quality on construction sites.

Productivity and collaboration improvements through space delegation

Important information about an existing asset can be stored, analyzed, and updated throughout the asset’s lifetime. This information becomes helpful in making informed and calculated decisions when embarking on future projects. This information can also assist with de-risking the execution of the project.

Asset performance and sustainability optimization through use monitoring

Professionals can improve the performance and sustainability of an asset from the insights obtained from a digital twin. For example, a digital twin can be used to predict maintenance events that may arise and plan the required maintenance activities. Consequently, unexpected circumstances and maintenance costs will be reduced throughout the asset’s lifetime. Furthermore, a digital twin can detect a fault or abnormality in a building and automatically dispatch a worker to rectify such issues without delay.

Benefits of digital twin

BIM is known to be very analytical. However, digital twin improves the digital capabilities of BIM and makes it easier for asset owners, operators and managers to visualize the real-time status, working conditions, and position of physical assets. Some benefits of digital twin for firms, owners and managers in the AEC industry are discussed below.

Competitive edge
If you own a firm, digital twin can differentiate you from your competitors and put you ahead of them. In addition, with digital twin, firms can prove to their clients that they can provide them value and a broader range of services by leveraging technology to harness and utilize real-time data.

Savings on money
Digital twin allows firms, asset owners, operators and managers to make informed and calculated decisions, thus helping to save cost and extending the value and lifecycle of assets.

Savings on time
Usually, there are conversations between firms and stakeholders before a project kicks off. These conversations and collaborations help to prioritize the use and performance requirements of such projects or assets. Therefore, it becomes easier to plan to achieve the project goals and eliminate time wastage. Similarly, asset owners and operators can seamlessly proceed with operating the asset without having to bother about misplaced operation or maintenance documents.

Streamlined facility management
Digital twin usually offloads most of the burdens of asset management. For instance, a digital twin of an asset can be used to spot the problem areas and provide potential solutions to the problems that technicians can work with.

Conclusion

A digital twin is simply an exact, digital, and dynamic replica of an asset after its design and construction, for example, a building. Thus, the digital twin of the building can change with its use, just like the physical building, because it is responsive to data input. Its use will also change as more data is supplied from sensors, IoT, and AI.

Just like BIM technology has become indispensable to the AEC industry, so is digital twin technology, especially for facility management. However, models and data from BIM are of little or no use to asset owners, operators, and managers once a project is completed. Therefore, a digital twin is vital for asset owners, operators and managers, and professionals in the AEC industry because it provides insights to optimize assets, systems, and workplaces.

References

[1] Deng, M., Menassa, C. C., and Kamat, V. R. (2021). “From BIM to Digital Twins: a Systematic Review of the Evolution of Intelligent Building Representations in the AEC-FM Industry”. ITcon 26, 58–83. Doi:10.36680/j.itcon.2021.005

[2] Autodesk, Inc. (n.d.). Retrieved from https://www.autodesk.com/solutions/digital-twin/architecture-engineering-construction

error: