8.7 C
New York
Friday, April 25, 2025
Home Blog Page 23

Rafters: Functions, Types, Design, and Installation

Rafters are loading bearing structural members that are used in roof construction. They typically run from the ridge board or hip of the roof at a sloping angle to the roof wall plate, columns, or roof beams, depending on the support system adopted for the entire roof structure.

By implication, rafters receive the load from the roof covering/sheeting, accessories, and other services that may be attached to it. They are also important members for resisting upward wind pressure on roofs. Rafters can be constructed using steel or timber. Furthermore, they are constructed in series and laid parallel to each other at usually a constant spacing. The spacing of rafters can be determined from the design requirements, type of roof sheeting to employed, type and spacing of purlins, availability of materials, etc.

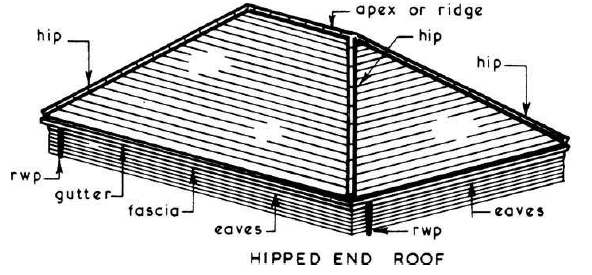
parts of a roof
Figure 1: Typical components of a hipped roof

Under heavy gravity loads, rafters have a tendency to flatten outwards on the walls. This is generally a case of structural failure of rafters, and can lead to the collapse of the walls if the spans are longer and the walls are thinner. To overcome this problem, coupled rafters have been used, which are two opposing rafters joined together by a horizontal tie beam.

However, such roofs were structurally unstable, and since they lacked longitudinal support, they were prone to racking, or horizontal movement-induced collapse. Timber roof trusses were developed later, during the Middle Ages. A cross-braced timber roof truss creates a stable, rigid unit. It should, in theory, balance all lateral forces against one another and only thrust directly downwards on the supporting walls.

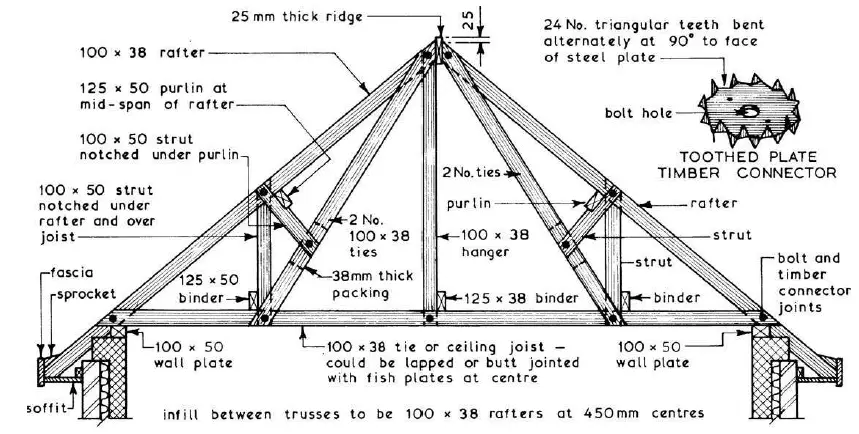
Trussed rafter section
Figure 2: Typical trussed rafter section

Functions of Rafters

The functions of rafters in a roof are as follows;

  1. Serve as a load bearing member for the loads and services on the roof
  2. Safely support the purlins and the roof sheeting/coverings
  3. Provide rigidity and stability to the roof structure
  4. Safely resist imposed loads from wind and snow
  5. Be capable of resisting movements due to moisture or thermal variation
  6. Be durable so as to give satisfactory performance and reduce maintenance to a minimum
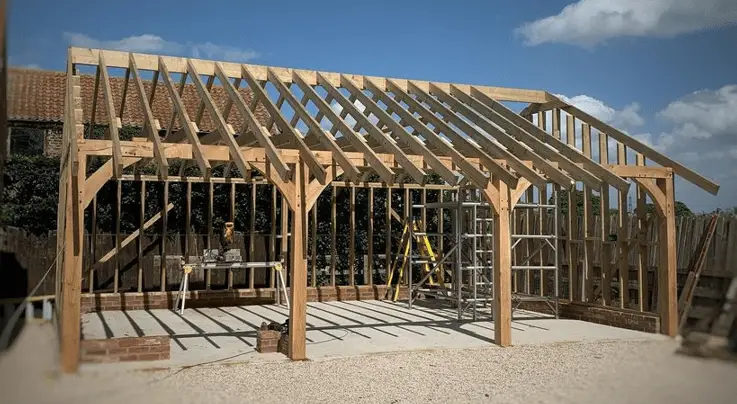
simple rafter construction
Figure 3: Rafter roof framing for a simple structure

Types of Rafters

Rafters are usually constructed using timber or steel. Steel rafters are popular in the construction of portal frames, where they are directly supported by steel columns and stanchions. Timber rafters are more popular in the construction of residential homes, small offices, or other smaller structures.

Steel Rafters

Steel rafters in portal frames are usually subjected to significant bending moment and shear forces from the dead and imposed loads from the roof. In order to increase the rigidity of the rafters, haunches are introduced at the eaves and at the apex. Lateral stability of the rafters are enhanced by purlins or cross-bracings. In some cases steel curved rafters are used in the design of industrial steel structures.

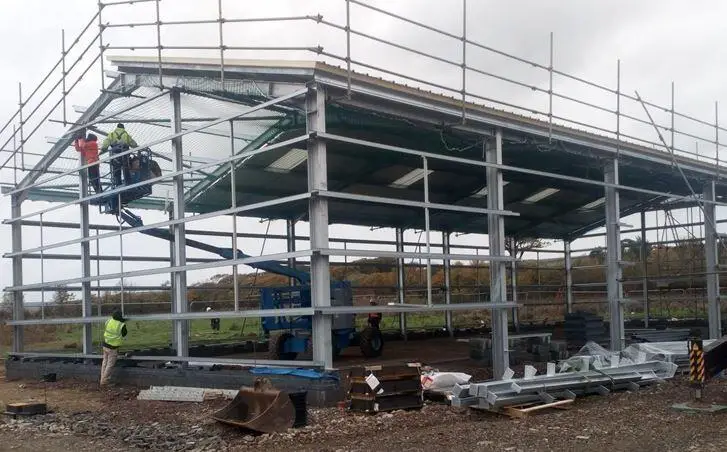
erection of steel structures
Figure 4: Steel portal frame consisting of stanchions and rafters

Timber Rafters

Timber rafters are popular options in timber/wooden roof structures. Rafters are part of a basic wood framing system and are made of wood lumber. The common rafters form the sloped sides of the triangle on a traditional gable roof, which has a triangular shape. Many common, or general purpose, rafters make up each roof. The number of common rafter units needed for each project is mostly determined by the roof’s size and scope, as well as the distance each unit rafter must span. Timber rafters rely on nails or screws for connection.

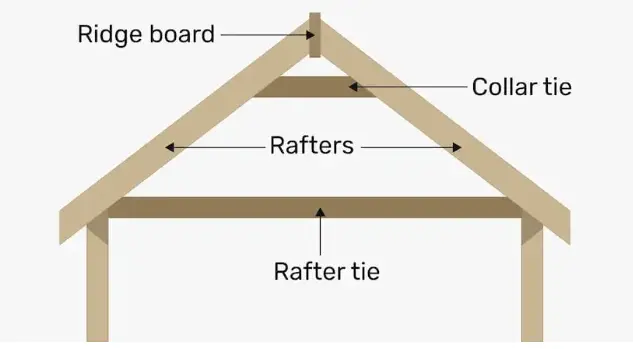
Trussed rafters are generally employed for large scale timber roof construction, but direct timber rafters are more efficient for small scale constructions. Hence, timber rafters are usually constructed in form of A-shape, consisting basically of the rafters, rafter ties, and ridge board/hips.

The rafters and external walls are then connected with ceiling joists. As a result, the area in the roof is left as a vaulted ceiling that may be finished with insulation and drywall. It could also be left as open space in an attic.

timber rafters
Figure 5: Typical components of a roof rafter
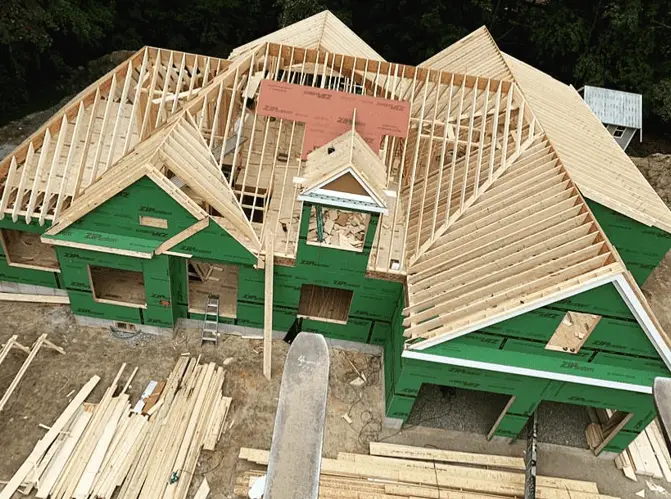
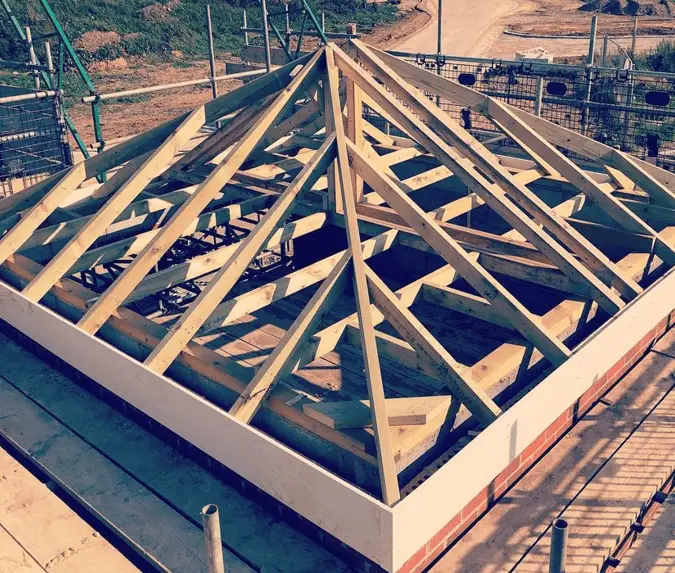
rafter in roof construction
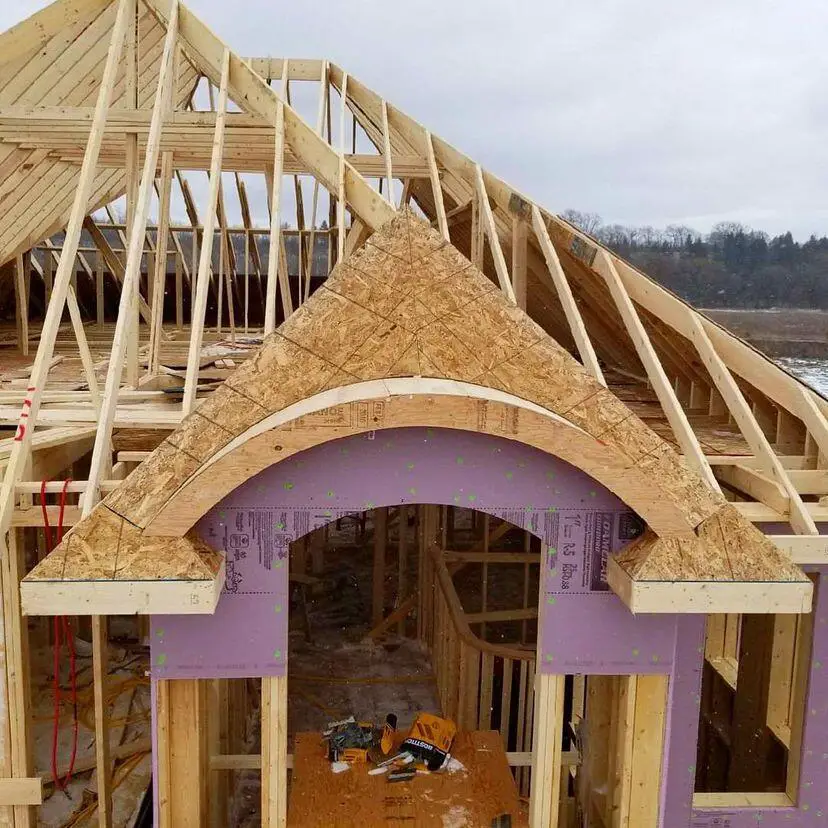
Figure 6: Well constructed roof rafter

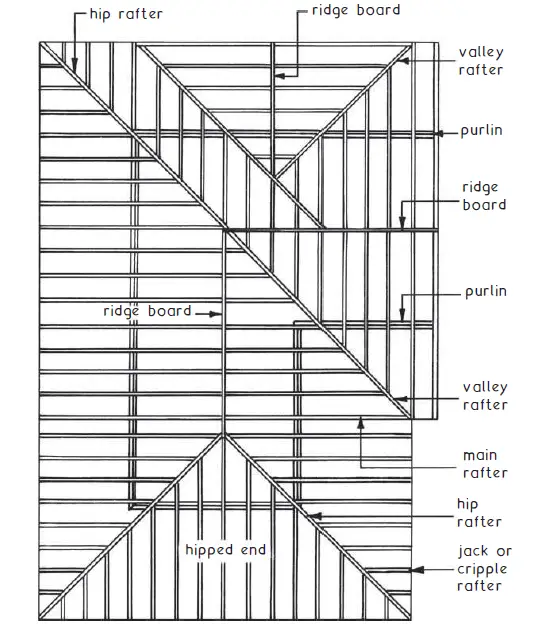
While the most basic gable roof can be built with just one type of timber roof rafter, the most sophisticated roof designs can incorporate different types of timber rafter. The types of timber rafters often employed are;

types of rafters
Figure 7: Plan view of roof framing members

Principal rafter

Principal rafters are the largest form of rafter found at the ends of a roof structure in a timber-framed roof. They are commonly used to carry a purlin and sit directly on a tie beam. Principal rafters run from the roof’s ridge to the wall plate; they’re a little heavier than ordinary rafters, and they’re usually framed into a tie beam at a corner post, story post, or chimney post. The principal rafters, when combined with the principal purlins, constitute a very stable roof construction system.

Common rafter

The basic gable roof is constructed using a common rafter. This style of rafter starts at an outside wall and extends all the way to the roof’s ridge board or peak. The common roof rafter is used to calculate the roof’s height and where the ridge board should be installed. The roof is now ready for the next type of rafter once the ridge board has been installed. Smaller rafters located in between the principals at both ends.

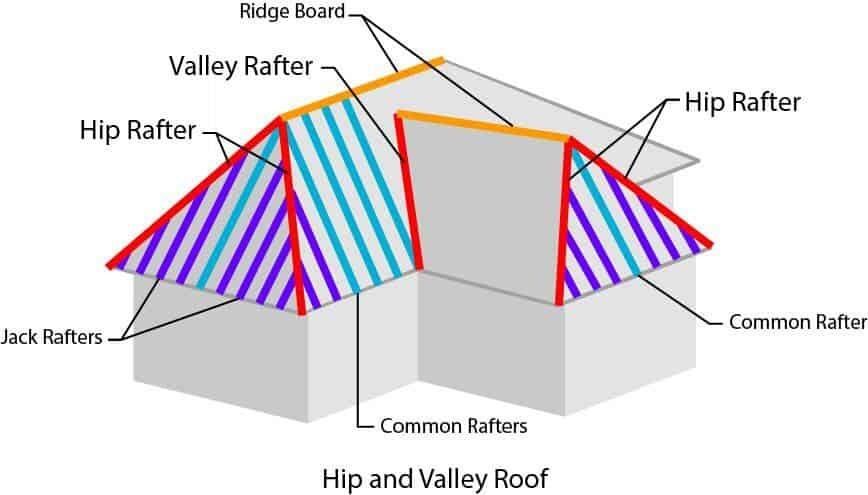
hip valley roof
Figure 8: The components of a hip and valley roof

Hip rafter

These are rafters that runs diagonally between the roof ridge and the top of the wall plate, forming a hipped roof. A hip rafter connects to the ridge at a 45-degree angle, as opposed to ordinary roof rafters, which run perpendicular to the peak of the roof. Traditional stick-framing techniques can be used to make these rafters, or they can be integrated in a pre-engineered steel or timber truss system.

Valley rafter

The valley rafter is the rafter in the valley line that joins the ridge to the wall plate along the meeting line of two sloped sides of a roof that are perpendicular to each other in a roof framing system. To put it another way, it’s the main rafter at the bottom of a hip and valley roof.

Jack rafter

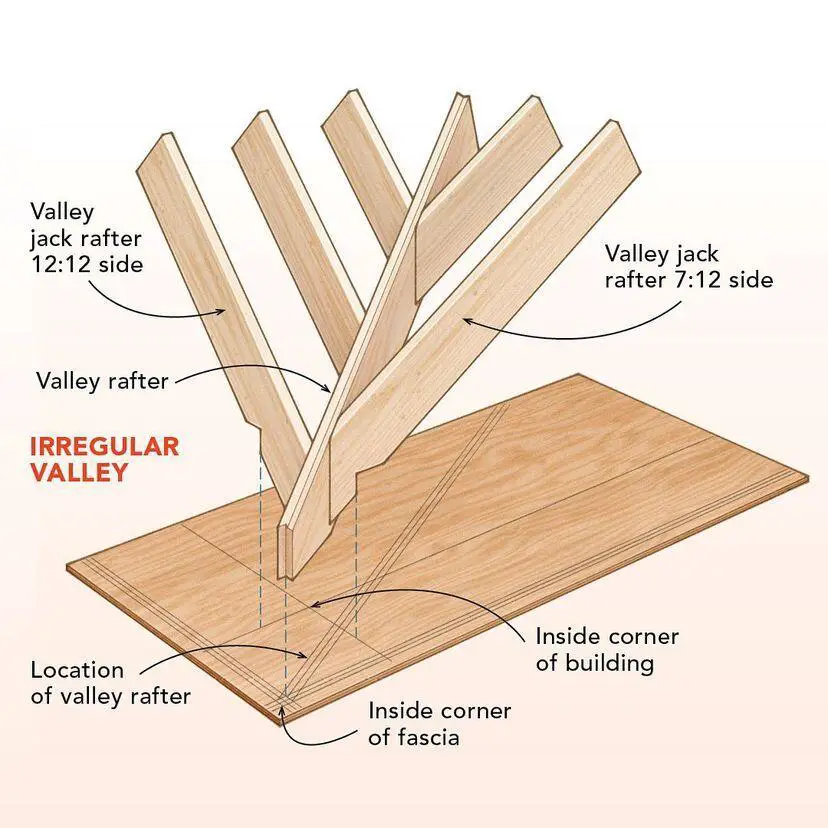
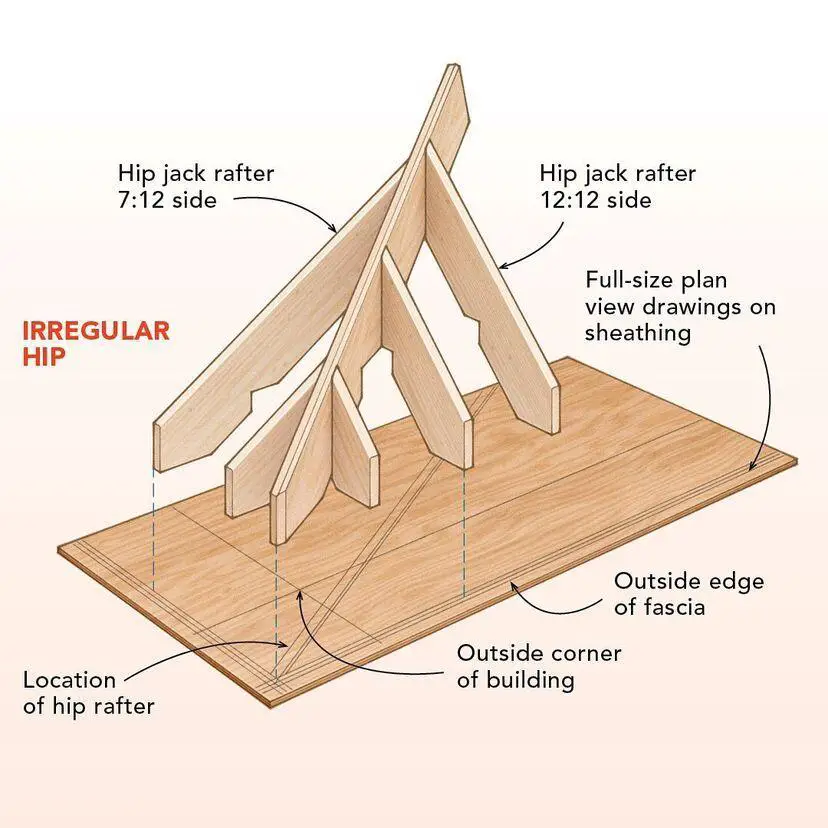
A jack rafter is any rafter that is shorter than the whole length of the sloping roof, such as one that begins or ends at a hip or valley. They extend up from the top of the wall plate at a right angle (90°) to abut into an existing hip rafter. A jack rafter is one that has been shortened by falling on a hip rafter or being interrupted by a dormer window.

95D10DDB DDDD 4719 84D8 F6C9DB66BF5C 1
Figure 9: Valley jack rafter
A88A09CC C761 4A88 8EC0 A8ED6556E56B
Figure 10: Hip jack rafter

Barge rafter

This is the outermost rafter on a gable end and is occasionally utilised to form a roof overhang. It is one of the two rafters that support the portion of a gable roof that extends beyond the gable wall.

Rafter Design and Spacing

Rafters are designed to be structurally stable under gravity and horizontal loads, without undergoing excessive deflection or failure. The design of rafters often involves selecting the appropriate timber class, dimensions, and spacing that will safely support the roof load for a given roof span. In most cases, tables are available for the selection of rafters.

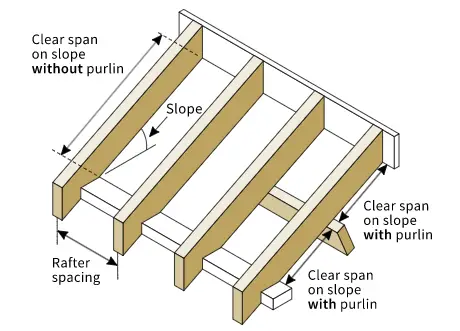
RAFTER DESIGN AND SPACING
Figure 11: Rafter design definitions

Definitions

Rafter span
This is the un-supported length of the rafter along its slope – the diagonal or hypotenuse of a right triangle.

Rafter run
This is the horizontal or level distance covered by the rafter – the bottom chord or base of a right triangle.

Roof span
A roof span is normally the same as the building width between the outer edges of the wall top plates.

Roof slope
Roof slope is the degree of change in height as a ratio of horizontal distance traveled, usually expressed as inches of rise per foot of horizontal run, or cm of rise per m of horizontal run.

Rafter Design Tables

Using regularised UK timber dimensions, it is possible to determine the maximum span of timber rafters subjected to different values of live loads according to BS 5268-7.5.

Table 1: Maximum Clear Span of Rafter when slope is more than 15 degrees but less than 22.5 degrees (Timber class: C16; Imposed load = 0.5 – 0.75 kN/m2)

Rafter Size
Width x Depth (mm)
400 mm spacing 450 mm spacing600 mm spacing
38 × 951.7981.7521.633
38 × 1202.5052.4302.242
38 × 1453.1713.0482.706
38 × 1703.7103.5683.145
38 × 1954.2474.0863.579
44 × 952.0091.9541.816
44 × 1202.7602.6542.410
44 × 1453.3283.2012.907
44 × 1703.8933.7463.379
44 × 1954.4564.2883.845
47 × 952.1092.0501.903
47 × 1202.8212.7132.464
47 × 1453.4013.2722.973
47 × 1703.9783.8283.480
47 × 1954.5534.3823.970

Table 2: Maximum Clear Span of Rafter (Timber class: C16; Imposed load = 0.75 – 1.00 kN/m2)

 Rafter Size
Width x Depth (mm)
 400 mm spacing  450 mm spacing  600 mm spacing
38 × 951.6821.6331.509
38 × 1202.3192.2422.053
38 × 1452.9692.8622.503
38 × 1703.5223.3542.909
38 × 1954.0333.8163.312
44 × 951.8731.8161.674
44 × 1202.5652.4772.251
44 × 1453.1603.0382.692
44 × 1703.6983.5563.129
44 × 1954.2344.0723.561
47 × 951.9641.9031.753
47 × 1202.6782.5752.325
47 × 1453.2303.1062.782
47 × 1703.7793.6353.233
47 × 1954.3264.1623.679

Table 3: Maximum Clear Span of Rafter when slope is more than 22.5 degrees but less than 30 degrees (Timber class: C24; Imposed load = 0.5 – 0.75 kN/m2)

 Rafter Size
Width x Depth (mm)
  400 mm spacing  450 mm spacing  600 mm spacing
38 × 952.2852.1971.993
38 × 1202.8802.7692.514
38 × 1453.4723.3393.034
38 × 1704.0623.9083.551
38 × 1954.6494.4734.068
44 × 952.3992.3072.095
44 × 1203.0222.9072.642
44 × 1453.6433.5053.186
44 × 1704.2604.1003.729
44 × 1954.8744.6924.270
47 × 952.4522.3582.142
47 × 1203.0892.9712.701
47 × 1453.7223.5823.257
47 × 1704.3524.1893.812
47 × 1954.9784.7944.364

Table 4: Maximum Clear Span of Rafter when slope is more than 22.5 degrees but less than 30 degrees (Timber class: C24; Imposed load = 0.75 – 1.0 kN/m2)

 Rafter Size
Width x Depth (mm)
 400 mm spacing  450 mm spacing   600 mm spacing
38 × 952.1662.0821.888
38 × 1202.7312.6252.382
38 × 1453.2933.1672.874
38 × 1703.8543.7063.366
38 × 1954.4124.2443.856
 
44 × 952.2752.1871.985
44 × 1202.8672.7572.503
44 × 1453.4573.3253.020
44 × 1704.0443.8913.536
44 × 1954.6294.4544.050
 
47 × 952.3252.2362.029
47 × 1202.9302.8182.560
47 × 1453.5333.3983.088
47 × 1704.1323.9763.615
47 × 1954.7294.5514.140

Assumptions in the Preparation of the Table

  1. The allowed clear spans were computed using the BS 5268-2:2002 standard and BS 5268-7.5:1990 Structural Use of Timber – Part 2: Code of Practice for Permissible Stress Design, Materials, and Workmanship Section 7.5 Domestic rafters (explains how to use wood for structural purposes).
  2. The self weight of the rafters is not included in the dead loads given at the top of the span table above; however, the rafter self weights are included (in addition to the dead loads) in the calculations used to calculate permissible clear spans.
  3. Roofs with trussed rafter roofs are not covered by these span tables.
  4. Only roof systems with four or more rafters are covered by these span tables. Ceiling joists are also expected to be employed to transmit the horizontal component of eaves-level push to adjacent rafters.
  5. The tile battens affixed to the tops of the rafters are assumed to provide enough lateral restraint and distribute lateral stresses in these span tables.
  6. The calculations used to create these span tables presume that the rafters are not continuous over the purlins, but that they can be continuous over the supporting purlin if necessary.
  7. Holes and notches in the rafters can only be drilled or cut if they are proven to be adequate by specialised calculations.
  8. These span tables do not apply to wood that has been completely exposed to the outdoors.
  9. Wane is allowed in all parts covered in these span tables, as approved by BS 4978:2007+A2:2017.
  10. Rafters must have a 35mm minimum end bearing.
  11. The imposed load should be calculated in accordance with BS 6399:Part 3:1988 Code of practise for imposed roof loads; as a rule of thumb, for altitudes not exceeding 100m, a uniformly distributed load of 0.75 kN/m2 can be used, and for most other areas exceeding 100m but not exceeding 200m, a uniformly distributed load of 1 kN/m2 can be used.
  12. Because there are no brittle finishes on the underside of the rafters, such as plasterboard, the effects of deflection under concentrated (point) load are not need to be considered as per BS 5268-7.5 clause 4.3.
7C48223C 6FCB 4B13 8B17 E942B9184070
Figure 12: Typical timber roof construction and framing

Installation of Rafters

The following steps may be followed in the installation of rafters;

  1. Nail a 2-by-4 board up the centre of the gable-end wall to serve as a ridge board bracing. The board should be taller than the total height of the wall and roof rise.
  2. Place your ridge beam or rafter ties perpendicular to your rafter pattern across the walls.
  3. With the ridge ends facing up, lean your rafters along the outside walls. You’ll have easy access to them up on the roof as a result of this.
  4. Bring your gable-end rafters up to the rafter ties and put one nail through them. Ensure that the heel cut is flush with the wall plate.
  5. Lean the rafters that have been fastened in against each other. Nothing is holding them up, so your assistant will have to hold them in place.
  6. As with the gable-end rafters, go to the opposite end of the ridge board and nail two opposing rafters to their respective rafter ties and lean them against each other.
  7. Raise one end of the ridge board to the intersection of the two rafters.
  8. Attach the rafters to the ridge board using nails.
  9. Slip the ridge beam between the two rafters at the first rafter course and nail it in place.
  10. These two common rafters have enough support at this time to stand up on their own. Nail the remaining rafters to the ridge board, making sure they’re evenly spaced.
  11. Install collar ties, purlins, sway braces, and other supports as needed or required by code once the rafters are securely connected.

See how this Cantilever Design Problem was Solved

I came across an Instagram post on the design of reinforced concrete cantilever beams that forms part of a modern residential dwelling. According to the author of the post, the cantilever beam is about 5 m long.

Cantilevers are beams that are rigidly fixed at one end, and freely supported at the other end. By implication, they are very susceptible to excessive deflection and vibration.

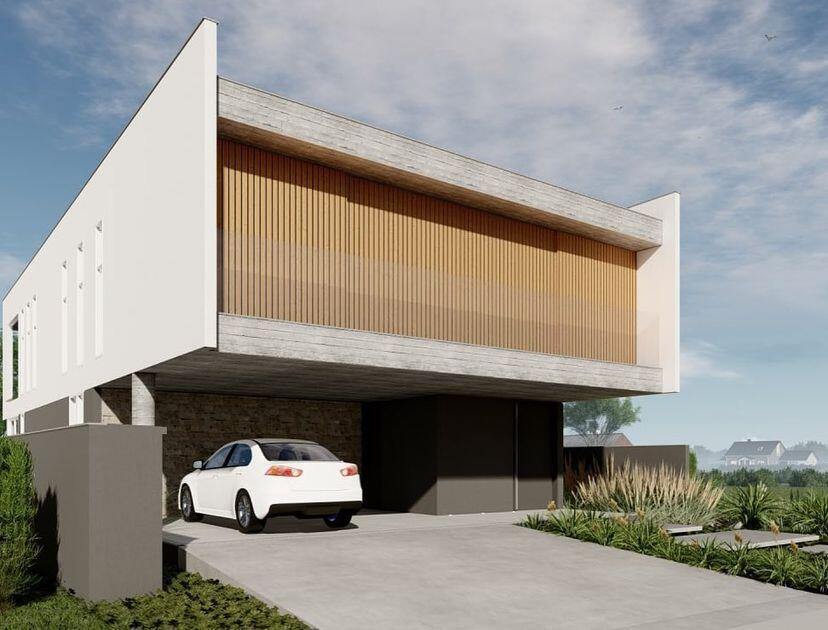
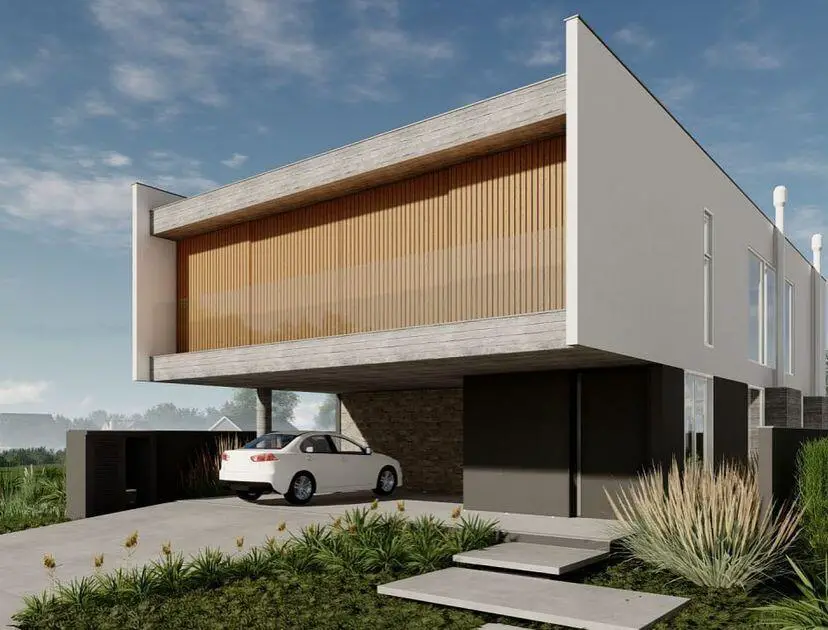
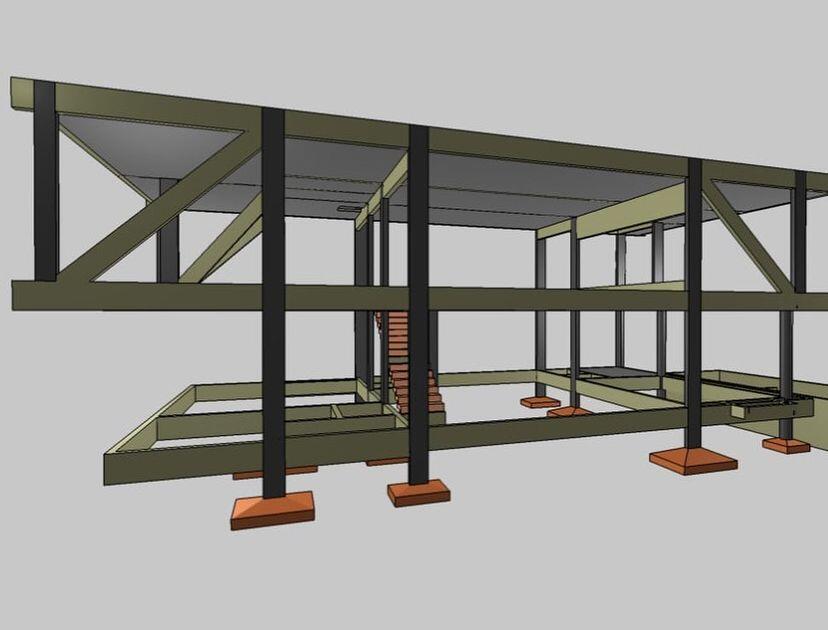
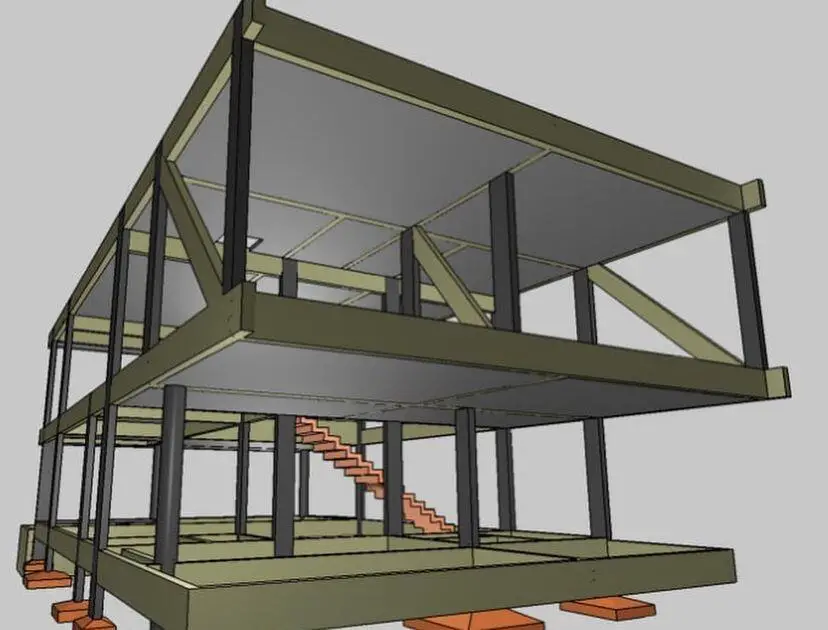
The architectural rendering of the structure in question is shown in Figures 1 and 2.

8353324C 3AC7 494C B089 5E8CFE3FB397
Figure 1: A 3D render of the proposed building
A7FCD682 45D3 4A86 B90E 0E4A8777A012
Figure 2: Another 3D render of the proposed building

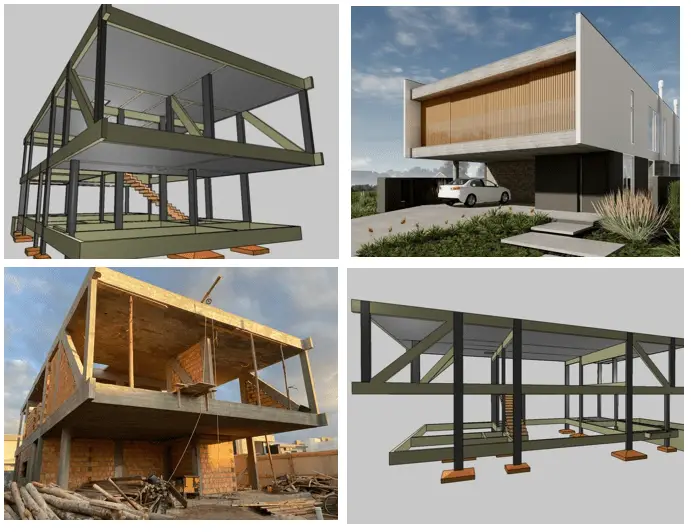
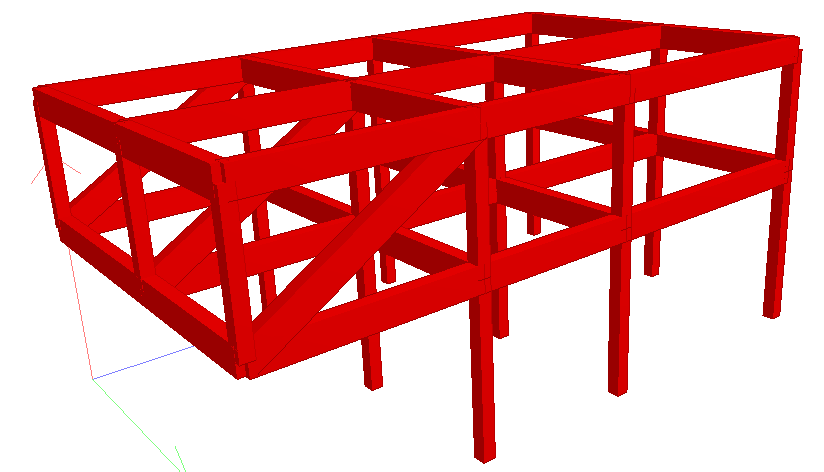
As can be seen from the images above, the architectural rendering depicts a contemporary building with a cantilever projection at the front. To solve the problem, the design engineer, decided to introduce a diagonal/slanted reinforced concrete column, which would act as tension members to support the cantilever beam. The structural modelling of the scheme adopted by the structural engineer is shown in Figures 3 to 5.

C078FC29 9017 451C 9A61 B7FF35FC93FE
Figure 3: Structural scheme of the building
779918AB 8667 47CC BF4D E411730D1885
Figure 4: Typical analytical model of the building on a design software
1B402596 2B89 42FB AB5A 5A60F09ACE12
Figure 5: Another view of the structural scheme

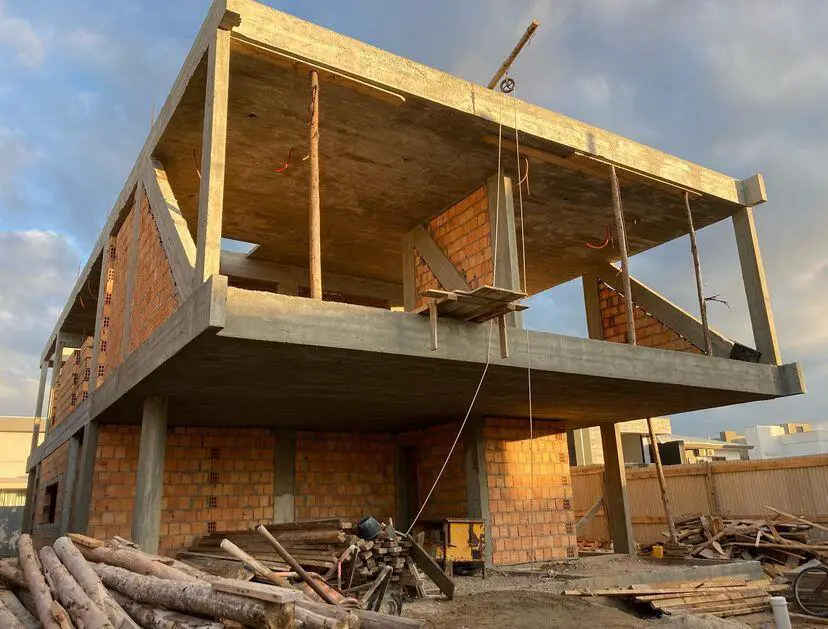
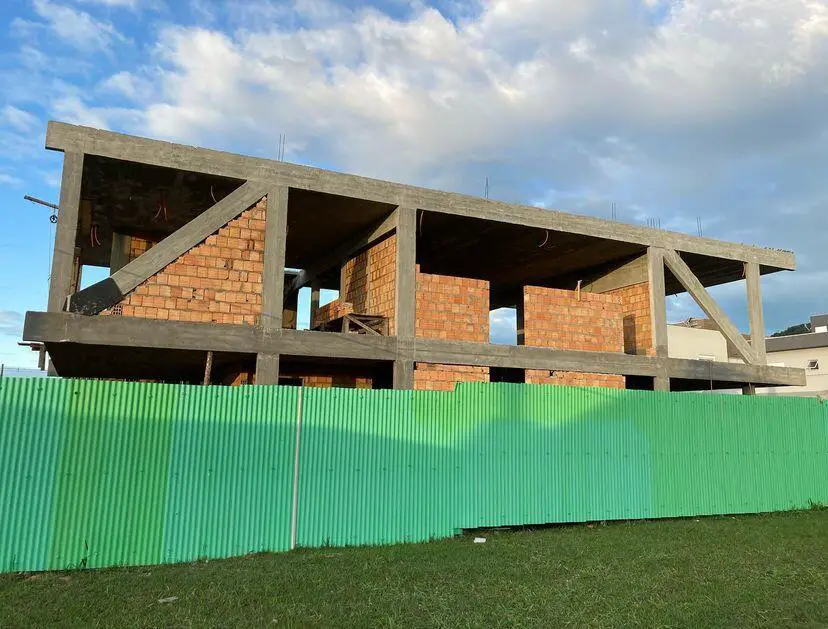
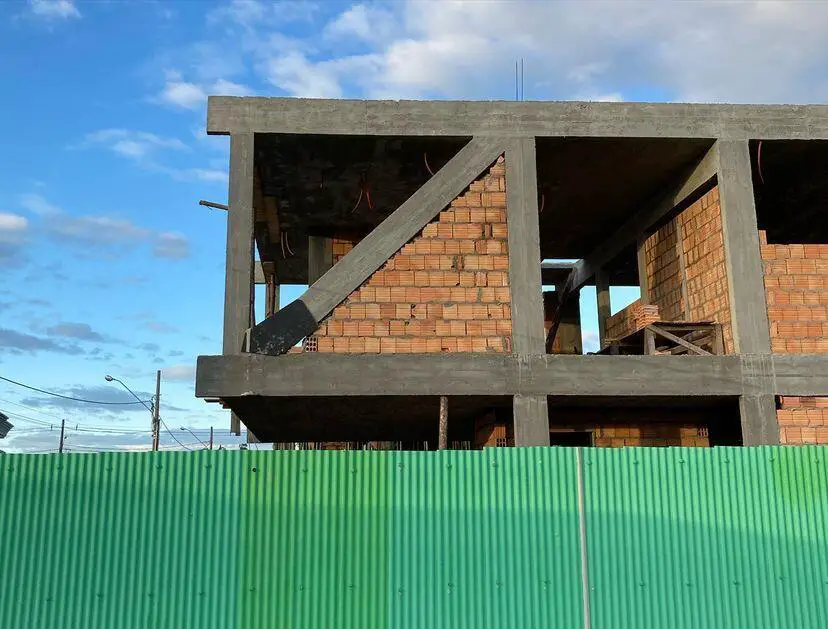
By all indications, the design has been completed and the contractor has gone to the site. The construction images of the models are shown in Figures 5 – 7.

4C788259 EFE3 473F BD71 68935A037E1F
Figure 5: Picture of the building under construction
08AB2F28 A33F 4CD7 87D4 C0721BAD55D8
Figure 6: Another picture of the building under construction
A73B1FB0 1CA7 4901 9365 EAF1E132C553
Figure 7: Another picture of the building under construction

As can be seen in Figure 7, the reinforced concrete diagonal columns were cast monolithically with the frame of the structure. Then bricks were used to cover the openings to create a plain wall that matches the architectural requirements.
Why did the Model Succeed?

The model adopted by the structural engineer succeeded because there are full walls without openings where the inclined columns can be hidden without any implications. Because there are no openings (doors, windows, or curtain walling) on the first bay of the first floor, the inclined columns can be introduced without affecting the architectural concept of the building.

If there had been need for openings in those walls, the adopted structural scheme would not have been an ideal solution. Therefore the ingenuity of the design engineer is appreciated.

How Efficient is the Model?

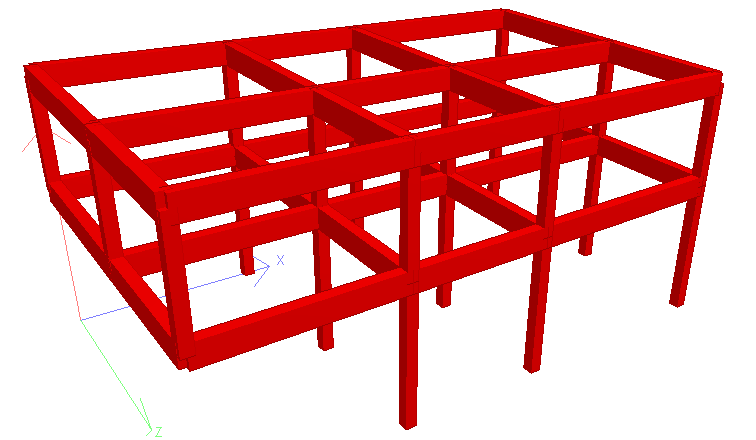
To check the structural efficiency of the model, let us carry out a comparative assessment of a cantilever beam with and without diagonal columns on Staad Pro software. The 3D rendering of the model without diagonal columns is shown in Figure 8.

3d model of the comparison
Figure 8: 3D rendering of the test model without diagonal columns

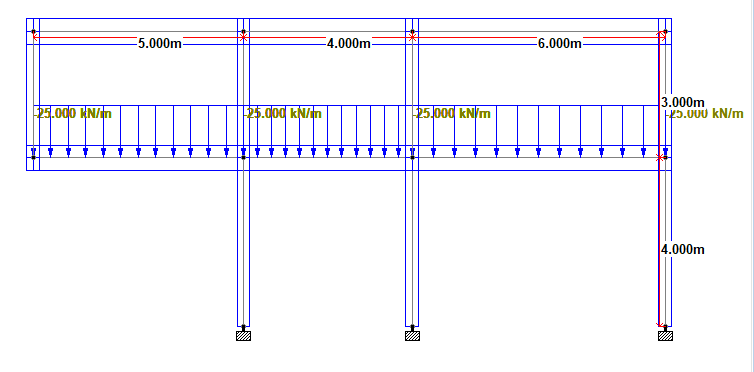
For simplicity, all the first floor beams were loaded with a uniformly distributed load of 25 kN/m as shown below. Furthermore, a uniformly distributed load of 10 kN/m was applied to the roof beams.

Loading on the model
Figure 9: Typical loading and dimensions of the model

The analysis comparison is going to check the effect of introducing a diagonal column on the deflection, bending, and shear force on the structure.

Introduction of diagonal
Figure 10: 3D rendering of the test model with diagonal columns

Analysis Results: Without diagonal column

deflection 1
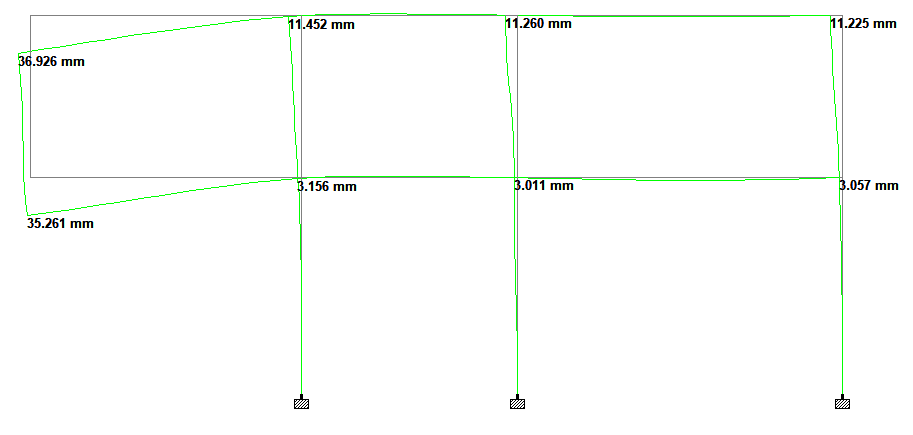
Figure 11: Deflection profile of the structure (without diagonal columns)

As can be seen above, without the presence of the diagonal columns, the maximum deflection at the free end of the cantilever was 35.261 mm.

bending moment 1
Figure 12: Bending moment diagram of the structure (without diagonal columns)

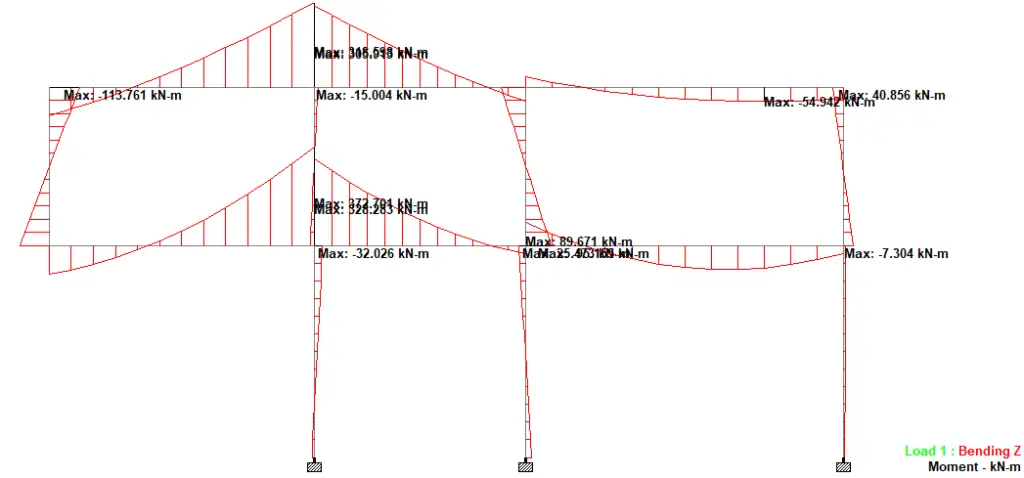
Without the presence of the diagonal column, the maximum cantilever moment was 372.701 kNm. However, the column sitting on top of the cantilever beam appeared to be tension, assisting in supporting the cantilever beams and sending the load to the roof beams.

shear 1
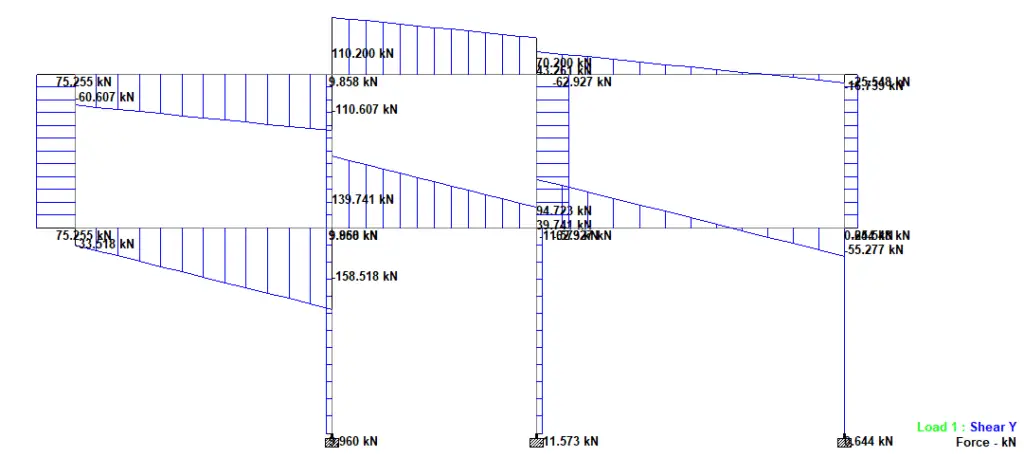
Figure 13: Shear force diagram of the structure (without diagonal columns)

A maximum shear force value of 158.518 kN was observed at the fixed end of the cantilever without diagonal columns.

Axial 1
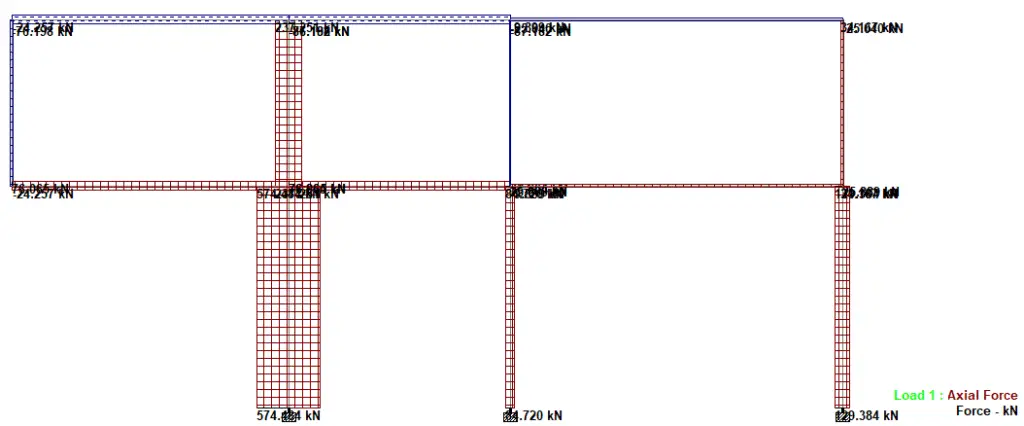
Figure 14: Axial force diagram of the structure (without diagonal columns)

The axial force diagram confirms that the column sitting on top of the cantilever beam is in axial tension, as well as the roof beams.

Analysis Result: With Diagonal column

deflection 2
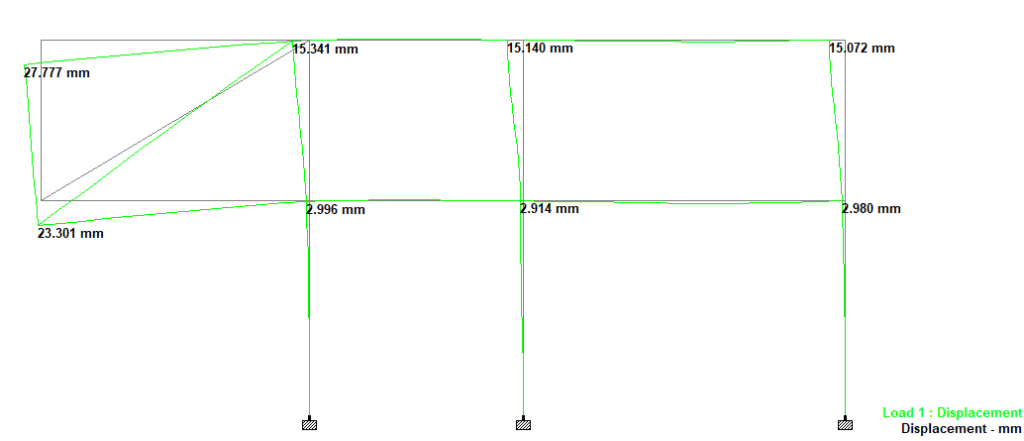
Figure 15: Deflection profile of the structure (with diagonal columns)

As can be seen in Figure 15, when diagonal columns were introduced, the maximum deflection at the free end of the cantilever reduced to 23.301 mm.

BMD 2
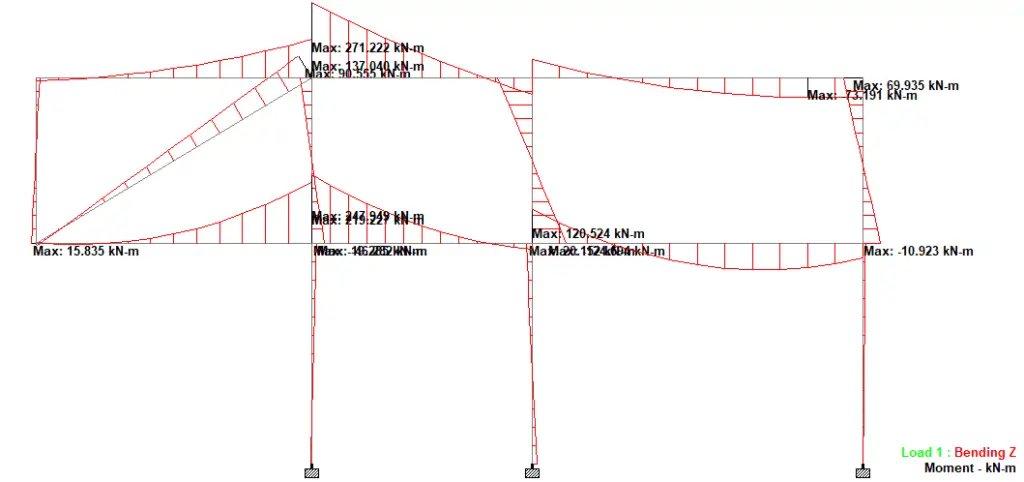
Figure 16: Bending moment diagram of the structure (with diagonal columns)

With the presence of the diagonal column, the maximum cantilever moment was 219.221 kNm (see Figure 16). However, the column sitting on top of the cantilever beam reversed to be a compression column, thereby transferring its loads to the cantilever beams.

sHEAR 2
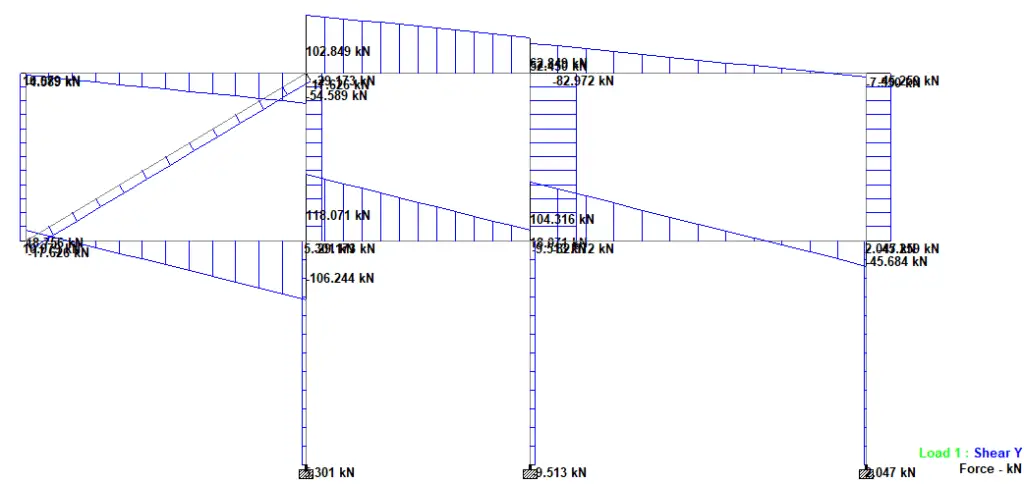
Figure 17: Shear force diagram of the structure (with diagonal columns)

With the presence of diagonal columns, the shear force at the fixed end of the cantilever is reduced to 106.244 kN as shown in Figure 17.

AXIAL 2
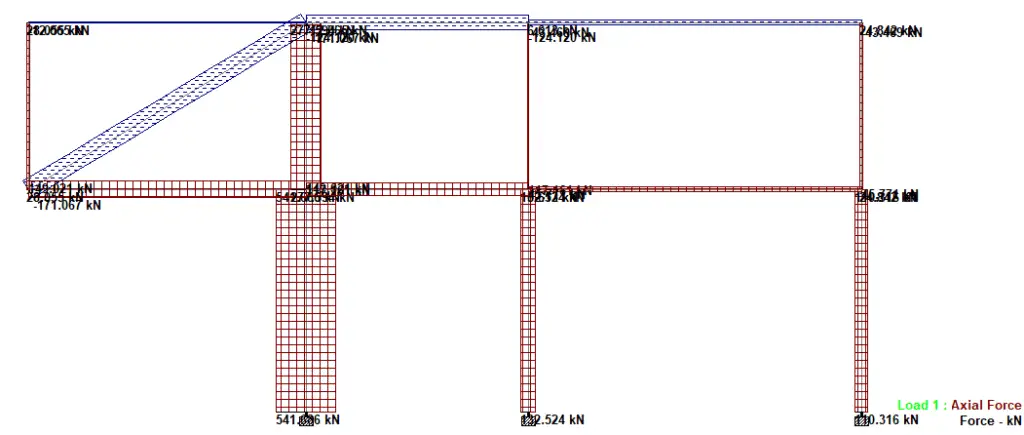
Figure 18: Axial force diagram of the structure (with diagonal columns)

Axial force diagram in Figure 18 shows that the diagonal column is in axial tension.

A table of comparison has been prepared below to show the effect of diagonal tension column support on the deflection behaviour of long span cantilever beams.

Without diagonal ColumnWith diagonal columnPercentage decrease
Deflection (mm)35.261 mm23.301 mm33.91%
Bending moment (kNm)372.701 kNm219.221 kNm41.18%
Shear force (kN)158.518 kN 106.244 kN32.97%

It can therefore be seen that the diagonal tension columns were effective in reducing the deflection, bending moment, and shear force on the cantilever beams. Where architectural specifications permit, cantilever beams and slabs can be supported using diagonal tension members for more structural efficiency.

Source of images:
Instagram @engnivaldo
Architects: @curvoarquitetos

Finite Difference Solution to Flow of Water Through Soils | Flownets

Manual sketching of flownets is an acceptable way of dealing with two-dimensional groundwater water flow and seepage in soils. However, as the geometry gets more complicated and the flow becomes anisotropic, manual sketching of flownets become more tedious and less accurate. In this case, finite difference solution to flow of water through soils can be adopted.

Many flow problems can be considered as two-dimensional, and in cases where permeability has the same value for all directions, the Laplace’s equation for flow becomes;

(∂2H/∂x2) + (∂2H/∂z2) = 0 ——— (1)

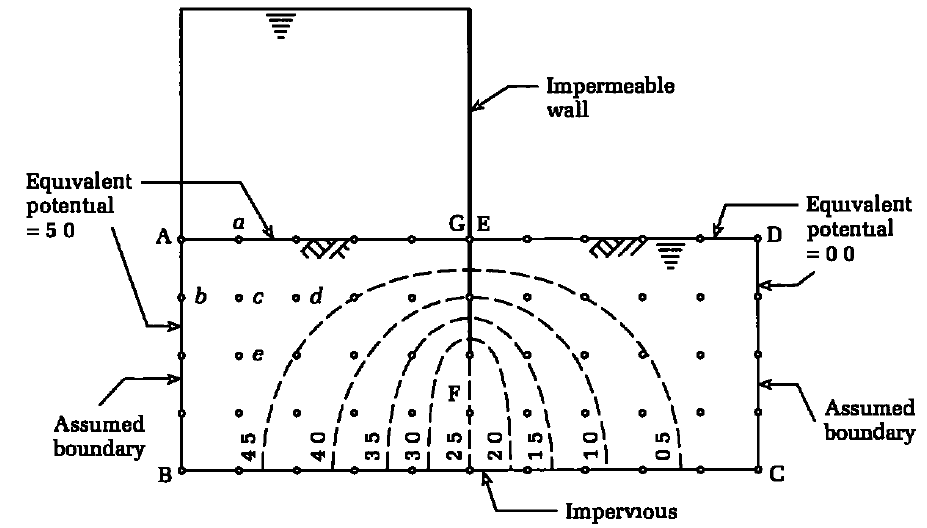
For problems with orthogonal geometry and Laplace’s equation, such as the flow around a pervious barrier shown in Figure 1, the finite difference method provides a quick and accurate solution. This entails replacing the continuous soil cross-section delimited by ABCD with a pattern of discrete points on an orthogonal grid within the cross-section. At each grid point, the governing differential equation can be expressed approximatively in terms of H values at that point and adjacent points.

Finite Difference Solution to Flow of Water Through Soils
Figure 1: Finite difference grid and results for seepage flow beneath an impermeable wall (Tomlinson, 2001)

Previously, we solved the elastic analysis of simply supported thin plates using the finite difference method. We will do the same to solve Laplace’s equation to determine two-dimensional confined flow through soils. Let us consider a grid of a flow domain, as shown in Figure 2, where (i, j) is a nodal point.

grid
Figure 2: A partial grid of the flow domain (Budhu, 2011)


Using Taylor’s theorem, we have;

kx(∂2H/∂x2) + kz(∂2H/∂z2) = kx/∆x2 (hi+1,j + hi-1,j – 2hi,j) + kz/∆z2 (hi,j+1 + hi,j-1 – 2hi,j) = 0 ——— (2)

Let α = kx/kz and ∆x = ∆z (i.e., we subdivide the flow domain into a square grid). Then, solving for hi,j from Equation (2) gives;

hi,j = 1/2(1 + α) × (αhi+1,j + αhi-1,j + hi,j+1 + hi,j-1) ——— (3)

For isotropic conditions, α = 1 (kx = kz) and Equation (3) becomes;

hi,j = 1/4 × (hi+1,j + hi-1,j + hi,j+1 + hi,j-1) ——— (4)

Since we are considering confined flow, one or more of the boundaries would be impermeable. Flow cannot cross impermeable boundaries and, therefore, for a horizontal impermeable surface;

h/x = 0 ——— (5)

The finite difference form of Equation (5) is;

h/x =1/2∆x(hi,j+1 – hi,j-1) = 0 ——— (6)

Therefore, hi,j+1 = hi,j-1 and, by substitution in Equation (4), we get;

hi,j = 1/4 × (hi+1,j + hi-1,j + 2hi,j-1) ——— (7)

Various types of geometry of impermeable boundaries are encountered in practice, three of which are shown in Figure 3. For Figure 3a, b, the finite difference equation is;

hi,j = 1/2 × (hi+1,j + hi,j-1) ——— (8)

boundary conditions encountered in practice
Figure 3: Three types of boundary encountered in practice (Budhu, 2011)

and, for Figure 3c,

hi,j = 1/3 × (hi,j-1 + hi+1,j + hi,j+1 + 0.5hi-1,j + 0.5hi,j+1) ——— (9)

The pore water pressure at any node (ui,j) is;

ui,j = γw(hi,j – zi,j) ——— (10)

where zi,j is the elevation head.

Contours of potential heads can be drawn from discrete values of hi,j. The finite difference equations for flow lines are analogous to the potential lines; that is, ψs replaces h in the above equations and the boundary conditions are specified for ψs rather than for h.

The horizontal velocity of flow at any node (vi,j) is given by Darcy’s law:

vi,j = kxii,j ——— (11)

Where ii,j is the hydraulic gradient expressed as;

ii,j = (hi+1,j – hi-1,j)/2∆x ——— (12)

Therefore;

vi,j = kx/2∆x × (hi+1,j – hi-1,j) ——— (13)

The flow rate, q, is obtained by considering a vertical plane across the flow domain. Let L be the top row and K be the bottom row of a vertical plane defined by column i (Figure 2). Then the expression for q is;

q = kx/4[hi+1,L – hi-1,L + 2∑(hi+1,j – hi-1,j) + hi+1,K – hi-1,K] ——— (14)

Procedure of Finite Difference Solution to Flow of Water Through Soils

sheet pile
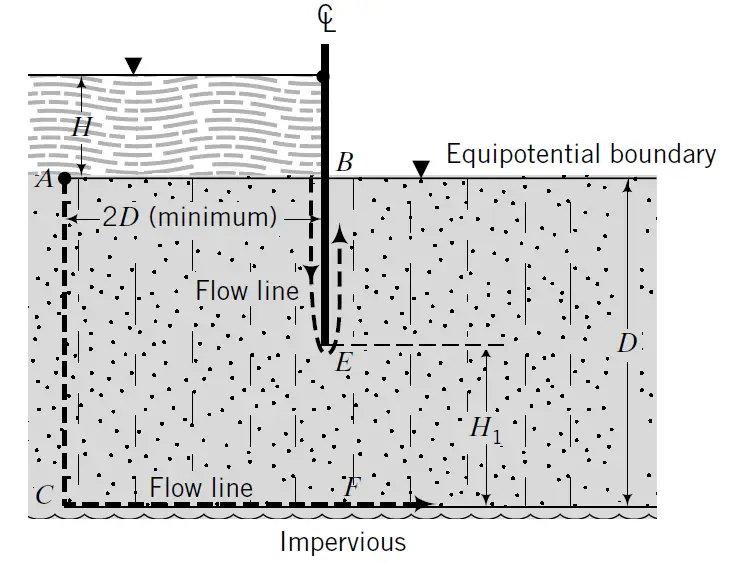
Figure 4: Sheet pile wall (Budhu, 2011)

The procedure to determine the distribution of potential head, flow, and porewater pressure using the finite difference method is as follows (Budhu, 2011):

  1. Divide the flow domain into a square grid. Remember that finer grids give more accurate solutions than coarser grids, but are more tedious to construct and require more computational time. If the problem is symmetrical, you only need to consider one-half of the flow domain.
    For example, the sheet pile wall shown in Figure 4 is symmetrical about the wall and only the left half may be considered. The total flow domain should have a width of at least four times the thickness of the soil layer. For example, if D is the thickness of the soil layer (Figure 4), then the minimum width of the left half of the flow domain is 2D.
  2. Identify boundary conditions, for example, impermeable boundaries (flow lines) and permeable boundaries (equipotential lines).
  3. Determine the heads at the permeable or equipotential boundaries. For example, the head along the equipotential boundary AB (Figure 4) is DH. Therefore, all the nodes along this boundary will have a constant head of DH. Because of symmetry, the head along nodes directly under the sheet pile wall (EF) is DH/2.
  4. Apply the known heads to corresponding nodes and assume reasonable initial values for the interior nodes. You can use linear interpolation for the potential heads of the interior nodes.
  5. Apply Equation (4), if the soil is isotropic, to each node except (a) at impermeable boundaries, where you should use Equation (7), (b) at corners, where you should use Equations (8) and (9) for the corners shown in Figure 3a–c, and (c) at nodes where the heads are known.
  6. Repeat item 5 until the new value at a node differs from the old value by a small numerical tolerance, for example, 0.001 m.
  7. Arbitrarily select a sequential set of nodes along a column of nodes and calculate the flow, q, using Equation (14). It is best to calculate q’ = q for a unit permeability value to avoid too many decimal points in the calculations.
  8. Repeat items 1 to 6 to find the flow distribution by replacing heads by flow q’. For example, the flow rate calculated in item 7 is applied to all nodes along AC and CF (Figure 4). The flow rate at nodes along BE is zero.
  9. Calculate the porewater pressure distribution by using Equation (10).

References

[1] Budhu M. (2011): Soil Mechanics and Foundations (3rd Edition). Pearson Education
[2] Tomlinson M. J. (2001): Foundation Design and Construction (7th Edition). John Wiley and Sons, Inc

Seepage of Water into Excavations

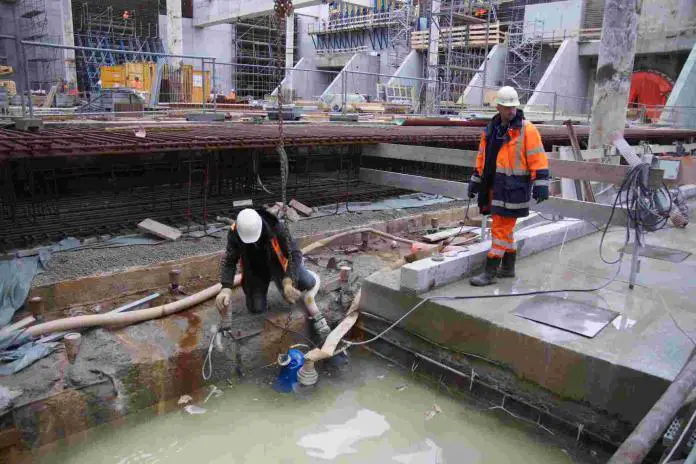
Groundwater is typically regarded as one of the most challenging problems encountered during excavation for civil engineering construction works. To control seepage of water into excavations, expensive and continuous pumping may be required, and the constant flow from the surrounding ground may cause settlement of adjacent structures.

The sides of open excavations are susceptible to eroding or collapsing if they are subjected to heavy inflows. Under certain conditions, the base can become unstable due to seepage towards the pumping sump, or if the bottom of excavation in clay is underlain by a pervious layer containing water under artesian pressure.

However, with knowledge of the soil and ground-water conditions and an understanding of the laws of hydraulic flow, it is possible to adopt ground-water control methods that will ensure a safe and cost-effective construction plan under any circumstances. Before beginning work, it is essential to collect all important data, and this aspect should not be overlooked during the site investigation phase.

Sometimes, after an excavation has been begun, more pumps are brought to the site, and with great difficulty the excavation is taken deeper until the inflow is so heavy that the sides start collapsing, endangering adjacent roads and buildings, or ‘boiling’ of the bottom is so extensive that a suitable base for foundation concreting cannot be obtained.

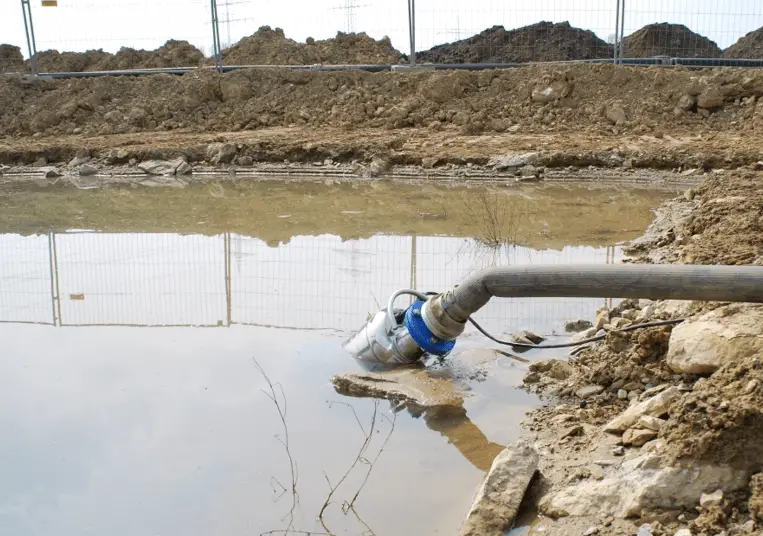
ground water pumping
Figure 1: Typical pumping of ground water from excavation

At this point, the contractor may give up and seeks assistance from outside sources to install a wellpointing or bored well system for ground-water lowering, or resorts to underwater construction. The ground-water lowering systems may be effective, but the overall cost of abortive pumping, extra excavation of collapsed material, making good the damage, and standing time of plant and labour would have been significantly higher had the ground-water lowering system been used in the first place.

Due to a lack of understanding of the capabilities of modern groundwater lowering systems, there have been instances in which caissons have been used for foundations in water-bearing soils when conventional construction with the aid of such systems would have been perfectly feasible and significantly less expensive.

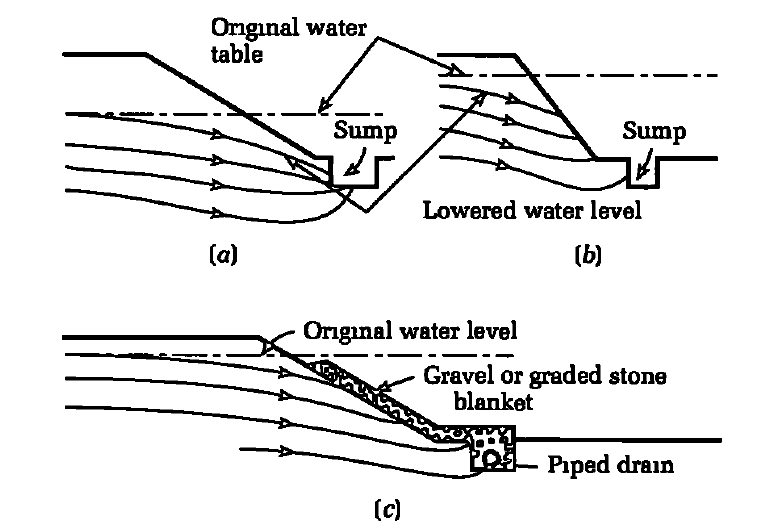
Figure 2(a) shows the flow line of groundwater under a relatively low head into an open excavation in permeable soil. The water surface is depressed toward the pumping sump, and as a result of the low head and flat slope, seepage lines do not emerge on the slope and conditions are stable.

Seepage of Water into Excavations
Figure 2: Seepage into open excavations (a) Stable conditions (b) Unstable conditions (c) Increasing stability of slope by blanketing (Tomlinson, 2001)

Nevertheless, if the head is increased or the slopes are steepened, the water will flow away from the face, and if the velocity is high enough, it will cause the movement of soil particles and erosion down the face, resulting in undermining as well as the collapse of the upper slopes (Figure 2(b)). The solution is to level the slopes and cover the face with a graded gravelly filter material that allows water to pass but traps soil particles (Figure 2(c)).

Graded filters will need to be properly designed, otherwise erosional instability might occur. This type of erosional instability is most likely to occur in fine or uniformly graded sands. Since well-graded sand gravels act as natural filters and their higher permeability prevents the emergence of flow lines on the excavated face, there is a significantly reduced risk of complications when using these materials.

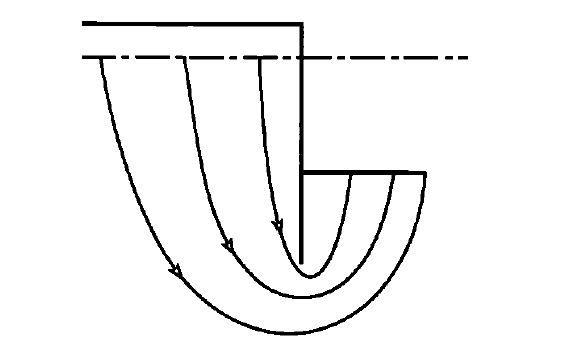
In the case of close-timbered or sheet-piled excavations, the flow lines descend behind the sheet piling before ascending into the excavation (Figure 3). This condition of upward seepage is especially prone to cause instability, known as “piping” or “boiling,” when the velocity of the upward-flowing water is sufficient to suspend soil particles.

seepage into sheeted
Figure 3: Seepage into sheeted excavation (Tomlinson, 2001)

The preceding cases are generally applicable to groundwater flow in permeable soils, such as sands and gravels, or similar materials with relatively low proportions of silt and clay. Little or no difficulty is encountered when excavating in clays. When groundwater is present, it typically seeps through fissures and can be removed by pumping from sump wells.

Typically, the flow velocity is so low that there is no risk of erosion. Silts, however, are extremely problematic. They are permeable enough to allow water to pass through, but their permeability is low enough to make any system of ground-water lowering by wellpoints or bored wells a time-consuming and expensive process. Typically, ground water in rocks seeps from the face as springs or seeps through fissures or permeable layers. There is no risk of instability unless heavy flows pass through a brittle, fractured rock.

Generally, water in rock excavations can be pumped from open sump pits, with the exception of when foundation concrete is intended to be placed against the rock face. If the springs or weeps are strong, the water will wash the cement and fines from the unset concrete and flow out through the concrete’s surface.

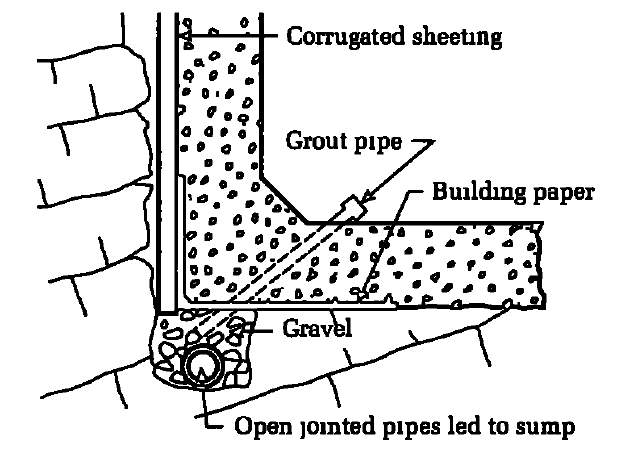
The standard procedure is to construct the pumping sump at the lowest point of the excavation and continue pumping from it until the concrete has hardened, while allowing seepage to occur from the face towards the sump through a layer of ‘no fines’ concrete, or behind corrugated sheeting, or bituminous or plastic sheeting attached to a wire mesh frame (Figure 4).

water bearing rock formation
Figure 4: Concreting adjacent to water-bearing rock formation (Tomlinson, 2001)

After the concrete work is completed, the area behind the sheeting is grouted using the pipes left for this purpose. Typically, occasional weeping can be remedied by plastering with quick-setting cement mixtures or by applying dry cement to the face prior to pouring concrete.

Calculation of rates of seepage of water into excavations

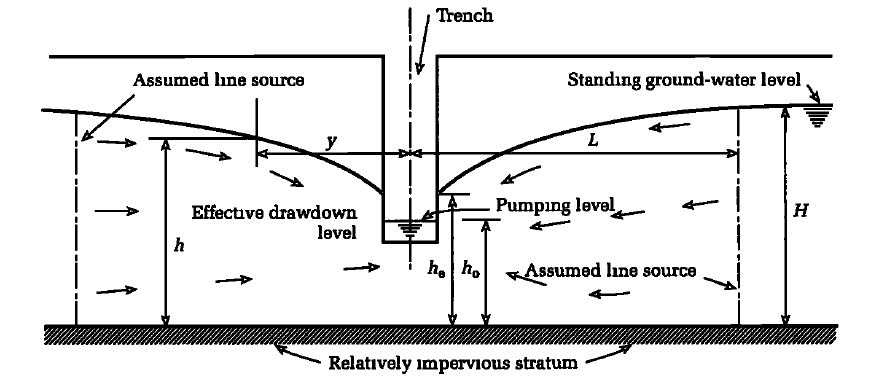
In large excavations, it is necessary to estimate the amount of water that must be pumped in order to remove the water from below the formation level. This quantity must be known in order to provide the required number and capacity of pumps. In the case of long-relative-to-width trench excavations, the flow calculation can typically be modelled as a condition of gravitational flow to a partially penetrating slot (Figure 5).

ground water flow
Figure 5: Gravity flow to trench excavation (partially penetrating slot) – draw-down for gravity flow for sources remote from trench (Tomlinson, 2001)
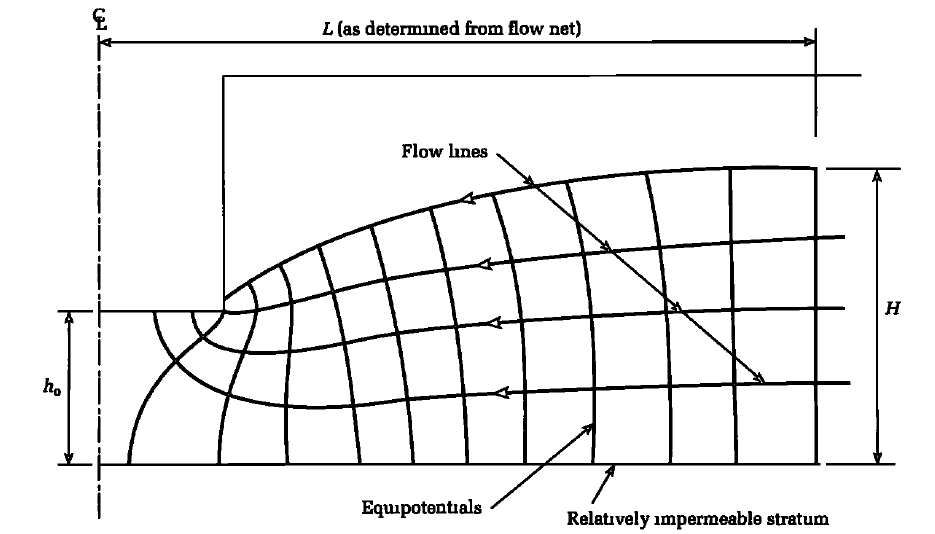
drawdown flow net
Figure 6: Flow net for conditions in Figure 5 (Tomlinson, 2001)

For this flow condition, ground water in the pervious layer is not confined by an impervious layer above it, and the trench does not extend completely through the pervious water-bearing layer. In addition, the source of ground water is distant from the excavation, as there is no large body of water such as a river or the ocean nearby.

For the conditions in Figures 5 and 6, flow to the trench from both sides of the excavation is given by the equation;

q = [0.73 + 0.27(H – h0)/H] k/L(H2 – h02) ——— (1)

where;
q = quantity of flow per unit length of trench,
k = coefficient of permeability of the pervious layer,
H, h0, and L are dimensions as shown in Figure 5.

The dimension L can be obtained by drawing a flow net as shown typically in Figure 6 or approximately by substituting L for R0 in equation (5) (see below). Where the draw-down (H — h) has been measured in a trial excavation at a distance y from the slot, L can be obtained from the equation;

H2 — h2 = (L – y)/L (H2 – hc2) ——— (2)

Where the trench penetrates fully the water-bearing layer, the flow to the trench from both sides of the excavation is given by the equation;

q = k/L(H2 – hc2) ——— (3)

If there is a large body of water such as the sea or a river close to one side of the excavation, the flow to the opposite side from a remote source of water will be small in comparison with that to the side close to the line source and it can be neglected. The flow from the nearby source, assuming this to be a line source of infinite length compared to the length of the trench, is equal to half the quantity as calculated by either equations (1) or (3), and the distance L is the distance from the trench to the nearby source.

Where a pumping test has been made in the excavation and the draw-down (H — h) is measured at a radius r from the well, the dimension R0 for gravity flow can be calculated from the equation;

H2 — h2 = [(H2 — hw2)/loge(R0/rw)] × loge(R0/r) ——— (4)

Alternatively R0 can be obtained by drawing a flow net or it can be obtained approximately from the empirical equation.

R0 = CH√k ——— (5)

where;
C = a factor equal to 3000 for radial flow to pumped wells and between 1500 and 2000 for line flow to trenches or to a line of well points,
H = total draw-down in metres,
k = coefficient of permeability in metres per second

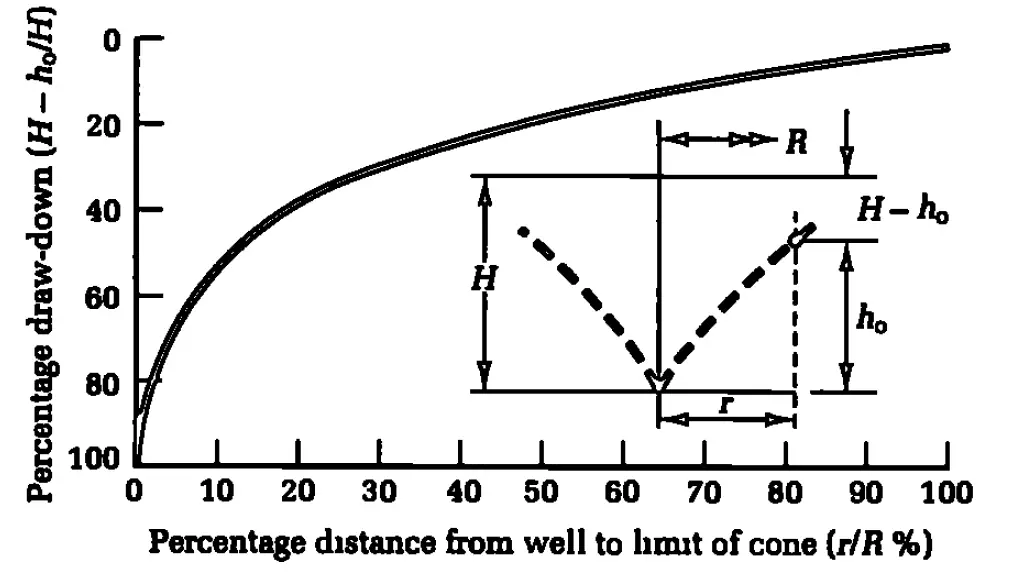
Shape of Draw Down Curve

It is often necessary to determine the shape of the drawdown curve to a well, for example to assess the risk of settlement of existing structures near the excavation. The draw-down in uniform soils can be obtained by means of Figure 7.

ghy
Figure 7: Determination of shape of draw-down curve (Tomlinson, 2001)

In the case of large rectangular or irregularly shaped excavations, the flow can be calculated by drawing a plan flow net of the type shown in Figure 8, when for gravity flow to a fully penetrating excavation the flow per unit thickness of the pervious layer is given by the equation;

q = k(H – he) × (Nf / Ne) ——— (6)

or for a thickness D of pervious water-bearing soil, the total flow to the excavation is given by;

Q = k(H – he) × D(Nf / Ne) ——— (7)

where;
k = coefficient of permeability,
Nf = number of flow lines,
Ne = number of equipotential lines

Worked Example

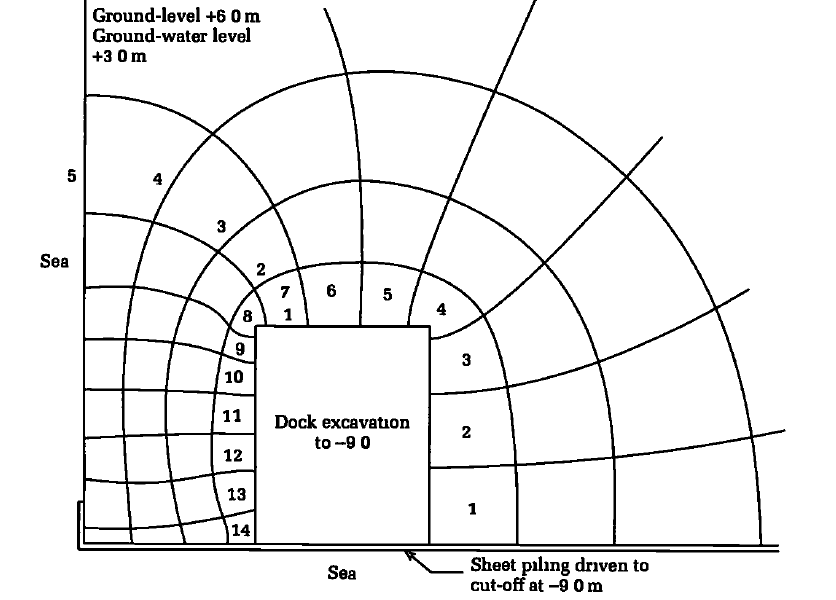
The plan flow net for a gravity flow to fully penetrating excavation for dry dock is shown below. For the example, H = 12.0 m, hc = 0, k = 8 × 10⁻⁴ m/s, D = 12.0 m, Nf = 14, Ne = 5

Flow net
Figure 8: Typical flow net of an excavation (Tomlinson, 2001)

Therefore
Q = 8 × 10-4 × (12 — 0) × 12 × (14/5) = 0.32 m3/s or 19200 litres/min

It is important to note that the equations generated above are for the quantity of flow when stead state conditions have been obtained. A higher pumping capacity will be required in large and deep excavations if the time required to achieve the necessary draw down is not to be unduly protracted. The volume of water to be pumped out from standing water level to full draw down conditions in the excavation should be calculated and divided by the time required by the construction programme. This will give the initial pumping capacity to achieve the required draw down.

References
Tomlinson M. J. (2001): Foundation Design and Construction (7th Edition). Pearson Education

Flownets: Two-Dimensional Flow of Water Through Soils

Laplace’s equation is used to describe the movement of water through soils. By comparison, the flow of water through soils is analogous to the steady-state heat flow and steady-state current flow in homogeneous conductors. Flownets can be used to calculate the flow of water through soils based on the Laplace’s equation. The common form of Laplace’s equation for the flow of water through two-dimensional soils is:

kx(∂2H/∂x2) + kz(∂2H/∂z2) = 0 ——– (1)

where H is the total head and kx and kz are the hydraulic conductivities in the X and Z directions. The condition that the changes in hydraulic gradient in one direction are balanced by changes in the other directions is expressed by Laplace’s equation.

The assumptions in Laplace’s equation are:


• Darcy’s law is valid.
• Irrotational flow (vorticity) is negligible. This assumption leads to the following two-dimensional relationship in velocity gradients.

∂vz / ∂Z = ∂vx / ∂X

where vz and vx are the velocities in the Z and X directions, respectively. This relationship is satisfied for a uniform flow field and not a general flow field. Therefore, we will assume all flows in this chapter are uniform, i.e., vz = vx = constant.
• There is inviscid flow. This assumption means that the shear stresses are neglected.
• The soil is homogeneous and saturated.
• The soil and water are incompressible (no volume change occurs).

Laplace’s equation is also called the potential flow equation because the velocity head is neglected. If the soil is an isotropic material, then kx = kz and Laplace’s equation becomes;

(∂2H/∂x2) + (∂2H/∂z2) = 0 ——– (2)

Any differential equation requires knowledge of the boundary conditions in order to be solved. Since the boundary conditions of the majority of “real” structures are complex, an analytical or closed-form solution cannot be obtained for these structures. Using numerical techniques such as finite difference, finite element, and boundary element, it is possible to obtain approximate solutions.

We can also attempt to replicate the flow through the actual structure using physical models. There are two major techniques for solving Laplace’s equation. The first is an approximation known as flownet sketching, and the second is the finite difference method. In this article, we are going to focus on flownet sketching.

Flownet Sketching

The flownet sketching technique is straightforward and adaptable, and it represents the flow regime. It is the preferred method of analysing flow through soils for geotechnical engineers. Before delving into these solution techniques, however, we will establish a few key conditions necessary to comprehend two-dimensional flow.

The solution of Equation (1) is solely dependent on the total head values within the flow field in the XZ plane. Let us introduce a velocity potential (ξ) that describes the variation of total head in a soil mass as follows:

ξ = kH ——– (3)

where k is a generic hydraulic conductivity. The velocities of flow in the X and Z directions are;

vx = kx(∂H/∂x) = ∂ξ/∂x ——– (4a)
vz = kz(∂H/∂z) = ∂ξ/∂z ——– (4b)

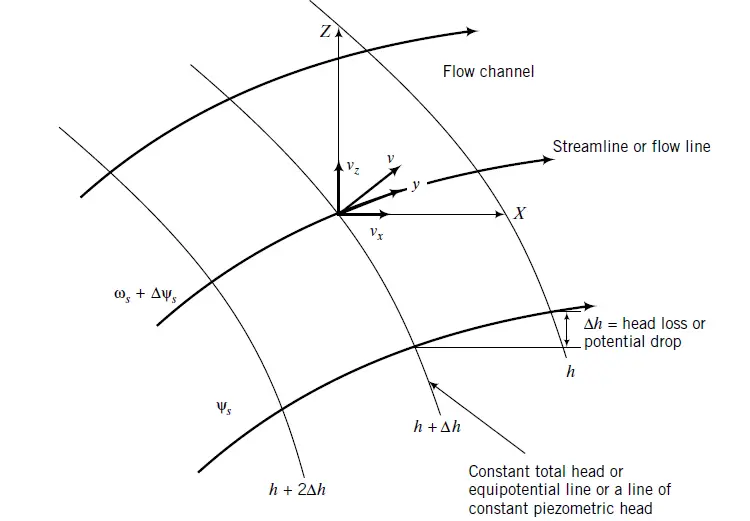
illustration of flow terms
Figure 1: Illustration of flow terms.

The inference from Equations (4a) and (4b) is that the velocity of flow (v) is normal to lines of constant total head, as illustrated in Figure 1 The direction of v is in the direction of decreasing total head. The head difference between two equipotential lines is called a potential drop or head loss.

If we draw lines that are tangent to the flow velocity at each point in the flow field in the XZ plane, we will obtain a series of lines that are normal to the equipotential lines. These lines are known as streamlines or flow lines (Figure 1). A flow line represents the expected path of a particle of water in a steady-state flow. ψs is a stream function that represents a streamline family (x, z). According to the stream function, the components of velocity in the X and Z directions are as follows:

vx = ψs / z ——– (5a)
vz = ψs / x ——– (5b)

Since flow lines are normal to equipotential lines, there can be no flow across flow lines. The rate of flow between any two flow lines is constant. The area between two flow lines is called a flow channel (Figure 1). Therefore, the rate of flow is constant in a flow channel.

Criteria for Sketching Flownets

A flownet is a graphical representation of a flow field that satisfies Laplace’s equation and comprises a family of flow lines and equipotential lines. A flownet must meet the following criteria (Budhu, 2011):

  1. The boundary conditions must be satisfied.
  2. Flow lines must intersect equipotential lines at right angles.
  3. The area between flow lines and equipotential lines must be curvilinear squares. A curvilinear square has the property that an inscribed circle can be drawn to touch each side of the square and continuous bisection results, in the limit, in a point.
  4. The quantity of flow through each flow channel is constant.
  5. The head loss between each consecutive equipotential line is constant.
  6. A flow line cannot intersect another flow line.
  7. An equipotential line cannot intersect another equipotential line.

An infinite number of flow lines and equipotential lines can be drawn to satisfy Laplace’s equation. However, only a few are required to obtain an accurate solution. The procedure for constructing a flownet is described next.

Flownet for Isotropic Soils

According to Budhu (2011), the procedure for constructing the flownet of isotropic soils are as follows;

  1. Draw the structure and soil mass to a suitable scale.
  2. Identify impermeable and permeable boundaries. The soil–impermeable boundary interfaces are flow lines because water can flow along these interfaces. The soil–permeable boundary interfaces are equipotential lines because the total head is constant along these interfaces.
  3. Sketch a series of flow lines (four or five) and then sketch an appropriate number of equipotential lines such that the area between a pair of flow lines and a pair of equipotential lines (cell) is approximately a curvilinear square. You would have to adjust the flow lines and equipotential lines to make curvilinear squares. You should check that the average width and the average length of a cell are approximately equal by drawing an inscribed circle. You should also sketch the entire flownet before making adjustments.
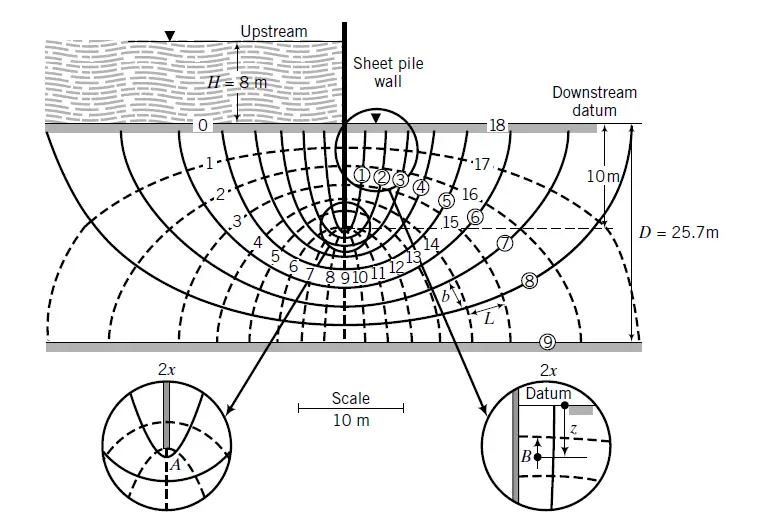
Flownet of a sheet pile wall
Figure 2: Flownet for a sheet pile (Budhu, 2011)

The flownet in confined areas between parallel boundaries typically consists of elliptical and symmetrical flow lines and equipotential lines (Figure 2). Avoid abrupt changes between straight and curved flow and equipotential lines. Transitions should be smooth and gradual. For certain problems, portions of the flownet are enlarged, are not curvilinear squares, and do not satisfy Laplace’s equation.

For instance, the portion of the flownet beneath the base of the sheet pile in Figure 2 is not composed of curvilinear squares. Check these sections to ensure that repeated bisection results in a point for a precise flownet.

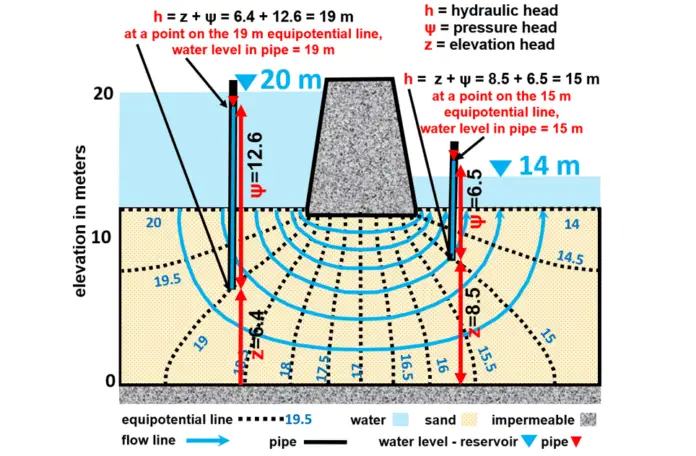
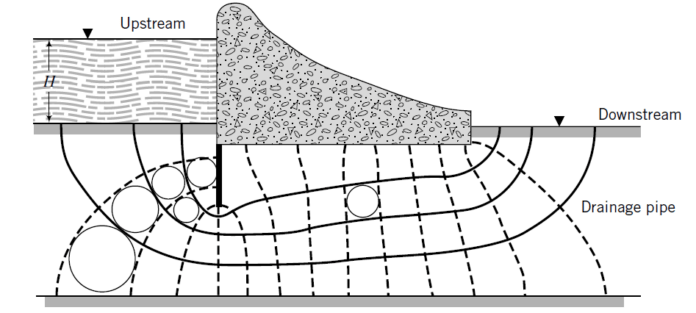
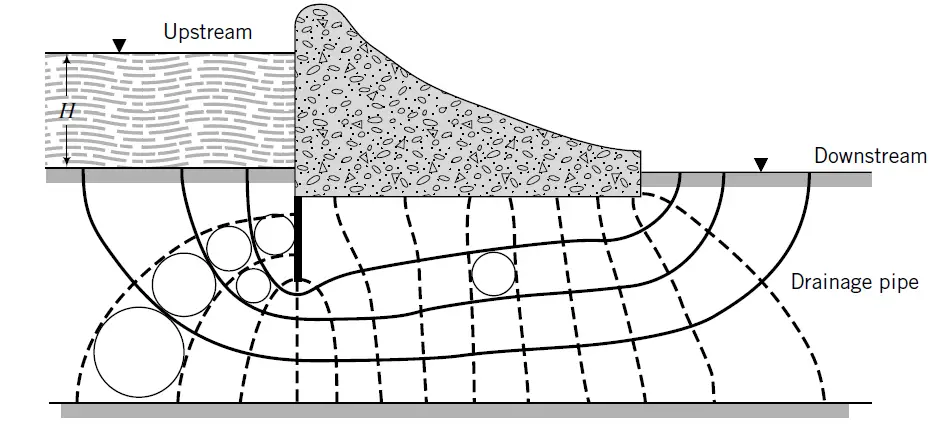
Another example of flownet are shown in Figures 3. Figure 2 shows a flownet for a sheet pile wall, and Figure 3 shows a flownet beneath a dam. In the case of the retaining wall, the vertical drainage blanket of coarse-grained soil is used to transport excess porewater pressure from the backfill to prevent the imposition of a hydrostatic force on the wall. The interface boundary, is neither an equipotential line or a flow line. The total head along the boundary is equal to the elevation head.

flownet for a dam
Figure 3: Flownet under a dam with a cutoff curtain (sheet pile) on the upstream end (Budhu, 2011)

Flow Rate

Let the total head loss across the flow domain be ΔH, that is, the difference between upstream and downstream water level elevation. Then the head loss (Δh) between each consecutive pair of equipotential lines is;

Δh = ΔH/Nd ——– (6)

where Nd is the number of equipotential drops, that is, the number of equipotential lines minus one. In Figure 1, ΔH = H = 8 m and Nd = 18. From Darcy’s law, the flow through each flow channel for an isotropic soil is;

q = Aki = (b × 1)k(Δh/L) = kΔh(b/L) = k(ΔH/Nd)(b/L) ——– (7a)

where b and L are defined as shown in Figure 14.3. By construction, b/L = 1, and therefore the total flow is;

q = kΔH(Nf/Nd) ——– (7b)


where Nf is the number of flow channels (number of flow lines minus one). In Figure 1, Nf = 9. The ratio Nf /Nd is called the shape factor. Finer discretization of the flownet by drawing more flow lines and equipotential lines does not significantly change the shape factor. Both Nf and Nd can be fractional. In the case of anisotropic soils, the quantity of flow is;

q = ΔH(Nf/Nd)√(kxkz) ——– (8)

Summarily, Flow nets are typically designed for homogeneous, isotropic porous media undergoing saturated flow to known boundaries. There are extensions to the basic method that make it possible to solve the following cases:

  • inhomogeneous aquifer: matching conditions at property boundaries
  • anisotropic aquifer: drawing the flownet in a transformed domain and scaling the results differently in the principal hydraulic conductivity directions before returning the solution
  • one boundary is a seepage face: iteratively solving for both the boundary condition and the solution throughout the domain

The method is typically applied to these types of groundwater flow problems, but it can be applied to any problem described by the Laplace equation, such as the flow of electric current through the earth.

References
Budhu M. (2011): Soil Mechanics and Foundations (3rd Edition). John Wiley & Sons, Inc.

Design of Buoyancy Raft Foundations | Compensated Foundation

The purpose of a raft foundation is to spread the superstructure load across as much ground as possible and to provide the substructure some rigidity so that it can bridge over weaker or more compressible soil. The rigidity of a raft foundation also lowers differential settlement in soft clays. The principle of buoyancy is used in buoyancy rafts and basements (or box foundations) to lower the net weight on the soil. By so doing, the foundation’s total and differential settlements are therefore lowered. Bouyancy rafts are also called compensated foundations.

Buoyancy is produced by constructing a hollow substructure with a depth such that the weight of the soil excavated for it is equal to or slightly less than the combined weight of the superstructure and substructure.

Worked Example on Buoyancy Raft Foundation

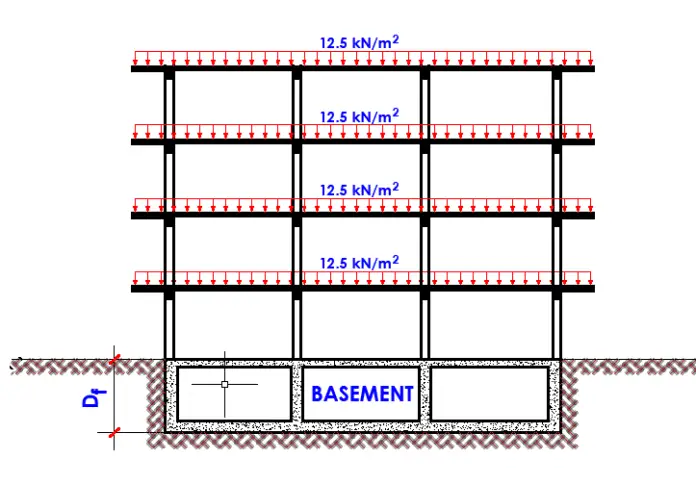
A four storey building is to be founded on soft clay which extends up to a depth of about 8m. The ultimate load per floor on the building is 12.5 kN/m2 while the proposed basement raft and the entire substructure is expected to weigh 25 kN/m2. By what depth should the basement be excavated such that there is no net pressure on the foundation? Take unit weight of clay as 18 kN/m2.

Worked Example on Buoyancy Raft Foundation

Solution

Total load from the superstructure = 12.5 x 4 = 50 kN/m2
Weight of substructure = 25 kN/m2
Total load transmitted to the foundation = 75 kN/m2

Effective pressure at the required depth = (18 x Df) = 18Df
For zero net pressure on the foundation;
18Df = 75
Depth of foundation Df = 75/18 = 4.167 m (say 4.2 m)

In the example shown above, excavation to a depth of 4.2 m for the basement relieves the soil at foundation level of a pressure of about 75.6 kN/m2. Since substructure itself weighs about 25 kN/m2, a loading of 50 kN/m2 can be placed on the basement before any additional loading causing settlement comes on to the soil at foundation level. A bearing pressure of 50 kN/m2 is roughly equivalent to the overall loading of a four-storey block of flats or offices.

Note that a reinforced concrete framed structure with brick and concrete external walls, lightweight concrete partition walls, and plastered finishing weighs about 12.5 kN/m2 each storey, which is a good rough estimate for calculating the weight of a multistory block of apartments. This figure includes a dead load of 100% and a maximum design live load of 60%.
As a result, a building of this height can theoretically be sustained on a basement founded in very soft and very compressible soil without settling.

If we assume that the building in the example studied above is placed on a mat foundation with dimensions of 20m x 15m, and the cohesion of the clay Cu is 30 kN/m2. We can determine the depth of the foundation for a factor of safety of 3 against bearing capacity failure. This will now be a case of partially compensated foundation.

The net ultimate bearing capacity of a mat foundation founded on clay is given by;

qnet(u) = qu – q = 5.14Cu[(1 + 0.195B/L)(1 + 0.4Df/B) (Das, 2008)

For a partially compensated foundation, the factor of safety is given by;
FS = qnet(u) / q = qnet(u) / (Q/A – γDf)

Hence, FS = 5.14Cu[(1 + 0.195B/L)(1 + 0.4Df/B) / (Q/A – γDf)

We can verify that Q/A = 75 kN/m2
B/L = 15/20 = 0.75

5.14Cu[(1 + 0.195B/L)(1 + 0.4Df/B) = [5.14(30) × [1 + (0.195 × 0.75)] × (1 + 0.4(Df/15)] = 176.751 + 4.719Df
(Q/A – γDf) = 75 – 18Df

Therefore;
3 = (176.751 + 4.719Df)/(75 – 18Df)
225 – 54Df = 176.751 + 4.719Df
48.249 = 58.719Df
On solving, Df = 0.821 m

Challenges in the Construction of Buoyancy Rafts

In practice, however, balancing the loads so that no additional pressure is applied to the soil is not easily achievable. Fluctuations in the water table alter the foundation’s buoyancy, and the intensity and distribution of live loading cannot be accurately predicted in most circumstances. Another aspect that contributes to the settlement of a buoyant foundation is the reconsolidation of swollen soil caused by the elimination of overburden pressure during substructure excavation.

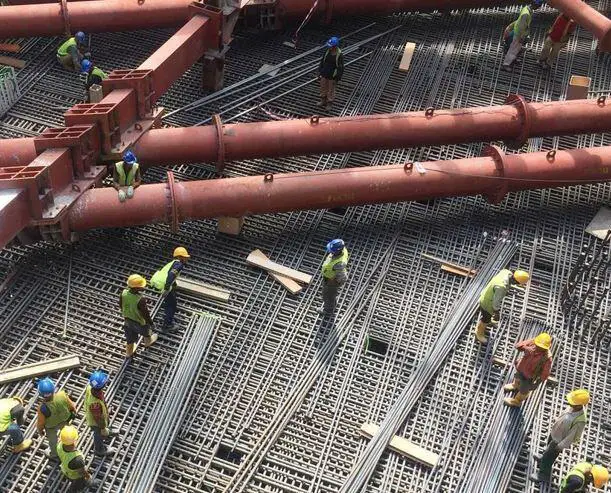
buoyancy raft foundation
Typical construction of a raft foundation

When the superstructure is built up, any swelling caused by elastic or long-term movements must be followed by reconsolidation when loading is replaced on the soil. For economy in the depth of foundation construction it is the usual practice to allow some net additional load to come on to the soil after the total of the dead load of the structure and its full live loading has been attained. The allowable intensity of pressure of this additional loading is determined by the maximum total and differential settlements which can be tolerated by the structure.

Both the ultimate and serviceability limit states must be considered in terms of limit states. Although a well designed buoyancy raft or basement should not experience bearing capacity failure, there is a danger of suffering an eventual limit condition owing to flotation of a fully or partially completed substructure.

An overestimation of soil density and ground-water table height could result in an underestimation of soil bearing pressure, resulting in excessive settling. Factors such as future groundwater table lowering or, conversely, future groundwater level rising due to site floods should be considered. In multi-cell buoyancy rafts, the weights of constructional materials and wall thicknesses (geometrical data) can be very critical.

Surcharges such as placing fill around a semi-buoyant substructure can be critical particularly if placed on one side only causing tilting. The latter can also be caused by variations in the position of imposed loading (spatial distribution), for example by stacked containers in a warehouse.

According to the EN 1997-1 (EC 7) regulation (Section 8, Retaining Structures), design values for the unit weight of water must take into account whether the water is fresh, saline, or chemically contaminated. Design parameters for water pressure and seepage forces are necessary to represent the limit state conditions with severe effects. The design values for limit states with less severe effects (often serviceability limit states) should represent the most unfavourable values that could occur in normal conditions.

Design of Buoyancy Rafts

It is very important to understand the differences between a basement and a buoyancy raft foundation. Although a basement functions as a type of buoyancy raft, it is not always constructed for that purpose. The main purpose of a basement is to provide the owner more room in the building, and the fact that it lowers the net bearing pressure due to the weight of the displaced soil may be purely coincidental. Basements are sometimes required for their function in decreasing net bearing stresses, and this is taken advantage of to create additional substructure floor area.

basement construction
Typical construction of a basement wall

The genuine buoyancy raft, on the other hand, is a foundation that is built only to sustain the structure using the buoyancy provided by the displaced earth, with no consideration for other uses of the space. The raft is designed to be as light and rigid as possible to achieve this goal. Cellular or ‘egg-box’ architecture is the best way to combine lightness with rigidity.

This structural form limits the usefulness of the space within the substructure to accommodate any pipework or service ducts passing through holes in the walls of the cells. Because of the many problems inherent in the design and construction of buoyancy rafts, they have, in most cases, been supplanted by other expedients, mainly by various types of piling.

Maintaining buoyancy under ground conditions that need the cells to be waterproof might cause issues. Where the rafts are built in the shape of caissons, asphalt tanking or other membrane protection is not possible, and any water that seeps through fractures in the exterior walls or base shall be pumped out. Interior cell walls should have openings to allow water to drain to a sump where an automated pump can be placed.

In structures supported by buoyancy rafts, when gas is used for household heating or industrial activities, the cells should be sealed to prevent dangerous gas accumulations within the substructure.

Buoyancy rafts can be constructed either as open well caissons or in-situ in an open excavation. The caisson method is appropriate for soft clays because the soil within the cells can be grabbed as the raft sinks under its own weight. This approach, however, is inadequate for ground conditions when rigidity and weight are required to facilitate sinking through obstructions. When the soil is disturbed by grabbing reconsolidates under the superstructure loading, some settling should be expected where the caissons are terminated within the soft clay.

Construction in open excavations is appropriate for sites where the ground-water level can be maintained by pumping without risk of ‘boiling,’ and where soil heave at the excavation’s base is not extreme.

Expansion Joints in Bridges

When two structural elements are designed to move relative to one another, an expansion joint is usually required to seal the gap between the two elements while also accommodating their relative movements. Expansion joints in bridges are usually provided to allow for thermal expansion and contraction of the bridge deck, and to also allow for movement due to traffic actions on the bridge. The gap between the deck end and the abutment wall is frequently the case for bridges. On long viaducts or continuous bridges, however, additional joints may be required between deck portions to limit the movement at any one place.
Expansion joints are a point of weakness within a bridge due to its function, and there have been several occurrences of joints leakage, which can cause problems to the bridge. For example, corrosion of the bridge reinforcement has commonly occurred when de-icing salt-laden water has seeped onto bearing shelves or pier supports.
The required repairs are substantially more expensive than the joint’s initial capital cost, especially when traffic delays are included. It is therefore important to pay careful attention to the design, detailing, and installation of bridge expansion joints in order to reduce the risk of future high repair costs for the bridge owner.

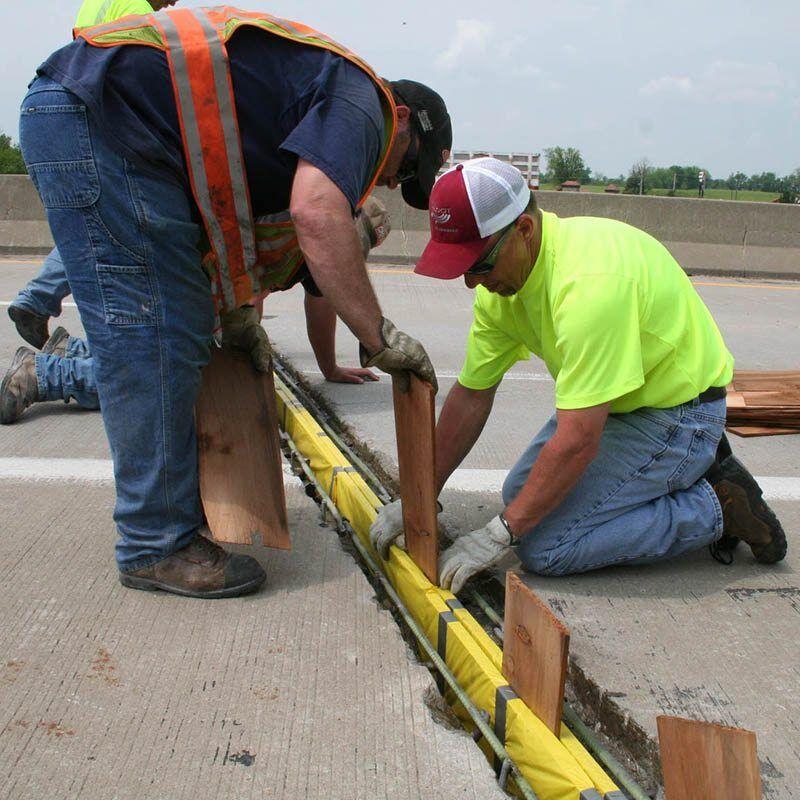
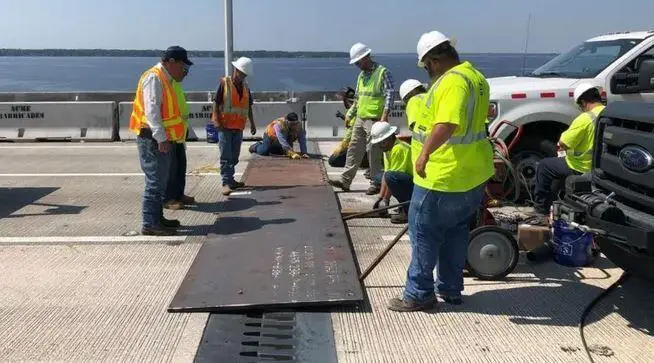
Expansion joint repair and maintenance works
Figure 1: On going bridge expansion joint maintenance and repair

One of the main reasons for the rising use of integral bridge design is the susceptibility of expansion joints. Integral bridge construction eliminates the requirement for expansion joints by attaching the deck directly to the abutments. The removal of expansion joints is often recommended where possible due to the problems they can cause.
An integral bridge, on the other hand, will have the same load effects and causes of movement as an expansion joint, however, the effects of the movement will need to be considered in its design. However, integral construction will not be a possibility for many bridges, especially those already built, and expansion joints will always be required.

Performance Criteria of Expansion Joints in Bridges

For an expansion joint to function well, it must possess a number of qualities. Some of them are listed below;

  1. It must withstand loads and movements without causing failure to itself or other sections of the structure.
  2. It should be watertight
  3. It should provide a smooth ride, and pose no danger to road users such as cyclists, pedestrians, or equestrians.
  4. The joint’s skid resistance should equal that of nearby surfacing
  5. Noise emissions from the expansion joint should be kept to a minimum, especially if it’s going to be used in residential areas.
  6. The joint should be easy to inspect and maintain.

Types of Expansion Joints in Bridges

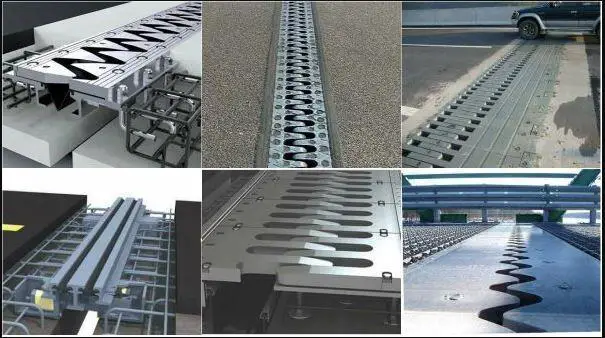
Different types of expansion joint are presented below, together with an indication of typical movement ranges for each type of joint. Different types of expansion joints are listed in Reid et al (2008) and reproduced here.

Expansion Joints in Bridges
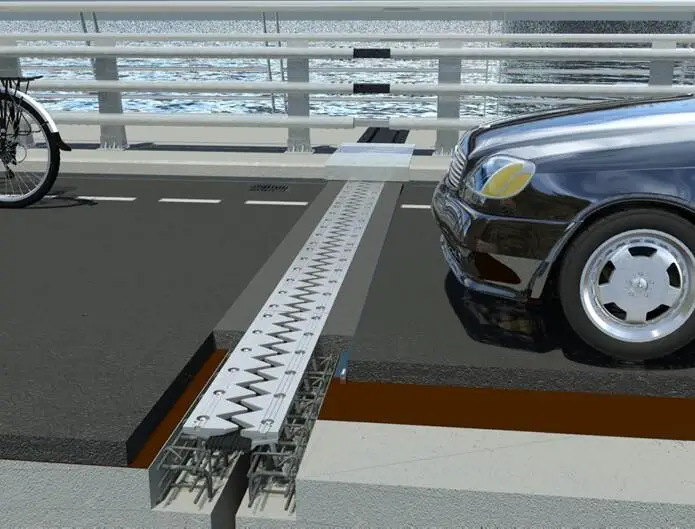
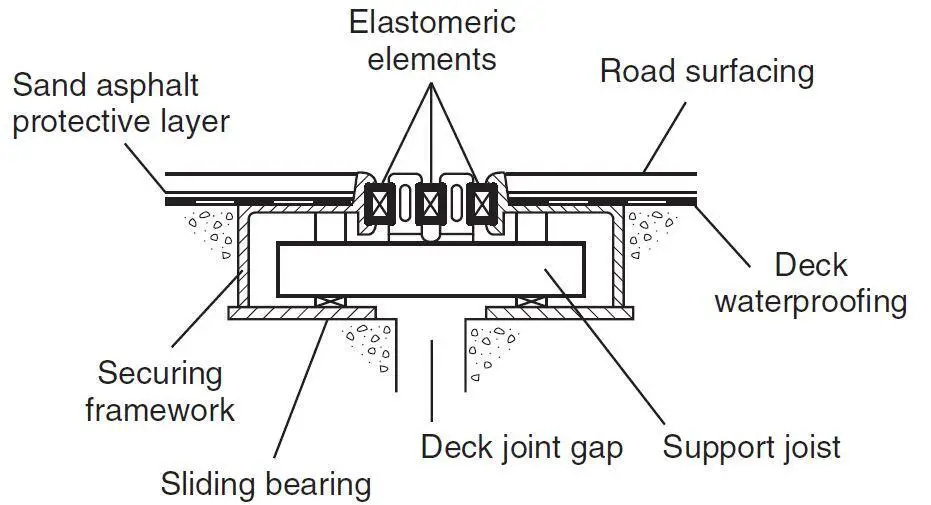
Figure 2: Different types of expansion joints

Buried Expansion Joint

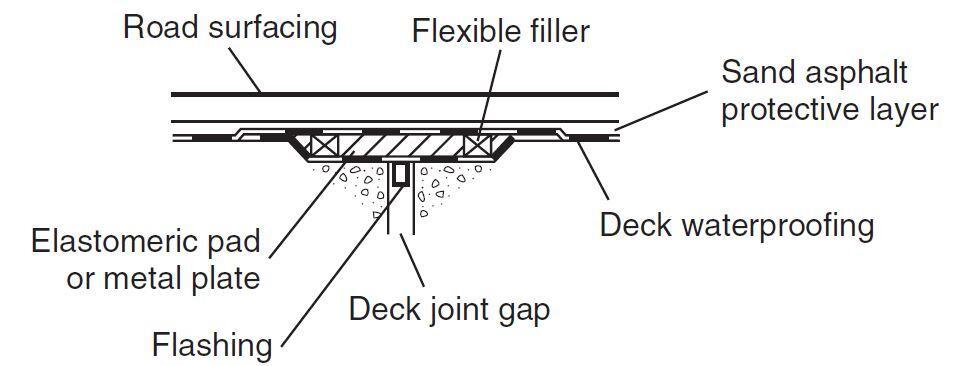
This expansion joint is essentially covered by the road surfacing. It permits movement up to 20 mm (±10 mm). For movements up to 10 mm the joint can be formed on top of the deck using a flashing and waterproofing layer to bridge the gap. For larger movements the flashing is dropped down into a recess below the top of the deck and an elastomeric pad used to fill the recess.

Buried joint
Figure 3: Buried expansion joint (Reid et al, 2008)

Asphaltic Plug Expansion Joint

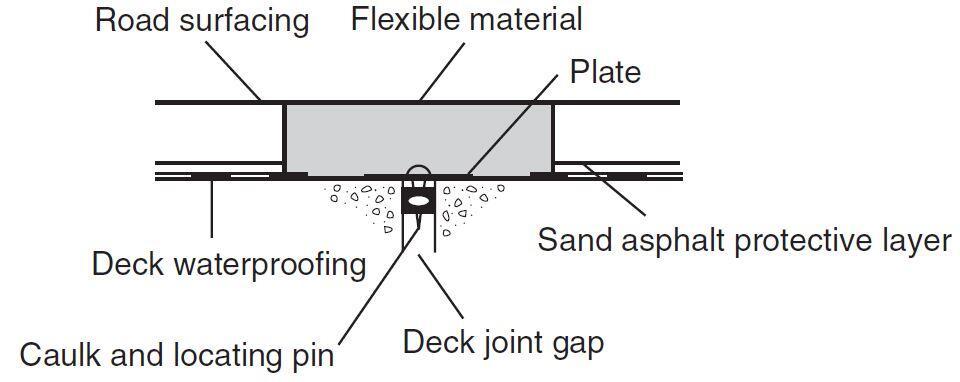
This expansion joint consists of an in-situ joint of flexible bituminous material, which provides both an expansion medium and the running surface. The deck joint gap is covered by a thin plate. It permits a movement range of up to 40 mm (±20 mm).

Asphaltic plug joint
Figure 4: Asphaltic plug expansion joint (Reid et al, 2008)

Nosing Expansion Joint

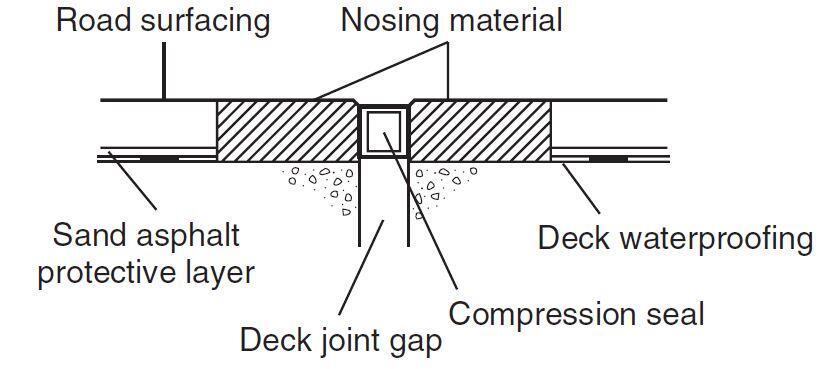
This type of joint consists of a relatively stiff nosing material of cementitious polyurethane, polyuride or epoxy binders protects the adjacent edges of the surfacing and a compression seal (or poured sealant) protects against ingress of water. It permits a movement range of up to 12 mm with poured sealant and up to 40 mm with a preformed compression seal.

Nosing joint
Figure 5: Nosing expansion joint (Reid et al, 2008)

Reinforced Elastomeric Expansion Joint

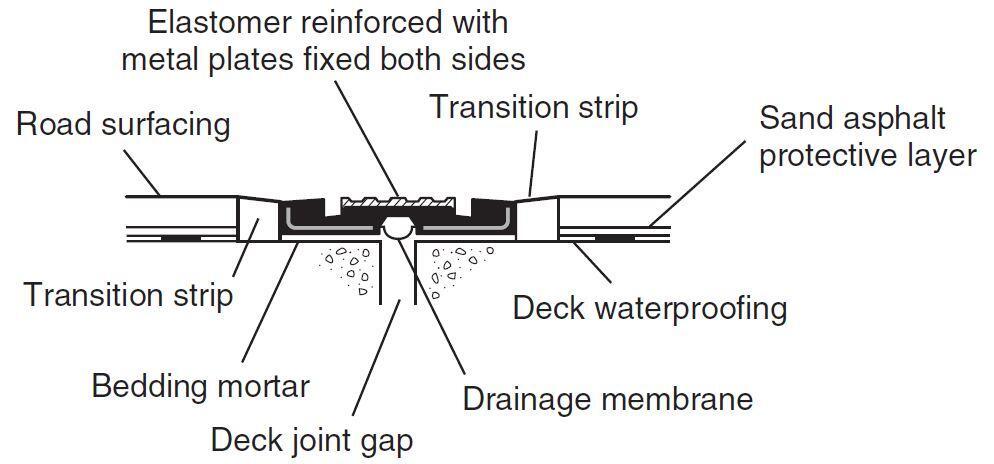
This joint consists of a prefabricated segmental joint of neoprene rubber with reinforcing angles and plates. It is bolted down to the concrete and epoxy resin mortar nosing transition strips protect the adjacent surfacing. There are various sizes giving movement range of up to ±165 mm.

Reinforced elastomeric joint
Figure 6: Reinforced elastomeric expansion joint (Reid et al, 2008)

Elastomeric in Metal Runners Expansion Joint

In this type of expansion joint, an elestomeric seal is fixed between two metal runners cast into recesses in the abutment and deck concrete. By introducing intermediate runners, multi-element joints can be provided (as illustrated) with greater capacity. As an alternative the rails can be embedded in a resin bonded to the concrete or a rubber element bolted to the concrete.

Elastomeric in metal runners
Figure 7: Elastomeric in metal runners expansion joint (Reid et al, 2008)

Movement range:
Single element up to 80 mm (±40 mm)
Multi-element up to 960 mm (±480 mm)
Embedded up to 150 mm (±75 mm)

Cantilever Comb or Tooth Expansion Joint

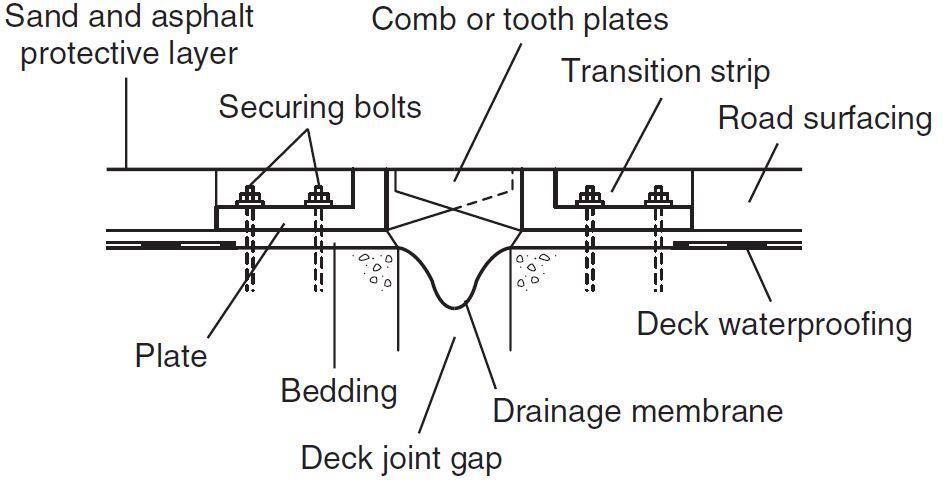
Cantilever comb or tooth
Figure 8: Cantilever comb or tooth expansion joint (Reid et al, 2008)

In this type of expansion joint, a prefabricated joint in which metal comb or tooth plates slide back and forth between each other across the gap. They are bolted down to the concrete and a drainage membrane is provided underneath to collect water. The movement range is typically up to 600 mm (±300 mm).

A variety of factors will influence the selection of the type of expansion joint for bridges. On an individual joint, different types of joints should not be mixed, and this will often define the type of maintenance work performed on an existing joint. For novel applications, the joint must clearly be able to accommodate the anticipated movements, but there are other factors to consider when evaluating the joint’s performance.

The treatment of the verges and footways, which may contain a variety of services, the road alignment (gradient, cross-fall, and curvature), the vicinity of junctions (where longitudinal loads will be more common), and how heavily trafficked the joint will be are all factors to consider. All of these factors can affect the performance and hence the life of an expansion joint, and they must be considered when calculating the total cost of the joint.

Design of Expansion Joints in Bridges

In the UK, BD 33 specifies the design loads and movements for expansion joints (Highways Agency, 1994a). Expansion joints in bridges should be designed for both serviceability and ultimate limit states to ensure that they function well without requiring unnecessary maintenance and that they can withstand ultimate design loads and movements.

For vertical loads, BD 33 specifies a 100kN single wheel load or a 200kN single axle load with a 1.8m track, as well as an 80 kN/m horizontal load. Vertical loads at the ultimate limit state (ULS) and serviceability limit state (SLS) have partial load factors of 1.50 and 1.20, respectively, whereas horizontal loads have partial load factors of 1.25 and 1.00. There are two key elements to remember.

In the Eurocodes, it is important to determine the traffic loads and combinations on expansion joints for (quasi-) static assessment at Ultimate Limit State and, where requested at Serviceability Limit State, and fatigue loads and relevant conditions for assessment of seismic behaviour. It shall be used in combination with pre-stressing, imposed deformations, dead loads and seismic loads.

Furthermore, it is important to verify and guarantee;

  • The movement capacity,
  • The water tightness,
  • The drainage capacity,
  • The content, emission and/or release of dangerous substances.

The vertical and horizontal loads for design of expansion joints are derived from EN 1991-2, 4.3, Load Model 1. Only tandem systems TS apply, not the uniformly distributed loads (UDL) as they are not relevant for the expansion joints. The selected position(s) of the axle loads shall be such that they produce the most adverse load effect on the underlying structure between the kerbs. This may result in several load cases with different positions.

First, the supporting structure should be designed to sustain the above loads. Second, to the above loads should be added those resulting from strains developed in the joint fillers over their design range of movement.

expansion joint maintenance
Figure 9: Maintenance works on a bridge expansion joint

At both ULS and SLS, calculation of movements are based on partial load factors of unity. Joint movements can come from a variety of sources, and they should all be added up to get a total movement range from which to choose a joint type. Because not all movements are reversible, it is desirable to analyse and establish limitations for both the closure and opening of the joint, rather than just the overall range of movement, because it is unclear if movements in either direction balance.

Temperature changes are determined by the effective bridge temperatures experienced by the deck and should be assessed in line with the applicable bridge design standard. Irreversible movements are caused by concrete creep and shrinkage, and they must be assessed using concrete or composite bridge design standards.

On curved or skew bridges, lateral movement of the joint should be considered because it can alter the joint design. Movements can be caused by settlement of supports, as well as sway of the bridge under longitudinal braking or traction stresses, depending on the articulation of the bridge. Rotation of the deck ends under live load on bridges with flexible or deep decks can produce significant displacement at the joint level. This explains why even a joint located above a fixed bearing will move. Installing the expansion joint as late as possible, after the majority of permanent movements have already occurred, avoids a comparable impact for permanent loads.

Drainage of Expansion Joints

Expansion joints rarely fail because their maximum movement capacity is surpassed. This is ensured by partial factors of safety embedded into their design. Because they are locally subjected to higher than expected stresses, parts of joints may deteriorate more quickly on occasion, maybe due to increased dynamic influences on wheel loads induced by uneven pavement.

Water leaks through the joints is usually the main cause of failure. This can be caused by inadequate joint details, poor installation technique, or just the inherent challenge of completely sealing any junction between two pieces moving relative to each other. Water management on the bridge deck is critical to an expansion joint’s success, and it should be addressed early in the design process rather than as an afterthought.

drainage
Figure 10: Typical drainage for a bridge expansion joint

While every effort should be made to make expansion joints waterproof, there is always the possibility of water from the surface leaking through the joint over time. It is usual practice to install a drainage system beneath the deck joint gap to collect water that leaks through the expansion joint. This system should allow for easy inspection and maintenance, as well as discharge into a proper road drainage system or soak away.

Before it reaches the expansion joint, water coming through the surfacing and running along the waterproofing should be collected and discharged through a subsurface drainage system.

Detailing of Expansion Joints

Good expansion joint details will go a long way toward making the joint low-maintenance and functional. A variety of regulations relating to bridge user safety are included in the Highways Agency document BD 33. Any open gap not bridged by a load-bearing part, for example, shall not be wider than 65 mm, and no gaps are allowed where pedestrians have access to the bridge.

A loadbearing seal or a cover plate can be used to solve this problem. Cover plates should be contoured and positioned in shallow recesses in the footway to prevent slipping. On one side of the joint, they are bolted, but on the other, they can slide. These plates are normally 12mm thick since they must withstand inadvertent wheel stresses. Over the parapet string course, thinner cover plates are frequently installed to hide what would otherwise be an open expansion junction.

At these potentially impact-prone locations, kerb cover plates should be provided to protect the expansion joint. To guarantee that cyclists may ride through tooth-and-comb joints where the gaps are oriented generally in the direction of traffic, extra care must be exercised during the installation.

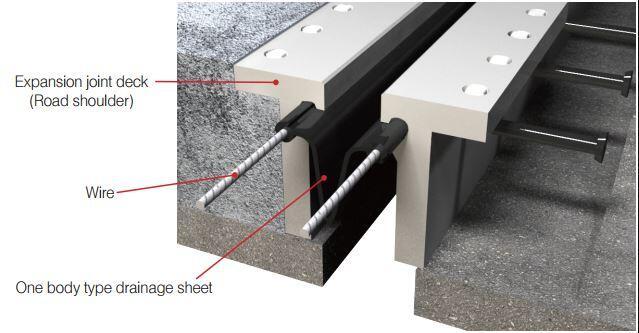
expansion jont details
Figure 11: Typical construction details of a bridge expansion joint

It’s also vital to describe any services that pass through expansion joints, and the need to accommodate services may well decide which of the aforementioned alternatives for detailing joints in verges is used. Certain couplings require specific clearances to any service ducts, which should be examined. Service ducts should be sufficiently spaced to allow for the flow of joint material around them as well as the placement of fixings between ducts.

Installation and maintenance

Faulty installation and inferior materials are two of the most common causes of expansion joint failure. When installing expansion joints, take care and follow the manufacturer’s instructions. Trained workers should be used, with special attention paid to identified weak spots such the interaction with the bridge deck waterproofing.

Bridge expansion joints should be inserted as late as feasible in the construction process to allow for shrinkage, creep, and settlement movements to occur before the expansion joint gap is filled.

Expansion joints should be built such that all wearable pieces can be replaced or reset quickly, ideally during off-peak hours. Joints should be inspected regularly to ensure that they are still functioning correctly and have not blocked up or leaked. Because of the dangers of allowing water to spill onto other bridge parts, any blocked drainage should be cleaned as soon as possible. To avoid the transmission of excessive stresses across the joint, and silting up of joints must be cleaned.

Reference
Reid I. L. K., Thayre P. A., Jenkins D. E., Broom R. A. and Grout D. J. (2008): Bridge Accessories in ICE Manual of Bridge Engineering (Institution of Civil Engineers) doi: 10.1680/mobe.34525.0553.

Design of Stepped Foundation

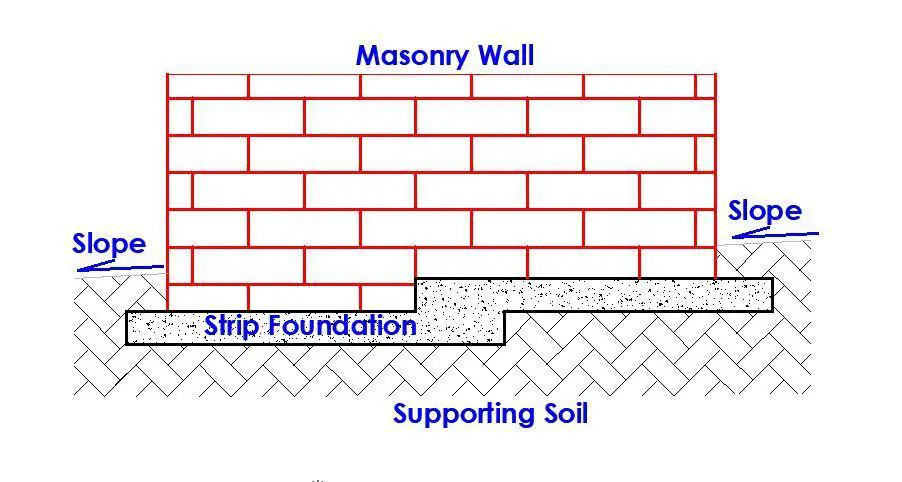
Strip foundations do not have to be at the same level throughout the building when it is built on sloping terrain. The foundation can be stepped as shown in Figure 1. For the strip foundation of duplexes and commercial buildings, it is also very common to step down the foundations, even though sometimes, it is not properly done. Therefore stepped foundation is fairly common in building construction.

Stepped foundation
Figure 1: Stepped foundation on a sloping ground

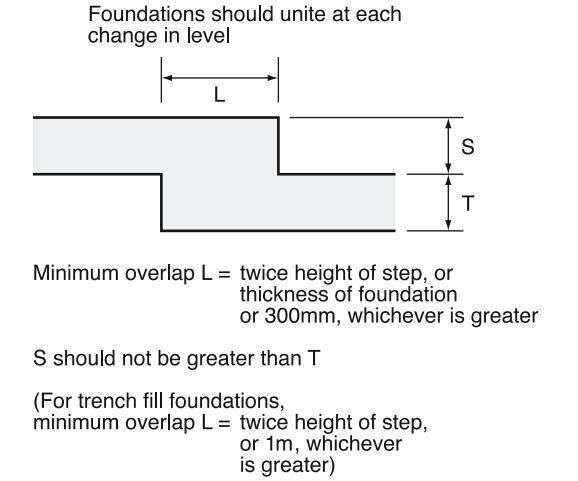
Strip foundations can also be stepped to follow any undulations in the bearing stratum if they are laid below a surface layer of infill or poor soil on to the underlying bearing stratum. Figure 2 shows the BS 8103 standards for a regular strip foundation. Unless extra precautions are taken, the step should not be higher than the thickness of the foundation. Foundation stepped on elevation should overlap by twice the height of the step, the thickness of the foundation, or 300 mm whichever is greater.

stepped foundation
Figure 2: Recommended construction practice for normal stepped foundation

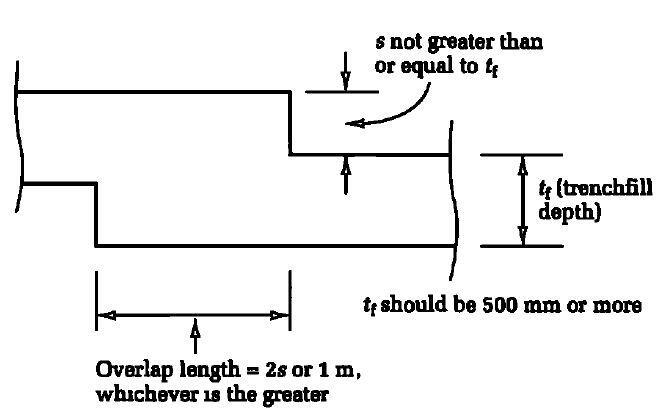
The heights of steps in deep trench fill foundations (Figure 3), require special consideration and it might be advisable to introduce reinforcing bars to prevent cracking at the steps. For a trench fill foundation, the overlap should be twice the height of the step or 1m, whichever is greater. Steps should not be thicker than the thickness of the foundation.

stepped foundation in narrow strip
Figure 3: Recommended construction practice for trench fill foundation
building on a stepped foundation
Figure 4: Building on a stepped foundation
stepped strip foundation
Figure 5: Masonry wall on a stepped foundation

Requirements for thickness

In a lightly loaded strip foundation, the thickness of concrete is typically equal to the projection from the face of the wall or footing, with a minimum thickness of 150 mm. This minimum is required to provide the rigidity that allows the foundations to bridge over loose spots in the soil and resist longitudinal stresses caused by thermal expansion and contraction as well as moisture movement in the footing walls. Swelling pressures on clay soils can be extremely high.

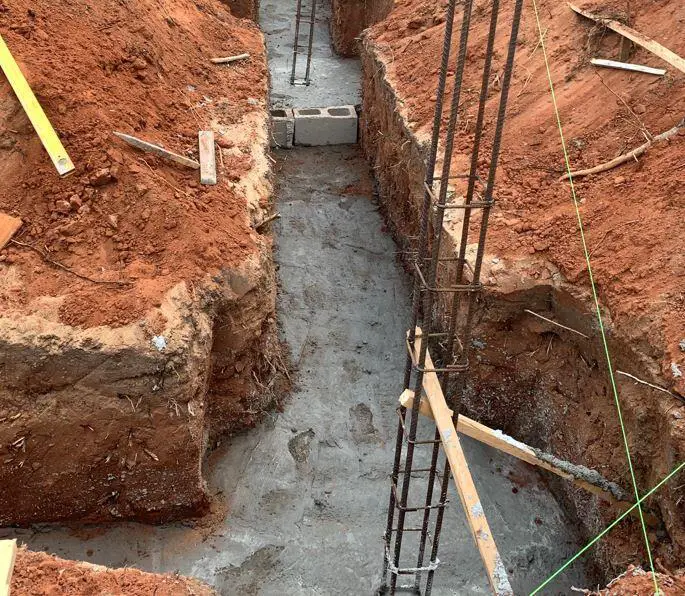
stepping down of foundation
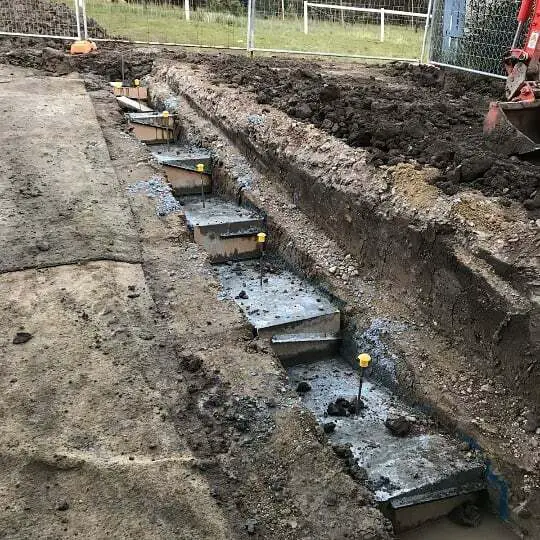
Figure 6: Typical stepping down of foundation on a construction site

The Cost of Laying Blocks in Nigeria

Sancrete blocks are popular precast masonry units that are used in the construction of residential, commercial, and industrial buildings in Nigeria. They are usually produced using sharp sand, limestone Portland cement, and water. In some cases quarry dust (stone dust) is added to the mix to increase the strength and density. This article discusses the cost of laying blocks in Nigeria.

Sandcrete blocks are usually produced as either hand-moulded or machine-vibrated. Commercially, these two types of blocks are priced differently, as the latter is deemed more quality and stronger. Furthermore, sandcrete blocks appear in a variety of sizes such as 225 mm (9 inches), 150 mm (6 inches), 125 mm (5 inches) and 100 mm (4 inches). They can be solid or hollow depending on the desired use.

Sandcrete blocks can be used as load bearing walls, or as partition elements in buildings. For the construction of bungalows and fences, smaller sizes of sandcrete blocks such as 6 inches (150 mm) and 5 inches (125 mm) are usually employed. They are also sometimes used for minor partitioning of toilets, stores, laundry rooms, etc in duplexes and commercial buildings. However, it is more common to see 9 inches hollow blocks used in the construction of duplexes in Nigeria.

4 inches hollow block
Laying of blocks using 4 inches block

The Standard Organisation of Nigeria (SON) has a document that provides the specification for both the manufacture and use of sandcrete blocks in Nigeria (NIS 87:2004). The standard requires that the mean compressive strength obtained from a set of five (5) blocks of 225mm (9 inches) and 150mm (6 inches) wide blocks must not be less than 3.45 N/mm2 and 2.5 N/mm2 respectively. The standards further state that the compressive strength of individual load bearing blocks shall not be less than 2.5 N/mm2 for machine-compacted blocks (NIS 87:2004).

These values are higher than the minimum requirements of 1.75 N/mm2 by the Nigerian National Building Code (2006) for individual block, and 2.0 N/mm2 by the British Standard for non-load bearing walls.

Cost of laying blocks in Nigeria
Typical block work in Nigeria

The cost of laying blocks in Nigeria varies from location to location and the level of complexity involved. Blocks are laid by skilled masons or bricklayers who must be paid according to the agreement reached before the commencement of the work. Each mason/bricklayer usually has a minimum of one service labourer who provides him with mortar, blocks, and assists him throughout the duration of the work.

See also…
Cost of plastering a house in Nigeria

Typically, for an average daily job man who has no permanent employment contract with a construction company, the wages for laying blocks are usually determined by;

(a) Daily pay (minimum number of hours)
(b) Output (number of blocks laid)

Daily Pay

In a daily pay contract, the mason is entitled to a fixed amount of money at the of the day. The work hours are usually from 8:00 am to 5:00 pm (8 hours of work). Currently, the rate varies from ₦ 5000 to ₦ 8000 per day depending on the location and the complexity of the work. Currently, the wages of the service labourer will usually be between ₦ 2000 to ₦ 4000 per day. Under normal circumstances, it is expected that the mason will lay a minimum of 100 blocks per day.

Daily pay type of contract is suitable for small jobs or jobs where extreme carefulness is required such as block wall setting out and forming.

Pay based on output (counting)

In this type of contract, the mason is paid based on the number of blocks he lays per day. The cost per block can vary between ₦ 30 (thirty Naira) to ₦ 70 (seventy Naira) depending on the size of the block and the complexity of the work. Jobs that require scaffolding (work at height) is usually priced higher than jobs that do not require scaffolding. When block work contract is done based on counting, it is either the mason will pay his service labour (the price is negotiated) or the client pays the service labour.

Cost of Laying Blocks in Nigeria (For Bill of Quantity)

Let us evaluate the average cost of laying one square metre of sandcrete block wall in Nigeria. Currently, the cost of one unit of 9 inches block in Nigeria is ₦ 350.

Therefore, for one square metre of block wall, the cost of blocks is ₦ 3,500
Cost of sand for mortar required per square metre of wall = ₦ 255
Cost of cement for mortar required per square metre of wall = ₦855
Cost of labour per square metre of wall = ₦ 900
Total = ₦ 5510 per square metre of wall

Therefore currently, the cost of building one square metre of 9 inches hollow block wall in Nigeria is ₦ 5,510 (Five thousand, five hundred and ten Naira), ignoring the contractor’s profit and overhead.

Alkali-Silica Reaction in Concrete

Some substances in aggregates can react with alkali hydroxides in concrete. It is only when this reactivity causes large expansion in the concrete it is deemed dangerous. There are two types of alkali-aggregate reactivity (AAR):

  1. Alkali-silica reaction (ASR), and
  2. Alkali-carbonate reaction (ACR).

Because aggregates containing reactive silica minerals are more common in concrete, alkali-silica reaction is of greater concern than alkali-carbonate reaction. Alkali-reactive carbonate aggregates have a unique composition that is not found in many other materials. Since the late 1930s, alkali-silica reactivity has been identified as a potential source of concrete distress. Alkali-silica distress in structural concrete is uncommon, despite the presence of potentially reactive aggregates across North America. This is due to a variety of factors:

  • Aggregates with good performance are plentiful in many places, and most aggregates are chemically stable in hydraulic cement concrete.
  • The majority of in-service concrete is dry enough to prevent ASR.
  • Certain pozzolans or slags can be used to control ASR.
  • The alkali concentration of certain concrete combinations is low enough to prevent damaging ASR
  • Some types of alkali-silica reaction do not cause considerable detrimental expansion.

Understanding the ASR mechanism, effectively performing tests to detect potentially reactive aggregates, and, if necessary, taking efforts to decrease the possibility for expansion and subsequent cracking are all required to reduce ASR potential.

Alkali-Silica Reaction (ASR)

A network of cracks, blocked or spalled joints, relative displacements of different components of a building, or pieces breaking out of the concrete surface (popouts) are all common symptoms of alkali-silica reaction in concrete. The risk of catastrophic failure is however low because ASR deterioration is slow. Alkali-silica reaction, on the other hand, might produce serviceability issues and increase other deterioration mechanisms, such as those caused by frost, deicer, or sulphate exposure.

dam affected by alkali silica reaction 1
Figure 1: Dam affected by alkali-silica reaction in Norway

Mechanism of Alkali-Silica Reaction

The alkali-silica reaction produces a gel that expands as it absorbs water from the cement paste around it. ASR’s reaction products have a strong affinity for moisture. These gels can cause pressure, expansion, and breaking of the aggregate and surrounding paste by absorbing water. The reaction can be broken down into two steps:

  1. Alkali hydroxide + reactive silica gel → reaction product (alkali-silica gel)
  2. Gel reaction product + moisture → expansion

The amount of gel created in concrete is determined by the amount and kind of silica used, as well as the concentration of alkali hydroxide. The presence of gel does not always imply distress in concrete, and hence the presence of gel does not always imply damaging ASR.

Factors Affecting Alkali-Silica Reaction

The following three conditions must be present for the alkali-silica reaction to occur:

  1. reactive forms of silica in the aggregate,
  2. high-alkali (pH) pore solution, and
  3. sufficient moisture.

ASR cannot occur if one of these conditions is not met.

Identification Test Methods for Distress due to ASR

It is important to distinguish between the damage caused by the reaction, and the reaction itself. A gel product will almost certainly be discovered in the diagnosis of concrete deterioration. However, considerable volumes of gel can accumulate without causing concrete damage in some circumstances. The existence of harmful ASR gel must be confirmed in order to designate ASR as the cause of damage.

An aggregate particle that is recognisably reactive or potentially reactive that is at least partially replaced by gel is described as a site of expansive reaction. Gel can be found in cracks and voids, as well as in a ring that surrounds an aggregate particle’s edges. Cracking caused by ASR is nearly often shown by a network of interior fissures linking reacted aggregate particles. The most reliable approach for detecting ASR gel in concrete is a petrographic study. Petrography can confirm the existence of reaction products and confirm ASR as the underlying cause of degradation when used to investigate a known reacted concrete.

Control of Alkali-Silica Reaction in New Concrete

The easiest approach to prevent ASR is to take proper precautions before pouring concrete. To address ASR, standard concrete specifications may need to be modified. To prevent limiting the concrete producer’s possibilities, these alterations should be carefully customised. This allows for a thorough examination of cementitious materials and aggregates, as well as the selection of a control plan that balances effectiveness and cost. There are no extra criteria if the aggregate is not reactive based on past identification or testing.

Identification of Potentially Reactive Aggregates

The easiest way to assess an aggregate’s susceptibility to alkali-silica reaction is to look at its field performance history. The concrete should have been in use for at least 15 years for the most accurate assessment. Comparisons should be performed between the mix proportions, constituents, and service settings of existing and projected concrete. This procedure should reveal whether unique requirements are required, whether they are not required, and whether aggregate or work concrete testing is required.

For preliminary screening, newer, faster test methods can be used. Longer testing can be performed to confirm results where there are uncertainties. Some of the different test procedures for evaluating possible alkali-silica reactivity are;

  • ASTM C 227: Potential alkali reactivity of cement-aggregate combinations (mortar-bar method)
  • ASTM C 289: Potential alkali-silica reactivity of aggregates (chemical method)
  • ASTM C 295: Petrographic examination of aggregates for concrete, etc

These tests should not be used to rule out the use of potentially reactive aggregates; reactive aggregates can be used safely with appropriate cementitious material selection, as explained below.

Materials and Methods to Control Alkali-Silica Reaction

Designing combinations particularly to limit ASR, ideally utilising locally available materials, is the most effective approach of controlling expansion owing to ASR. The following options are not in any particular sequence of importance, and they can be used in conjunction with one another.

In North America, current procedures include controlling the alkali content of the concrete or using a supplemental cementitious ingredient or blended cement shown by testing to control ASR. Fly ash, powdered granulated blast-furnace slag, silica fume, and natural pozzolans are examples of supplementary cementitious materials. Slag, fly ash, silica fume, and natural pozzolans are used in blended cements to control ASR.

The use of low-alkali portland cement (ASTM C 150) with an alkali concentration of less than 0.60 percent (equivalent sodium oxide) has been successful in the control of ASR in aggregates that are marginally reactive to moderately reactive. Low-alkali cements, however, are not accessible everywhere. For controlling ASR, it is preferable to use locally accessible cements in combination with pozzolans, slags, or mixed cements. When pozzolans, slags, or mixed cements are used to control ASR, tests like ASTM C 1260 (modified) or C 1293 must be employed to determine their effectiveness.

Reduction of alkali-silica reaction using pozzolans
Figure 2: Influence of different amounts of fly ash, slag, and silica fume by mass of cementing material on mortar bar expansion (ASTM C 1260) after 14 days when using reactive aggregate

Different amounts of pozzolan or slag should be tested to establish the best dosage, if applicable. As the dosage of pozzolan or slag is increased, expansion normally decreases (see Figure 2). ASR can also be controlled with lithium-based admixtures. Limestone sweetening (changing around 30% of the reactive sand-gravel aggregate with crushed limestone) is useful in preventing concrete deterioration in various sand-gravel aggregate concretes.