8.7 C
New York
Wednesday, September 18, 2024
Home Blog Page 2

How to Prepare for Construction Excavation Works

In civil engineering works, excavation is the process of removing soil and rock from a designated area. It is an important aspect of building foundation construction or road works in most construction projects. Excavation works prepare the site for the construction of buildings, roads, utilities, basements, and various other structures.

The soil profile at a virgin construction site can be generally divided into:

(a) Topsoil (vegetable soil), and
(b) Subsoil

The topsoil of any virgin site is mineral in origin. However, it contains a very high proportion of organic matter as well as bacteria, insects and other creatures such as worms. As a result, they are not suitable for construction and are often removed, and discarded away from the site. Generally, the layer of topsoil is usually fairly uniform at around 200mm where the ground has been cultivated, down to around 100–150 mm for naturally occurring land with good vegetable growth.

The subsoil layer lies below and has no organic constituents in its makeup, although it might be home to living creatures that burrow below the topsoil. However, the subsoil is of interest to civil engineers and is usually used to support buildings, roads, bridges, towers, etc. Therefore, excavation works usually extend to the subsoil.

Many forget that excavations can be extremely dangerous and difficult jobs that can lead to huge complications if not done properly. Even though many underestimate its importance, you need some guidance on how to prepare for it and what to focus on in order not to encounter unnecessary problems. However, this is something you cannot avoid if you want to do any type of construction project. This article provides a step-by-step guide to help you go through this stage without any stress or worry.

AD 4nXdp1i4ySvQV9wlarkNKj0qPId8ldmSOkdKCDdZCfFNjc8ei b4E8oIl0uYiOp8gTMWHhecctxxoMazYmUCV2jVYG4bzmPX8fEDai7flLOwOaesqUUzBoHAP5cw4q QzHv8sqLc1gFIqtycosajdaknSMpo?key=nBJNAPzmG S0d keDAlEDg

Before the Commencement of Excavation

Before excavation commences, meticulous groundwork must be done on the site to ensure a seamless and efficient excavation. This preparatory phase encompasses several critical steps:

  1. Site Survey and Planning: A thorough site survey identifies underground utilities, potential hazards, site levels/topography and soil characteristics. This information guides the selection of the excavation method, and shoring systems (if needed), and determines the safe working depth. Plans outlining traffic management, stockpiling locations, and spoil removal routes are also established.
  2. Demolition and Clearing: Existing structures or vegetation within the excavation footprint may need to be removed. This could involve controlled demolition, careful tree removal, or surface clearing depending on the site conditions. Permit requirements and environmental considerations are addressed during this stage.
  3. Establishment of Datum and Site Levels: The establishment of the datum and site levels sets the reference points for all subsequent measurements, ensuring a structurally sound and level building. The datum, often referred to as a benchmark, acts as a fixed horizontal reference point with an assigned elevation. This elevation can be chosen arbitrarily or tied to a national survey network for larger projects.

    Site levels are then determined relative to this datum. This is typically achieved using surveying instruments like levels and staffs to measure and mark out critical elevations on the site, such as finished floor levels, foundation depths, and column base heights. Establishing these reference points early on provides a consistent and precise foundation for the entire construction process.
  4. Foundation Setting Out: Building setting out, also referred to as setting out or site layout is an important step in any construction project. It involves transferring the architectural plans and dimensions from paper to the actual building site. This process meticulously establishes the precise location and layout of the foundation, walls, columns, and other structural elements. They must be established before excavation work can commence.

Methods of Carrying out Excavation

There are different approaches to carrying out excavation works. However, it is important to point out that the chosen method depends on several factors such as the project scale, site conditions, soil type, and depth of excavation.

Project size and complexity: Larger projects often require mechanical excavation for efficiency, while smaller projects might utilize manual methods. If the extent to be excavated is very large, the manual method of excavation may become very tasking and time-consuming.

Site conditions: Soil type, presence of groundwater, and existing structures all influence the chosen technique. Hard rock necessitates specialized methods, while loose soil might be suitable for mechanical excavation.

Depth of excavation: Deeper excavations require more robust shoring systems and may influence the choice of equipment.

Cost and schedule: Balancing cost-effectiveness with project timelines is also an important factor to be considered.

Environmental regulations: Some methods, like trenchless excavation, might be preferred in environmentally sensitive areas.

Here’s a breakdown of common excavation techniques used in building construction:

1. Manual Excavation: Manual excavation is suitable for small-scale projects, or where there is limited space, or delicate work around existing structures. The process involves the use of hand tools like shovels, picks, and wheelbarrows for digging and transporting soil. It is cost-effective for small jobs and allows for more precise control in tight spaces. However, it is labour-intensive, slow, and limited to shallow depths due to safety concerns.

Manual excavation of strip foundation in Nigeria

2. Mechanical Excavation: This category encompasses a variety of machines employed for faster and more efficient excavation on larger projects.

  • Excavator: The most versatile machine, with a hydraulic arm and bucket for digging, loading trucks, and backfilling. Different-sized excavators are available for various project scales.
The excavator is the most versatile machine for excavation works
  • Loader: Similar to a tractor with a front bucket, ideal for loading loose soil from the excavation pit into trucks or stockpiles.
  • Bulldozer: Equipped with a large blade for pushing and levelling large amounts of soil, often used for initial site clearing or bulk excavation.
  • Backhoe: Combines a digging bucket and a loading arm, making it suitable for trenching and smaller excavation jobs.
  • Scrapper: A self-loading hauling machine with a scraper blade that excavates, transports, and dumps large quantities of earth over short distances.

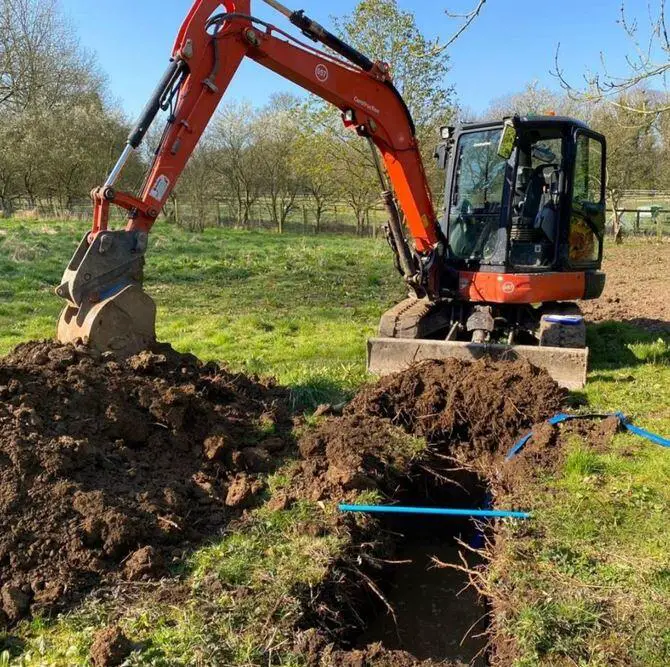
3. Trench Excavation: Trench excavation is when narrow strips of soil are excavated. It is suitable for installing underground utilities like pipes, cables, or conduits. The process typically involves digging a narrow, linear ditch using machinery or manual labour, depending on the depth and project scale. Shoring systems are often required to maintain trench stability and prevent cave-ins. Trenching is a high-risk activity, therefore proper shoring, maintaining a safe entry/exit angle, and having a rescue plan in place are crucial.

manually excavated trench
Manually excavated strip foundation

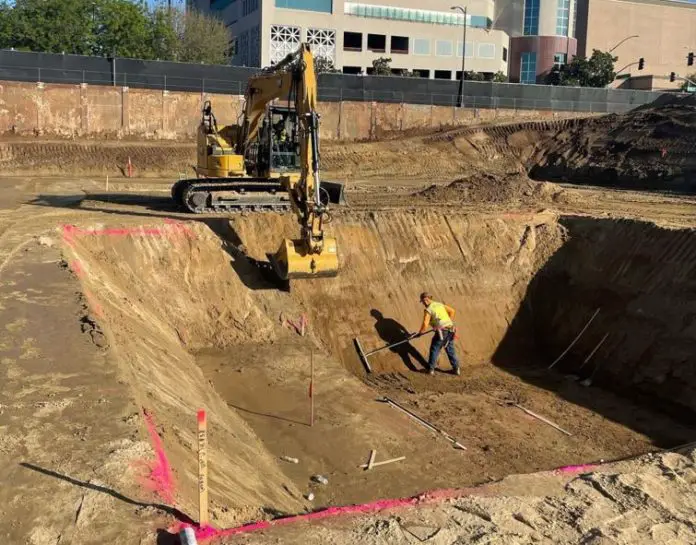
4. Basement Excavation: Basement excavation is carried out to create a basement level below the natural ground surface. The process requires digging a deep pit, often utilizing mechanical excavation equipment. Shoring techniques or the utilisation of braced cuts like sheet piles, soldier piles, or lagging are frequently used to ensure the stability of surrounding structures and prevent soil collapse.

Alternatively, the sides of the excavation may be sloped to increase the stability.

basement
The sides of a basement excavation can be sloped to increase the stability

5. Rock Excavation: Rock excavation is suitable for sites with hard rock formations that cannot be removed with conventional machinery. Specialized techniques like blasting or mechanical rock breaking with hydraulic hammers mounted on excavators are employed. Blasting requires careful planning and execution to minimize risks and comply with local regulations.

6. Trenchless Excavation: Trenchless excavation is employed when there is a need to minimise surface disruption, or when working under existing structures or environmentally sensitive areas. Various methods exist for trenchless excavation such as horizontal directional drilling (HDD), pipe bursting, and vacuum excavation. These techniques utilize specialized equipment to create underground passages without traditional open excavation.

Timbering/Shoring Foundation Excavations

Timbering or shoring is a term used to cover temporary supports to the sides of excavations and is sometimes called planking and strutting. For deep excavations, appropriately designed braced cuts will be required. In a construction site, timbering or shoring constitutes the temporary works of the project.

In clay or cohesive soils, vertical excavations can be self-supporting up to a depth known as the critical depth. The excavation is at risk of collapse once the depth of the excavation exceeds the critical depth. The critical depth depends on the shear strength and unit weight of the soil.

Typical temporary works for a deep excavation project

Generically, the sides of some excavations will need support to:

  • protect the operatives while working in the excavation;
  • keep the excavation open by acting as a retaining wall to the sides of the trench.

The type and amount of timbering required will depend upon the depth and nature of the subsoil. Over a short period, many soils may not require any timbering, but weather conditions, seepage, depth, type of soil and duration of the operations must all be taken into account, and each excavation must be assessed separately.

timbering in hard soils
Timbering in firm soil
timbering in wet loose soil
Timbering in loose wet soil

Simplified Guide to Successful Excavation Works

The following simplified checks must be carried out to ensure a hitch-free excavation programme.

Soil Testing and Site Plan 

Before doing anything else, make sure the soil is appropriate for the kind of construction you want to build there. This can be accomplished through rigorous site investigation and laboratory testing of soils. Keep in mind that soil can differ very much and that small negligence can lead to catastrophic results. When it comes to site planning and site surveying, always hire a professional to make sure everything is safe and that the topographical and geotechnical survey is reliable. 

Qualified Operators 

Always search for qualified operators to make sure everything is in order and to ensure they know what they are doing. Every operator needs to have something to prove their qualifications. For example, Excavator tickets Sydney are very important, as you need to go through some training to see whether you are actually able to perform such a job. This proof is necessary to know whether they are reliable or not and not to worry about any complications.

Necessary Permits

Many people make this mistake and start the excavation without actually making sure they have all the necessary permits and encounter delays and legal problems. These rules differ from place to place, but everywhere you need to submit the required documentation and plans to obtain an excavation permit. Once you do this, you don’t have to worry about any unnecessary legal complications and can continue without stressing out about it. 

Inform Public Utilities (Call Before You Dig)

This is also very important, as this way you can prevent any damage to underground utilities. Always contact them before you start any work and request that they mark the location of the underground lines that you can later use to plan the whole process without causing any problems. 

call before you dig

“Call Before You Dig” is a national program in the United States (and many other countries have similar initiatives) aimed at preventing underground utility line strikes during excavation projects. Before any excavation work, regardless of size or depth, property owners or contractors are required to contact a one-call centre in their area, typically by dialling the national number 811. This call initiates a process where the location of underground utilities (gas lines, electrical lines, water lines, etc.) within the designated excavation area will be marked by professional locators.

This service aims to safeguard people and property by promoting awareness of underground utilities before any digging commences. Striking a buried utility line can cause serious injuries, property damage, and service disruptions.

Focus on Safety

Once you have gone through all these steps and have made sure everything is ready for the excavation, make sure to implement safety measures at the excavation site to protect people from any injuries caused by improper signs. This way, you also keep any unauthorized people off the construction site, managing the safety of someone who doesn’t know how unsafe this can be. Also, always ensure the workers wear all the required safety pieces of equipment to avoid any tragic problems. 

Bottomline

Excavation is not as simple as it seems and demands careful planning and operation. With the help of this article, you know what you have to do to ensure the safety of both the workers and everyone around you and to make sure you follow all the legal obligations in order to avoid additional problems and shorten this whole process. 

Water Flow Through Earth Dams

The analysis of seepage behaviour (flow of water) within earth dams is an important aspect of the geotechnical design evaluation of such earth structures. Earth dams rely on their structural integrity to safely impound water. However, the flow of water through the pores of the earthen structure must be technically controlled.

An important aspect of the design involves ensuring that the pore pressure at the downstream toe of the dam remains sufficiently low to prevent instability and the exit gradient falls short of the critical value that could induce piping. Understanding and analyzing this flow, often referred to as seepage, is important for dam safety and optimal design.

The primary objective of seepage analysis lies in determining the location of the free water surface within the dam, commonly referred to as the phreatic surface (see Figure 1). By definition, the pressure head along the phreatic surface is zero.

image 27
Figure 1: Phreatic surface within an earth dam (Budhu, 2011)

Mechanisms of Water Flow

The primary mechanism governing water flow through earth dams is the hydraulic gradient. This gradient represents the difference in water pressure head between two points and dictates the direction and velocity of water movement. In the context of earth dams, the hydraulic gradient drives water from the upstream reservoir (high pressure) towards the downstream side (low pressure) through the pores and voids within the dam’s soil matrix.

The rate of water flow is directly proportional to the hydraulic gradient and the coefficient of permeability (k) of the dam material. Permeability is a measure of a material’s ability to transmit fluids and varies depending on the soil composition, grain size distribution, and void ratio. Finer-grained soils with smaller voids typically exhibit lower permeability, hindering water flow.

There are two main flow regimes within an earth dam:

  • Darcy’s Law flow: This regime governs flow at low hydraulic gradients. It is described by Darcy’s Law, which states that the seepage velocity (v) is equal to the product of the hydraulic conductivity (k) of the soil, the hydraulic gradient (dz/dx), and the effective porosity (n) of the material.
  • Dupuit-Forchheimer flow: At higher hydraulic gradients, nonlinear flow behaviour can occur due to turbulent effects. This regime is often approximated by Dupuit-Forchheimer’s equation, which incorporates additional terms to account for these nonlinearities.

Determination of Phreatic Surface

Casagrande (1937) proposed a method to approximate the phreatic surface (free water surface) within earth dams using a parabola with adjustments at entry and exit points (Figure 1). The centre of this parabola (focus, point F) is located at the downstream toe of the dam.

This initial, uncorrected parabolic representation is referred to as the “basic parabola.” Recalling the geometric definition, a parabola has the property where every point on its curve is equidistant to the focus (F) and a specific line called the directrix. To construct this basic parabola, three key elements are needed:

  1. Point A (location not explicitly defined here)
  2. Focus (F) at the downstream toe
  3. f (half the distance from the focus to the directrix)

Casagrande further recommended that point C, another point on the parabola, be positioned at a distance of 0.3 times the horizontal projection (AB) of the upstream slope at the water surface level. Based on the fundamental property of a parabola, the passage then leads into the subsequent calculations. From the basic property of a parabola, we get;

2f = √(b2 + H2) – b

The equation to construct the basic parabola is;

√(x2 + z2) = x + 2f

Solving for z, we obtain;

z2 = 4f(f + x) or
z = 2√f(f + x)
——– (1)

Since H and b are known from the geometry of the dam, the basic parabola can be constructed. We now have to make some corrections at the upstream entry point and the downstream exit point.

The abrupt change in geometry at the upstream end is addressed by introducing a transition curve (designated as BE) that seamlessly integrates with the underlying parabolic profile. The downstream end correction is contingent upon the angle designated as “b” and the specific discharge face configuration.

Casagrande (1937) established a methodology for determining the length (denoted as “a”) of the discharge face for a homogeneous earth dam lacking a drainage blanket at the discharge point, provided the angle “b” is less than 30 degrees. His approach is based on the validity of Dupuit’s assumption, which posits that the hydraulic gradient aligns precisely with the slope (dz/dx) of the phreatic surface.

To facilitate the analysis, we consider two vertical sections: section KM with a height of “z” and section GN with a height of “a sin b.” Thus, the flow rate traversing section KM…

qKM = Aki = (z × 1)k(dz/dx) ——– (2)

and across GN is;

qGN = Aki = (a sin β × 1)k(dz/dx) = (a sin β × 1)k tan β ——– (3)

From the continuity condition at sections KM and GN, qKM = qGN, we obtain:

z(dz/dx) = a sin β tan β ——– (4)

Integrating the equation within the limits x1 = a cos β and x2 = b, z1 = a sin β and z2 = H, we obtain;

a = 1/cosβ × [(b – √(b2 – H2cot2β)] ——– (5)

The flow through the dam is obtained by substituting Equation (5) into Equation (3), giving;

q = k sin β tan β × 1/cosβ × [(b – √(b2 – H2cot2β)]
= k tan2 β (b – √(b2 – H2cot2β)

homogenous earth dam with drainage filter
Figure 2: Earth dam with drainage filter

To mitigate the issue of high exit hydraulic gradients and potential piping problems, drainage filters are installed at the downstream toe of dams. As illustrated in Figure 3, a horizontal drainage blanket is positioned at the toe of the earth dam. The coarseness of the granular materials within the drainage blanket, along with the presence or absence of a filter fabric, dictates the control of seepage.

image 28
Figure 3: Earth dam with horizontal blanket at the toe (Budhu, 2011)

In dams incorporating drainage blankets, the phreatic surface is compelled to intersect the blanket, rather than the downstream dam face. Consequently, there is no requirement for modifications to the fundamental parabolic profile at the downstream end of the dam.

The flow through the dam is:

q =Aki = Ak(dz/dx)

Where dz/dx is the slope of the basic parabola and the area A = FJ = 1.0. From the geometry of the basic parabola, FJ = 2f, and the slope of the basic parabola at J is given by:

dz/dx = 2f/z = 2f/2f = 1.0

Therefore the flow through an earth dam with a horizontal drainage blanket is:

q = 2f × k × 1 = 2fk

Steps in drawing a phreatic surface through an Earth Dam

According to Budhu (2010), the following steps can be followed in determining the phreatic surface through earth dams:

  1. Draw the structure to scale.
  2. Locate a point A at the intersection of a vertical line from the bottom of the upstream face and the water surface, and a point B where the water line intersects the upstream face.
  3. Locate point C, such that BC = 0.3AB.
  4. Project a vertical line from C to intersect the base of the dam at D.
  5. Locate the focus of the basic parabola. The focus is located conveniently at the toe of the dam.
  6. Calculate the focal distance, f = (√(b2 – H2) – b)/2 where b is the distance FD and H is the height of water on the upstream face.
  7. Construct the basic parabola from z = 2√f(f + x).
  8. Sketch in a transition section BE.
  9. Calculate the length of the discharge face, a, using 1/cosβ × [(b – √(b2 – H2cot2β)] (where β ≤ 30 degrees)
  10. Measure the distance ‘a’ from the toe of the dam along the downstream face to point G.
  11. Sketch in a transition section, GK.
  12. Calculate the flow using q = ak sin β tan β, where k is the hydraulic conductivity. If the downstream slope has a horizontal drainage blanket, the flow is calculated using q = 2fk.

This procedure provides a framework for analyzing seepage flow through earth dams, incorporating both geometric considerations and material properties to estimate potential flow rates.

Mitigation Strategies

To ensure the stability and safety of earth dams, various strategies are employed to manage water flow:

  • Drainage blankets: These are coarse-grained materials placed at the downstream toe of the dam. They act as a collector for seepage water, lowering the exit hydraulic gradient and reducing the risk of piping. Filter fabrics are often used in conjunction with drainage blankets to prevent soil migration from the dam into the drainage layer.
  • Impervious cores: A core of low-permeability material, such as clay, can be placed within the dam’s central section to significantly reduce seepage flow through the dam itself.
  • Relief wells: These are vertical wells drilled downstream of the dam to intercept seepage water and lower the phreatic surface (water table) within the dam.
  • Seepage berms: These are compacted earth embankments constructed downstream of the dam to lengthen the seepage path and reduce the exit hydraulic gradient.

Sources and Citations
Budhu M. (2011): Soil Mechanics and Foundations (3rd Edition). Wiley and Sons Inc. USA
Casagrande A. (1937): Seepage through dams. J. N. Engl. Water Works Assoc., L1(2), 131–172.

Seismic Slope Stability Design: Newmark Sliding Block Analysis

The Newmark Sliding Block Analysis (Newmark, 1965) is an important tool for evaluating seismic slope stability. This method transcends traditional approaches by directly calculating the displacement a slope might experience during an earthquake. Slope failure is often characterized by the magnitude of this displacement, making the Newmark method a particularly useful and informative technique for seismic stability assessment.

Earthquakes pose a significant threat to earth slopes, potentially triggering landslides and catastrophic failures. To safeguard infrastructure and lives, engineers rely on sophisticated analytical tools to assess slope stability during seismic events. One such prominent method is the Newmark Sliding Block Analysis, a simplified dynamic approach that offers valuable insights into potential seismic displacements.

The Newmark Sliding Block Analysis employs a simplified approach to estimate the accumulated displacement a slope experiences during an earthquake. This method idealizes the ground behaviour as rigid-plastic. In essence, it assumes no relative movement occurs on the slope until the downslope ground acceleration surpasses the critical threshold defined by the slope’s yield acceleration.

Once this threshold is exceeded, the model postulates the slope accelerates downslope at a constant rate, determined by the difference between the ground acceleration and the yield acceleration. By performing a double integration of this constant acceleration over the entire earthquake duration, the analysis estimates the resulting displacement of the slope.

image 18

Seismic Loading on Slopes

Earthquakes generate ground motion, characterized by strong accelerations that can destabilize slopes. These accelerations can exceed the inherent shear resistance of the soil within the slope, leading to a loss of equilibrium and triggering a slide. The severity of the threat depends on various factors, including:

  • Slope Geometry: Steeper slopes are inherently more susceptible to failure.
  • Soil Properties: The strength and frictional characteristics of the soil material significantly influence its resistance to movement.
  • Seismic Intensity: The strength and duration of ground shaking play a critical role in determining the potential for slope failure.

The Newmark Sliding Block Approach

The Newmark Sliding Block Analysis simplifies a slope into a rigid block resting on a soil foundation. This idealized model assumes the slope remains stable until the ground acceleration (ag) exceeds a critical value known as the yield acceleration (ay). The yield acceleration represents the threshold at which the resisting forces within the soil are overcome, and the block begins to slide downslope.

The core concept of the Newmark method lies in calculating the accumulated displacement of the sliding block throughout the earthquake. This displacement is estimated by integrating the difference between the ground acceleration and the yield acceleration over time. The analysis typically employs a time-history record of ground acceleration from a seismic event or a representative design earthquake scenario.

The core concept of the analysis hinges on an analogy. As a slope undergoes failure, the displaced soil mass can be visualized as a rigid block sliding down an inclined plane. By establishing force equilibrium for this idealized block, Newmark’s method proposes a framework for predicting the permanent displacement a slope might experience under the influence of ground acceleration. This approach provides valuable insights into the potential behaviour of slopes during seismic events, aiding engineers in safeguarding infrastructure and lives.

image 15

Consider the force equilibrium of the block shown in the image above. The block is subjected to a horizontal inertial force, khW. Assuming the resistance to the sliding is only because of friction, and there is no cohesion, the factor of safety for the sliding is:

image 16

where:
𝜙 = friction angle,
𝛽 = inclination angle of the plane, and
kh = horizontal acceleration coefficient

The critical condition for sliding is FS = 1.0, which corresponds to a critical horizontal acceleration coefficient called the yield acceleration coefficient. The yield acceleration coefficient, ky, can be obtained by setting FS = 1.0 in the Equation above and solving for ky:

image 17

Accordingly, the yield acceleration is defined by:


ay = kyg


Displacement occurs when the force equilibrium is not satisfied, that is, when the actual acceleration exceeds the yield acceleration. By analyzing the acceleration, velocity, displacement, and duration of four earthquakes, Newmark (1965) proposed a conservative upper-bound permanent displacement, umax:

umax = (v2 max′/2ay) ⋅ (amax/ay)

where:
vmax = maximum velocity of ground motion,
amax = peak horizontal ground acceleration.

image 19

Solved Example

Ground motion data from the 2019 Ridgecrest, California, earthquake revealed a peak ground acceleration (PGA) of 0.47 g and a peak ground velocity (PGV) of 55.1 cm/sec. An adjacent earth embankment has the following parameters:

Height = 10 meters,
Slope inclination = 25 degrees
Unit weight of soil = 18 kN/m3
Cohesion of soil = 26 kN/m2,
Internal friction angle = 31 degrees.

Evaluate the permanent displacement of the slope using the Newmark sliding block method.

Solution
The problem statement gives:
Maximum velocity of ground motion: vmax = 55.1 cm/sec
Peak horizontal ground acceleration: amax = 0.47g

The yield acceleration coefficient can be approximated using Equation the equation;
ky = tan(𝜙 − 𝛽)
where: internal friction angle 𝜙 = 31, and the slope angle 𝛽 = 25.

So:
ky = tan(𝜙 − 𝛽) = tan(31 − 25) = 0.105
So ay = 0.105 g

The upper-bound permanent displacement of the slope is:
umax = (v2max′/2ay) ⋅ (amax/ay) = [(55.12/(2 × 0.105 × 981)] × (0.47g/0.105g) = 65.966 cm

Limitations of the Newmark Model

The Newmark block model might not be entirely accurate when analyzing slopes reinforced with elastic elements like geotextiles or ground anchors. A key assumption of the Newmark model is that a slope’s resistance to movement stays the same regardless of how far it moves. However, elastic support elements like anchors or reinforcement actually become stronger as they stretch further, which the Newmark model doesn’t account for.

Several advancements have been developed to address the limitations of the basic Newmark method:

  • Deformable Block Models: These models incorporate some degree of flexibility within the sliding block, providing a more realistic representation of slope behaviour.
  • Strength Dissipation: More sophisticated methods account for the potential decrease in soil strength during seismic loading, offering a more accurate assessment of slope stability.
  • Multi-Block Models: These models divide the slope into multiple blocks, allowing for a more sophisticated consideration of variations in soil properties and internal deformations.

Applications of Newmark Sliding Block Analysis

The Newmark Sliding Block Analysis serves as a valuable tool in various seismic design applications:

  • Preliminary Screening: The method provides a quick and efficient means to assess the overall stability of a slope subjected to seismic loading.
  • Design Parameter Selection: The analysis aids in selecting design parameters like reinforcement requirements for slopes based on the estimated seismic displacements.
  • Comparison of Scenarios: By analyzing different earthquake scenarios, engineers can evaluate the sensitivity of a slope to varying levels of seismic intensity.

Conclusion

The Newmark Sliding Block Analysis stands as a cornerstone methodology in seismic slope stability assessment. While acknowledging its limitations, engineers leverage its simplicity and effectiveness to gain valuable insights into potential seismic displacements. As the field of geotechnical engineering continues to evolve, advancements in analytical tools and a deeper understanding of soil behaviour will further refine our ability to safeguard slopes from the perils of earthquakes.

Analysis of Statically Indeterminate Arch Structures

Arches are captivating structural elements, renowned for their elegance and efficiency in spanning large distances. However, their analysis becomes more complicated when they possess additional internal supports or fixed ends, leading to statically indeterminate structures.

Arches can be constructed using a variety of materials such as reinforced concrete, steel, or timber. Reinforced concrete arch bridges offer a viable solution for bridge systems spanning large distances. Arches are occasionally employed in roof structures, but their primary use lies in bridges.

There is a spectrum of arch configurations to satisfy different design needs. These configurations can be broadly categorized by the number of hinges present:

  • Three-hinged arches: These arches possess the simplest support condition, with hinges at both ends and one at the crown. Three-hinged arch structures are statically determinate, which makes the analysis easier.
  • Two-hinged arches: These arches incorporate hinges at only two locations, typically at the supports. This additional constraint introduces static indeterminacy, requiring more advanced analysis techniques.
  • Fixed-end arches: These arches are rigidly connected to their supports, preventing rotations. This configuration offers superior load-carrying capacity but necessitates the most complex analytical methods due to static indeterminacy.

Arches can be further classified based on their geometric properties:

  • Symmetry: The arch can be symmetrical about its central axis, offering a balanced aesthetic and potentially simplified analysis. Conversely, unsymmetrical arches may be required for specific site constraints.
  • Alignment: An arch structure can be right-angled, following a straight line, or skewed, deviating from a straight path to accommodate topographical features.
  • Singularity or Repetition: An arch bridge may consist of a single arch or a series of interconnected arches, often employed for longer spans. These interconnected arches may exhibit a degree of mutual dependence in their load-carrying behaviour, requiring careful consideration during analysis and construction.

This article is focused on the structural analysis of statically indeterminate arch structures.

Statically Indeterminate Arch Structures

The figure below shows various configurations of statically indeterminate arches, comprising:

  • two-hinged arches with and without tie rods,
  • a one-hinged arch, and
  • an arch with fixed supports.
image 6
image 7
image 8

The force method in its canonical form is the most effective approach for analyzing statically indeterminate arches. The number of unknown variables in this method directly correlates to the number of hinges present in the arch:

  • Two-hinged arches: One primary unknown
  • One-hinged arches: Two unknowns
  • Hingeless arches (fixed ends): Three unknowns

In three-hinged arches specifically, the distribution of internal forces is heavily influenced by the shape of the neutral line (e.g., parabolic, circular). This characteristic must be factored into the calculation of unit coefficients and free terms within the canonical equations. In the general case, these coefficients and terms depend on bending moments, shear forces, and axial forces within the structure.

Notably, when calculating displacements, only bending moments in the arch itself and the axial force in any tie rod are considered, while shear and axial forces within the arch itself can be neglected.

The inherent curvature of the arch axis introduces limitations when employing the graph multiplication method, leading to approximate results. Unlike three-hinged arches, redundant arches (those with a higher number of unknowns than equilibrium equations) – akin to any statically indeterminate structure – experience internal forces due to factors beyond applied loads.

These factors include support displacements, temperature difference, and fabrication errors. In the case of masonry or concrete arches, concrete shrinkage must be specifically considered, as this material property contributes to the generation of additional stresses within the structure.

Steps in the Analysis of Indeterminate Arches

The procedure for analysis of statically indeterminate arches is as follows:

  1. Choose the primary system of the force method.
  2. Accept the simplified model of the arch, i.e., the arch is divided into several portions and each curvilinear portion is changed by straight member. Calculate the geometrical parameters of the arch at specified points.
  3. Calculate the unit and loaded displacements, neglecting the shear and axial forces in arch. Computation of these displacements may be performed using the graph multiplication method.
  4. Find the primary unknown using canonical equations of the force method.
  5. Construct the internal force diagrams.
  6. Calculate the reactions of supports and provide their verifications.

Solved Example

A two-hinged arch structure is loaded as shown below. Obtain the support reactions, bending moments, shear force, and axial force diagrams at the designated critical points (1, 2, C, 3 and 4). EI = Constant

image 9

Solution

A two-hinged arch is statically indeterminate to the first degree. A primary system can be obtained by removing one of the horizontal supports. The primary unknown X1 is therefore taken as the horizontal reaction at support A.

image 10


Geometrical properties of the arch
The ordinate (y) at any point along a parabolic arch is given by;

y = [4yc (Lxx2)] / L2
Where;
yc = Height of the crown of the arch from the base
L = Length of arch
x = Horizontal ordinate of interest
Hence, y = [4 × 8 (45xx2)] / 452

The general equation of the arch now becomes;
y = 0.7111x – 0.0158x2 ———- (1)

Differentiating equation (1) with respect to x
dy/dx = y’ = 0.7111 – 0.0316x ———— (2)

From trigonometric relations, we can verify that;
Sin θ = y’/[1 + (y’)2]0.5 —————- (3)
Cos θ = 1/[1+ (y’)2]0.5 —————- (4)

From the above relations, we can carry out the calculations for obtaining the geometrical properties of the arch structure.

Let us consider point A (support A of the structure);

Point A:
x = 0, and y = 0;
From equation (2) above, y’ = 0.7111;
Thus,
Sin θ = 0.7111/[1 + (0.7111)2]0.5 = 0.579
Cos θ = 1/[1 + (0.7111)2]0.5 = 0.815

Point 2:
x = 7.5m
From equation (1), y = 0.7111(7.5) – 0.0158(7.5)2 = 4.444 m;
dy/dx = y’ = 0.7111 – 0.0316(7.5) = 0.4741
Thus,
Sin θ = (0.4741)/[1 + (0.4741)2]0.5 = 0.4284
Cos θ = 1/[1 + (0.4741)2]0.5 = 0.903

For the entire arch structure, it is more convenient to set out the geometrical properties in a tabular form. See the Table below;

Point x (m)y (m)y’√[1 + (y’)2]sin θcos θ
A000.71111.2270.57950.815
17.54.4440.47411.10670.42840.903
2157.1110.23711.02770.23070.973
C22.58.0000.0001.0000.0001.000
327.57.606-0.15791.012-0.1560.988
4355.533-0.39491.075-0.3670.930
B450-0.7111.227-0.57950.815

The length of the chord between points n and n-1 equals;
ln,n-1 = [(xn – xn-1)2 + (yn – yn-1)2]

la-1 = [(7.5 – 0)2 + (4.444 – 0)2] = 8.7177 m
l1-2 = [(15 – 7.5)2 + (7.111 – 4.444)2] = 7.96 m
l2-c = [(22.5 – 15)2 + (8 – 7.111)2] = 7.5525 m
lc-3 = [(27.5 – 22.5)2 + (7.606 – 8)2] = 5.015 m
l3-4 = [(35 – 27.5)2 + (5.533 – 7.606)2] = 7.7812 m
l4-b = [(45 – 35)2 + (0 – 5.533)2] = 11.428 m

Analysis of Case 1 (Unit State)

X1 = 1.0

image 11

Mi = -1.0y
Qi = -1.0 sin θ
Ni = -1.0 cos θ

The internal stresses due to the unit state can be tabulated as shown below.

PointMQN
A0.00-0.597-0.815
1-4.444-0.4284-0.903
2-7.111-0.2307-0.973
C-8.0000.000-1.000
3-7.6060.1560.988
4-5.5330.367-0.930
B0.0000.597-0.815
Internal forces of the arch in the unit state

Loaded State;

image 12

Support Reactions
Let ∑MB = 0; anticlockwise negative
(Ay × 45) – (12 × 37.5) – (2 × 22.5 × 11.25)= 0
Therefore, Ay = 21.25 kN

Let ∑MA = 0; clockwise negative
(By × 45) – (12 × 7.5) – (2 × 22.5 × 33.75) = 0
Therefore, By = 35.75 kN

Let ∑Fx = 0;
Hence, Bx = 0

Internal Stresses

Bending Moment
MA = 0 (hinged support)
M1 = (21.25 × 7.5) = 159.375 kN.m
M2 = (21.25 × 15) – (12 × 7.5) = 228.75 kN.m
MC = (21.25 × 22.5) – (12 × 15) = 298.125 kNm

Coming from the right-hand side;

MC = (35.75 × 22.5) – (2 × 22.5 × 11.25) = 298.125 kNm
M3 = (35.75 × 17.5) – (2 × 17.5 × 8.75) = 319.375 kN.m
M4 = (35.75 × 10) – (2 × 10 × 5) = 257.5 kN.m
MB = 0 (hinged support)

Shear
Q = ∑V cosθ
QA = (21.25 × 0.815) = 17.318 kN
Q1L = (21.25 × 0.903) = 19.188 kN
Q1R = [(21.25 – 12) × 0.903)] = 8.352 kN
Q2 = [(21.25 – 12) × 0.973)] = 9.00 kN
QC = [(21.25 – 12) × 1.000)] = 9.25 kN
Q3 = [(21.25 – 12 – 2×5) × 0.988)] = -0.741kN
Q4 = [(21.25 – 12 – 2×12.5) × 0.930)] = -14.647 kN
QB = [(21.25 – 12 – 2×22.5) × 0.815)] = -29.136 kN

Axial
N = -∑V sinθ
QA = -(21.25 × 0.5795) = -12.314 kN
Q1L = -(21.25 × 0.4284 = -9.103 kN
Q1R = -[(21.25 – 12) × 0.4284)] = -3.9627 kN
Q2 = -[(21.25 – 12) × 0.2307)] = -2.134 kN
QC = -[(21.25 – 12) × 0.000)] = 0 kN
Q3 = -[(21.25 – 12 – 2×5) × -0.156)] = -0.117 kN
Q4 = -[(21.25 – 12 – 2×12.5) × -0.367)] = -5.780 kN
QB = -[(21.25 – 12 – 2×22.5) × -0.5795)] = -20.717 kN

The Table of the bending moment in the unit and loaded state are shown below;

PointM1 (unit state)Mp (loaded state)
A0.000.000
1-4.444159.375
2-7.111228.75
C-8.000298.125
3-7.606319.375
4-5.533257.5
B0.0000.000

The canonical equation for the structure is given by;

δ11X1 + ∆1P = 0

Computation of unit and loaded displacements

For the calculation of displacements, the Simpson’s formula can be employed. Unit and loaded displacements are;

image 13

where;
li is the length of the ith straight portion of the arch;
n number of the straight portions of the arch;
a1, aP ordinates of the bending moment diagrams M1 and MP at the extreme left end of the portion;
b1, bP ordinates of the same bending moment diagrams at the extreme right end of the portion; and
c1, cP are the ordinates of the same bending moment diagrams at the middle point of the portion.

Portionl/6E1a1c1b1apcpbpδ111P
A-11.4520.00-2.222-4.4440.00079.6875159.37557.351-2056.79
1-21.327-4.444-5.777-7.111159.375194.0625228.75270.456-9049.21
2-C1.259-7.111-7.555-8.000228.75263.4375298.125431.683-15073.65
C-30.8358-8.000-7.803-7.606298.125308.75319.375305.400-12078.03
3-41.297-7.606-6.569-5.533319.375288.4375257.5338.610-14828.46
4-B1.905-5.533-2.7660.000257.5128.750.000116.618-5427.797
Total1520.121/EI-58513.96/EI

δ11X1 + ∆1P = 0
1520.121X1 – 58513.96 = 0
X1 = 58513.96/1520.121 = 39.492 kN

X1 is the unknown horizontal reaction (thrust) at support A. The final bending moment, axial, and shear force values can be computed by following the first principle, or by applying the equations below;

Mf = M1X1 + M0
Qf = Q1X1 + Q0
Nf = N1X1 + N0

Final Bending Moment

PointM1 (unit state)M0 (loaded state)M1X1 + M0 (kNm)
A000
1-4.444159.375-16.127
2-7.111228.75-52.07
C-8298.125-17.81
3-7.606319.37518.99
4-5.533257.538.99
B000

Final Shear Force

PointQ1Q0Q1X1 + Q0 (kN)
A-0.59717.318-6.258
1L-0.424819.1882.411
1R-0.42848.352-8.56
2-0.23079-0.11
C09.259.25
30.156-0.7415.419
40.367-14.647-0.153
B0.597-29.136-5.559

Final Axial Force

PointN1N0 N1X1 + N0 (kN)
A-0.815-12.314-44.49
1L-0.903-9.103-44.76
1R-0.903-3.9627-39.62
2-0.973-2.134-40.55
C-10-39.49
30.988-0.11738.901
4-0.93-5.78-42.50
B-0.815-20.717-52.90

Software Applications

Due to the complexities involved in the analysis of indeterminate arch structures, structural analysis software plays a crucial role in practical applications. Popular software packages such as Staad Pro, SAP2000, RISA-3D, and Abaqus offer powerful tools for analyzing statically indeterminate arches. These software tools can handle a wide range of material properties, loading conditions, and geometric complexities, enabling efficient and accurate analysis.

Comparison of the Force and Displacement Methods of Structural Analysis

The analysis of structures involves the determination of the internal forces (stresses) and deformations (displacements) under various loading conditions. Internal stresses and displacements in frames and other structures are used for the proper design of civil engineering structures.

Two prominent approaches are used in the analysis of statically indeterminate structures: the force method and the displacement method. The force method is also called the method of consistent deformations, while the displacement method is called the stiffness method.

Statically indeterminate structures are structures with additional constraints (redundant), such that the three equations of equilibrium are not sufficient for analysing them. While both the force method and the displacement method aim to achieve the same goal, their underlying principles differ significantly.

The application of the force method and displacement method extends beyond static analysis, encompassing stability and dynamic analysis as well. This discussion centres on a comparison of these two methods, presented in their classical forms.

image 4
Structural frames can be analysed used the force and displacement methods

Comparison of Force and Displacement Methods

Both methodologies necessitate the establishment of primary systems. Furthermore, the generation of bending moment diagrams for unit loads (forces or displacements) is integral to both approaches. In each method, the disparity between the primary system and the original structure is eliminated through the application of a set of well-defined equations.

A comprehensive delineation of the key differences between these methods is presented below.

Primary System

Force method: The primary system is obtained by removing redundant constraints (excess support reactions) from a structure. This makes the structure statically determinate and leaves it with the minimum number of reactions required to achieve static equilibrium.

Displacement method: The primary system is obtained by adding additional constraints (excess support reactions) to the structure. This makes the structure kinematically determinate and leaves it with no unknown rotations and translations.

Primary Unknowns

Force method: The primary unknowns are the forces and moments, representing the removed redundant from the structure. The reactions of the removed redundant are the primary unknowns.

Displacement methods: The primary unknowns are the rotations (slopes) and translations (deflections), representing the additional redundants added to the structure at the points of rotation and translation. The displacements of the added redundants are the primary unknowns.

Number of Primary Unknowns

Force method: Equals the degree of static indeterminacy.

Displacement method: Equals the degree of kinematic indeterminacy.

Way of Obtaining Primary System

Force method: The selection of a primary system for structural analysis is not unique when using the force method. Through strategic selection, all redundant constraints – those exceeding the minimum necessary for stability – can be eliminated and replaced with corresponding reactions (forces and moments) acting at the structure’s supports.

While the choice of which redundant constraints to eliminate is discretionary, the resulting primary system must be statically determinate and stable.

Displacement method: The construction of a primary system in the displacement method demands a unique approach. Each rigid joint within the structure requires the introduction of an additional constraint to prevent any angular rotation. Similarly, for every independent linear displacement (movement in a straight line) that the structure could potentially undergo, an additional constraint must be implemented.

This ensures the primary system represents a set of standard statically indeterminate beams – structures with more unknown forces, moments, and reactions than can be solved for using equilibrium equations alone. This level of indeterminacy necessitates further analysis techniques to determine the complete internal force distribution within the structure.

Canonical Equations

Force Method:
δ11X1 + δ12X2 + … + δ1nXn + Δ1p = 0
δ21X1 + δ22X2 + … + δ2nXn + Δ2p = 0
. . . . . . . . . . . . = 0

The number of canonical equations is equal to the number of the primary unknowns.

Displacement Method:
k11Z1 + k12Z2 + … + k1nZn + K1p = 0
k21Z1 + k22Z2 + … + k2nZn + K2p = 0
. . . . . . . . . . . . = 0

The number of canonical equations is equal to the number of the primary unknowns.

Meaning of Equations

Force Method: Total displacement in the direction of eliminated constraints caused by the action of all primary unknowns (forces or moments) and applied forces is zero.

Displacement method: The total reaction in the direction of introduced constraints caused by the action of all primary unknowns (linear or angular displacements) and applied forces is zero.

Character of Canonical Equations

Force Method: The nature of the canonical equation using the force method is kinematical: the left part of canonical equations represents displacements.

Displacement Method: The nature of the canonical equation using the displacement equation is statical: the left part of the canonical equations represents reactions.

Matrix of coefficients of canonical equations

Force Method:

flexibility matrix for force method

Where A is the flexibility matrix.

Displacement Method:

stiffness matrix for displacement method

Where R is the stiffness matrix.

Meaning of Unit Coefficients

Force Method: Unit displacement δik presents displacement in the direction of ith eliminated constraints due to primary unknown (force) Xk = 1

Displacement method: Unit reaction rik presents the reaction in the ith introduced constraints due to primary unknown (displacement) Zk = 1

Meaning of Free Terms

Force Method: Displacement ΔiP presents displacement in the direction of ith eliminated constraint due to applied forces.

Displacement method: Reaction RiP presents the reaction in the ith introduced constraint due to applied forces.

A General Overview

The Force Method

The force method, also known as the compatibility method or the method of consistent deformations, focuses on forces acting on a structure as the primary unknowns. The core principle revolves around establishing compatibility conditions that ensure the structure maintains its geometric integrity under load.

Here’s a breakdown of the key steps involved in the force method:

  1. Determine the Degree of Statical Indeterminacy: The first step involves calculating the degree of statical indeterminacy (DSI). This value represents the number of redundant constraints (supports or connections) present in the structure. There are established formulas to determine DSI based on the structure’s geometry and support conditions.
  2. Choose Redundant Unknowns: Identify the redundant constraints, and select an equal number of unknowns to replace them. These unknowns will typically be the forces or moments acting at the points where the redundant constraints were removed.
  3. Construct the Primary Structure: Imagine a statically determinate structure (primary structure) derived from the original structure by eliminating all redundant constraints. This primary structure should be chosen strategically to simplify the analysis while maintaining stability.
  4. Replace Eliminated Constraints with Primary Unknowns: At the locations where redundant constraints were removed in the primary structure, introduce the corresponding reactions (forces or moments) as unknowns in the analysis.
  5. Form Compatibility Equations: Formulate a set of compatibility equations, equal in number to the degree of statical indeterminacy. These equations relate the displacements of specific points in the structure to the primary unknowns. They ensure that the structure maintains its geometric integrity under load.
  6. Solve the System of Equations: Solve the system of equations, formed by the compatibility equations and the equilibrium equations applicable to the primary structure, with respect to the primary unknowns. This step typically involves matrix methods for larger and more complex structures.
  7. Determine Remaining Reactions and Analyze the Structure: Once the primary unknowns (reactions due to the eliminated constraints) are determined, all other reactions within the original structure can be calculated using the principles of static equilibrium. With all internal forces and reactions known, a complete analysis of the structure’s behaviour under load can be performed.

Advantages of the Force Method

  • Clear Visualization of Forces: The focus on internal forces offers a clear understanding of the load distribution within the structure.
  • The force method gives the flexibility to select the most appropriate primary system.
  • It gives the user the ability to understand and ”interact” with the structure better.
  • The solution yields the direct support reactions of the structure.

Disadvantages of the Force Method

  • Complexity for Indeterminate Structures: For indeterminate structures (with more unknowns than equilibrium equations), additional compatibility conditions are needed. This can lead to a more complex and cumbersome solution process.
  • Selection of Redundant Forces: Identifying and selecting the appropriate redundant forces (forces that can be removed without affecting the overall equilibrium) can be challenging, especially for complex structures.
  • It is more challenging to program on computers.
image 5

The Displacement Method

The displacement method, also known as the stiffness method, is the opposite of the force method. Here, the primary unknowns are the displacements (translations and rotations) of specific points within the structure.

The core concept of this method relies on the relationship between applied loads, member stiffness (resistance to deformation), and resulting displacements. Let’s explore the key steps involved:

  1. Define the degree of kinematical indeterminacy and construct the primary system of the displacement method.
  2. Formulate the canonical equations of the displacement method.
  3. Apply successively unit displacements to the primary structure. Construct the corresponding bending moment diagrams.
  4. Calculate the main and secondary unit reactions rik.
  5. Construct the bending moment diagram due to the applied load in the primary system and calculate the free terms RiP of the canonical equations.
  6. Solve the system of equations with respect to unknown displacements.
  7. Construct the bending moment diagrams.
  8. Compute the shear forces using the Schwedler theorem considering each member due to the given loads and end bending moments and construct the corresponding shear diagram.
  9. Compute the axial forces from the consideration of the equilibrium of joints of the frame and construct the corresponding axial force diagram
  10. Calculate reactions of supports and check them using the equilibrium conditions for an entire structure as a whole or for any separated part.

Advantages of the Displacement Method

  • Straightforward for Indeterminate Structures: This method shines when analyzing indeterminate structures. The additional compatibility conditions required in the force method are automatically incorporated through the stiffness matrix.
  • Direct Determination of Displacements: Displacements, a crucial design consideration, are directly obtained as the primary unknowns.
  • Suitability for Computer Analysis: The stiffness method readily lends itself to computer-aided analysis using software like SAP2000 or ETABS, making it highly efficient for complex structures.

Disadvantages of the Displacement Method

  • Less Intuitive for Force Visualization: While internal forces can be determined, the method doesn’t offer the same level of immediate clarity regarding load distribution within the structure compared to the force method.
  • Computational Effort for Simple Structures: For simple, determinate structures, the force method produces a larger set of equations compared to the force method.

The Ultimate Guide to Planning a Successful Loft Conversion

Many people living in the city know that a spacious home is quite a luxury. But there are several ways to make your apartment or space look and feel bigger. For instance, consider a loft conversion that can help increase your floor area to up to twice as much as you currently have. Interested? Then read on for this article provides a guide on planning a successful loft conversion.

A loft originally refers to a high-up space in a building, usually directly below the roof. In houses, this is often called an attic and is used for storage. However, there is a more modern meaning of loft. It refers to a large, open-plan living space that has been converted from an industrial building, like a warehouse or factory. These lofts are typically spacious and have high ceilings, large windows, and exposed brick or concrete walls.

In metropolitan areas where affordable accommodation is scarce, loft conversions have become a popular way to add valuable living space to existing properties. They offer an exciting opportunity to transform underutilized roof voids into functional and stylish rooms. However, the technical aspects of a loft conversion can be complex, and require the input of building and construction experts.

Typical loft apartment

Feasibility Assessment

Before discussing the specifics, it is very important to assess the feasibility of converting your loft. In this case, you may need to consult a structural engineer to assess if the foundation of your space can support the conversion.

You must also measure the available head height, ensuring you can comfortably stand downstairs and sit up in the loft. More importantly, you need a budget plan that includes the cost of the design and construction and the furnishings you will need once the conversion is completed. The money you can afford to spend will somehow dictate the type of loft you can construct in your space.

Here are some key factors to consider:

  • Roof Type: Pitched roofs with sufficient headroom (typically exceeding 2.3 meters) are generally ideal spaces. Flat roof conversions may require raising the roof structure, adding significant complexity and cost.
  • Structural Integrity: The existing structure needs to be assessed by a qualified structural engineer to ensure it can handle the additional weight of the conversion. Strengthening works may be necessary.
  • Headroom and Floor Area: Building regulations dictate minimum headroom requirements (often 2 meters) and usable floor area. Careful planning is required to maximize livable space while adhering to regulations.
  • Access: Creating a safe and compliant staircase is essential. Spiral staircases might be space-saving but may not meet building code requirements. Consider the impact of installing a new staircase on the existing layout.

Planning and Design of Loft Conversion

Once feasibility is established, careful planning and design come into play. It is important to think about how you will use the loft space because this can affect your design. Do you want to use it as a bedroom or an office? In most loft-type designs, the office space is planned below the loft because the latter is used as a sleeping quarter.

Nevertheless, it is up to you to decide how you want to use it. Also, try to envision how you want the loft to look in your space. You can opt for a dormer-loft conversion if you wish to have additional floor space and headroom. Still, if you prefer skylights instead of converting your existing space, then a Velux conversion would be more suitable for your needs. Here are pertinent factors to consider in design and planning:

  • Space Planning: Carefully consider the intended use of the loft space (bedroom, bathroom, office) and approach an expert to design a layout that optimizes functionality and traffic flow. The utilization of 3D modelling software to visualize different layouts and ensure efficient use of space can come in handy.
  • Building Regulations: Understanding and adhering to local building regulations is paramount. These regulations cover fire safety, structural integrity, sound insulation, ventilation, and more. Consulting a registered construction expert can ensure your design complies with all necessary regulations.
  • Natural Light and Ventilation: Loft conversions can sometimes feel enclosed. Strategically placed roof windows (Velux windows) or dormer windows can introduce natural light and improve ventilation.
Domer window loft apartment
Domer-loft apartment

One of the best things you can do to convert your space into a loft-type design is to get the help of experts. The reputable loft conversion experts behind the Deluxe Lofts in London suggest that you opt for the services of professionals within your vicinity. This way, you can visit them as needed, ensuring your concerns are taken care of.

Contractors dealing with loft conversions within your area will also be very familiar with the building rules and regulations. They will ensure that you comply with the building codes that may vary from region to area. Fortunately, you can now search online sources for contractors specializing in loft conversions within your locality. Just remember to verify their credentials and experience by looking into what their previous clients have to say about their services.

Construction Considerations

The construction phase requires careful execution to ensure a high-quality and safe finished product:

  • Structural Works: Depending on the initial assessment, structural reinforcement works like installing steel beams or strengthening floor joists might be necessary. Hiring qualified structural engineers and builders is important for this stage.
  • Flooring, Insulation, and Soundproofing: Installing proper insulation in the roof and walls is vital for thermal efficiency and noise control. Choosing the right flooring material that complements the overall design and can handle potential moisture variations is also important.
  • Electrical and Plumbing Systems: Depending on the intended use of the loft, new electrical wiring and plumbing installations might be required. Hiring certified electricians and plumbers is essential to ensure safety and compliance with regulations.
AD 4nXfKcTwlOMkQsDUj pF KFs2EUM gHjWti8XKxm4eaSFUibQ4K9bSW6fRSSsvoM9BmSgLnDhLBKOQk8s7oBNVjIJDF7Tr xn66gKS IJCrvaCKN1I1LG14jjsfDhZBIpPly767tZpjmR8k0SeXpu4XqyEvMB?key=G4CNlqC1NyYOdddwvcAhyw

Additional Considerations

  • Building Permits and Approvals: Obtaining the necessary building permits and approvals from local authorities is important before commencing construction.
  • Party Wall Agreements: If your loft conversion involves adjoining a neighbouring property, party wall agreements outlining shared responsibilities and access rights might be necessary.
  • Cost Management: Loft conversions can be a significant investment. Obtaining quotes from multiple qualified builders and creating a detailed budget with contingency plans for unforeseen costs is essential.

Conclusion

By carefully considering the technical aspects outlined above, a loft conversion can be a rewarding project that adds significant value and functionality to your property. Remember, consulting qualified professionals like structural engineers, architects, and builders throughout the process is key to a successful and compliant loft conversion.

For a successful loft conversion, your best option is to get the help of experts who can ensure that the process is done right the first time around. But remember to also make a list of your initial considerations before you plan and design your loft conversion project. Rest assured that if you follow the tips in this guide, you will make your loft conversion dream a reality.

The Role of Technology in Managing and Recycling Construction and Demolition (C&D) Waste

Every year, the construction industry generates a staggering amount of waste. Recent statistical figures in the UK indicate that 62% of the country’s waste comes from the construction industry, which also converts to 32% of all waste sent to landfills. Estimates suggest around 2.2 billion tons of construction and demolition waste are produced globally each year, and this number is expected to rise further.

This massive volume of waste not only has severe environmental impacts but also poses significant challenges for construction companies and environmental engineers striving to comply with strict legal requirements.

Large quantities of construction waste are generated from around the world

In this blog post, we’ll explore how innovative technology is revolutionizing the management and recycling of construction waste. By the end, you’ll have a clearer understanding of the benefits technology brings to waste management and how your company can adopt more sustainable practices.

Construction and Demolition Wastes

Construction and demolition (C&D) activities generate a substantial portion of the global waste stream, posing a significant environmental and resource management challenge. This section provides a technical overview of the primary constituents of construction and demolition waste.

  • Mineral Waste: Concrete and asphalt debris are major components of construction and demolition wastes. Crushed rock, aggregates from road construction and maintenance, and demolition of concrete structures contribute significantly. These materials often require crushing and processing for reuse as recycled aggregates in new construction projects.
image 4
Concrete debris constitute a major component of construction and demolition waste
  • Wood Waste: Offcuts, damaged lumber, and dismantled wood elements from construction and renovation activities contribute considerably to C&D waste. Improved prefabrication techniques and on-site wood waste management strategies can significantly reduce this component.
  • Masonry Waste: Sandcrete blocks, bricks, tiles, and other masonry products also represent a substantial portion of C&D waste. Advancements in crushing and sorting technologies have enabled increased recycling of these materials into construction fill or even new masonry units.
  • Gypsum Waste: Drywall panels which are common in modern construction, contribute a significant volume of C&D waste. Recycling gypsum presents challenges due to potential contamination and the hygroscopic nature of the material. However, advancements in processing techniques are enabling increased gypsum waste diversion from landfills.
  • Metallic Waste: Scrap metal from roofing, electrical wiring, piping, and other building components represents a valuable recyclable component of C&D waste. Effective sorting and processing techniques allow for the recovery of various metals for use in new construction products.
Construction waste from road asphalt demolition

Beyond these primary categories, construction and demolition waste may also encompass:

  • Glass Waste: Window panes, architectural glass, and glazing materials contribute a smaller portion of the overall waste stream.
  • Plastic Waste: Plastic piping, insulation materials, and various construction membranes can also be present in construction and demolition waste.
  • Hazardous Materials: Asbestos-containing materials, lead paint chips, and residual solvents require careful handling and disposal due to their potential health and environmental risks.

The effective management of C&D waste necessitates a multifaceted approach. Source reduction strategies through improved design, prefabrication, and material selection can significantly reduce waste generation. Furthermore, advancements in recycling technologies and robust waste segregation protocols are important for diverting recoverable materials from landfills and promoting a more sustainable construction industry.

Problems of Construction Waste Management

Effective management of construction and demolition waste presents a multifaceted challenge for stakeholders across the construction lifecycle. Some of these challenges are discussed below:

  • Waste Characterization and Segregation: C&D waste encompasses a diverse range of materials, including concrete, asphalt, wood, metals, and hazardous elements. Improper characterization and inadequate segregation at the source hinder effective recycling and reuse opportunities.
Manual sorting of construction and demolition wastes
  • Logistics and Infrastructure Constraints: Construction sites often lack dedicated space for waste segregation and storage. Limited access to appropriate waste processing facilities and logistical complexities in transporting various waste streams further exacerbate the challenge.
  • Economic Considerations: Virgin materials are often cheaper than recycled alternatives due to economies of scale and established supply chains. The cost of transportation, processing, and quality control for recycled C&D materials can make them less attractive.
  • Policy and Regulatory Frameworks: Inconsistent or inadequate policies governing C&D waste management, coupled with a lack of enforcement mechanisms, can hinder progress towards sustainable practices. Furthermore, a complex web of regulations across different waste streams can create confusion and impede responsible management.
  • Lack of Awareness and Training: Limited awareness among construction professionals regarding waste minimization strategies, recycling opportunities, and best practices for C&D waste management can hinder effective implementation. Inadequate training for workers in waste segregation and handling protocols further exacerbates the issue.
  • Short-Term Project Focus: The construction industry often prioritizes project timelines and budgets, potentially leading to overlooking opportunities for waste reduction and reuse. A shift towards life-cycle thinking and incorporating sustainable practices throughout the project lifecycle is crucial.

Innovative Solutions in Construction Waste Management

The construction industry is constantly evolving, and waste management is no exception. Here are some innovative solutions that are tackling the challenge of construction and demolition (C&D) waste:

Innovative Sorting Methods

Innovative sorting methods have significantly advanced the efficiency and effectiveness of construction waste management. Modern technologies such as artificial intelligence (AI) and machine learning are being leveraged to automate the sorting process, ensuring accurate separation of materials like concrete, wood, metals, and plastics.

Advanced sensors and robotic systems can identify and categorize waste in real time, reducing the risk of human error and increasing recycling rates. Additionally, mobile apps and software solutions are now available to track and manage waste streams, providing construction companies with valuable data to optimize their recycling practices.

These technologies not only streamline the sorting process but also contribute to a more sustainable construction industry by diverting waste from landfills and promoting the reuse of valuable materials.
Recycling Innovations

Recycling construction waste has reached new heights thanks to cutting-edge technologies. Waste management specialists at UK Construction Waste Co. recommend working with construction waste recycling facilities that implement advanced recycling methods that transform waste into reusable resources. For example, reclaimed concrete can be crushed and used as aggregates for new building projects, while metals and wood can be processed for various applications.

These innovative recycling methods not only reduce the burden on landfills but also conserve natural resources and decrease the carbon footprint of construction activities. By adopting these practices, companies can significantly enhance their sustainability efforts, meeting legal requirements and garnering positive environmental impact.

Efficient Processing Techniques

Recycling and processing of construction waste go hand in hand, so innovations must apply to both areas. Efficient processing techniques are pivotal in transforming construction waste into reusable materials, reducing the environmental burden. Innovative methods such as crushing, grinding, and screening are used to process waste materials like concrete, asphalt, and wood.

These processed materials can then be reintegrated into new construction projects, promoting a circular economy. Additionally, advancements in thermal and chemical processing have enabled the conversion of waste into valuable resources such as synthetic fuels and raw materials for the production of new construction products.

This not only minimizes the waste sent to landfills but also conserves natural resources by reducing the need for virgin material extraction. By adopting these advanced processing techniques, construction companies can significantly enhance their sustainability efforts while also adhering to stringent regulatory requirements.

AD 4nXfFPj7q373GKvo141wERjTYvaBkk7KteOppeIWwRc0W5q3W1ftWux1gj6fDMgIouF2h7lHdWi3Md6rPh8YQ0250IobYymm RRG

Conclusion

Technology is undeniably transforming the way we manage and recycle construction waste. From AI-powered sorting systems to advanced recycling techniques, these innovations are helping construction companies and environmental engineers tackle the waste problem more efficiently and sustainably. By adopting these technologies, businesses can not only comply with legal requirements but also reduce their environmental footprint and save costs.

If you’re ready to take the next step towards a more sustainable future, consider exploring how these technologies can benefit your organization. Let’s work together to build a cleaner, greener, and more efficient construction industry.

Risk Management for Municipal Utilities | Public Utilities

Municipal utilities are responsible for supplying large communities with water, power, and natural gas. These utilities are run for the benefit of the community, with the primary goal of providing reliable and affordable services to residents and businesses. They are usually public facilities, managed by a federal, state, or local government entity, rather than a private company.

Some of the most common municipal utilities include:

  • Electricity
  • Water
  • Sewer
  • Natural gas
  • Trash and recycling collection
  • Broadband internet

There are several advantages to having municipal utilities. One benefit is that they are typically less expensive than investor-owned utilities. This is because municipal utilities are not beholden to shareholders who demand profits. Instead, they can reinvest their earnings back into the community to improve infrastructure and keep rates low.

Another advantage of municipal utilities is that they are more accountable to the public. Since they are owned by the local government, they are subject to public oversight and must answer to the needs of the community. This can lead to more responsive customer service and a greater focus on sustainability and environmental protection.

Water treatment and supply systems are municipal utilities

Design of Municipal Utilities

Civil engineering plays a vital role in designing, constructing, and maintaining municipal utilities.

Water Systems

  • Hydraulics and Hydrology: Civil engineers use their knowledge of fluid mechanics to design pipe networks. This involves calculating water flow rates, pressures, and potential surges to ensure adequate supply throughout the system. Additionally, they consider rainfall patterns and drainage areas to design stormwater management systems that prevent flooding.
  • Water Treatment Plants: These facilities require expertise in structural engineering to design robust buildings and tanks. Additionally, understanding sedimentation, filtration, and disinfection processes is important for designing efficient treatment units.

Wastewater Systems

  • Sanitary Sewer Design: Civil engineers design sewer systems that efficiently convey wastewater using gravity or pumping stations. They consider factors like pipe slopes, diameters, and flow velocities to prevent blockages and ensure proper flow.
  • Wastewater Treatment Plants: Similar to water treatment plants, these facilities require structural design for buildings and tanks. Additionally, civil engineers design treatment processes like settling basins, aeration units, and disinfection systems.
image 2

Stormwater Management

  • Drainage Networks: Civil engineers design storm drain systems that collect and convey rainwater runoff from streets and properties. This involves designing channels, culverts, and detention ponds to manage stormwater volume and prevent flooding.
  • Erosion Control: To minimize soil erosion during heavy rains, civil engineers design slopes, swales, and retention ponds that slow down water flow and prevent soil loss. They may also incorporate bioengineering techniques like vegetation buffers.

Designing municipal utilities involves a complex interplay between several factors:

  • Functionality: The core aspect is ensuring the system efficiently delivers its service like water reaching every tap or electricity flowing reliably. Pipe sizes, pumping stations, and treatment facilities are all designed for capacity and functionality.
  • Durability and Resilience: Utilities are built to last for decades, enduring weather, wear, and even natural disasters. Material selection, construction methods, and redundancy measures all factor into a resilient design.
  • Safety: Public safety is very important. Underground utilities are placed at specific depths and with proper separation to avoid accidental damage during construction or future maintenance. Sewer systems consider potential health hazards and proper ventilation.
  • Growth and Efficiency: As communities grow, utility design should consider future expansion needs. Flexible layouts and easily upgradable components are important. New technologies that improve efficiency, like water-saving plumbing or smart grids for electricity, are also incorporated into modern designs.
  • Environmental Impact: Sustainable practices are increasingly important. Stormwater management systems reduce flooding and pollution. Water treatment facilities should consider eco-friendly processes. Some designs even integrate renewable energy sources like solar panels on water towers.

Overall, municipal utility design is a blend of engineering expertise, long-term planning, and keeping pace with evolving technologies and environmental considerations.

image 3

Risk Management for Municipal Utilities

However, municipal utilities are susceptible to various risks, and it all depends on how well this risk is managed. Operational stability, compliance with regulations, and public safety all rely on proper risk management for municipal utilities, so in the text below, we will discuss some of the important aspects of this process. 

Windfarms for electricity generation are public utilities

Identifying risks

Municipalities must be aware of the circumstances that can pose great danger to the utility’s operations. To ensure municipal utilities’ safety and compliance, they work together to come up with a list of potential dangers, and they use techniques like brainstorming and analysis of past data. For example, local governments can evaluate the potential of earthquakes and floods to cause infrastructure damage and how to work to mitigate those risks. 

Assessing the risks

Once the risks are identified, the authorities must do their best to assess and evaluate them. They use various qualitative tools to come up with the best solutions and a precise assessment of all the dangers to public utilities. 

Mitigating risks

The primary focus of mitigating risks is to reduce the severity of the dangers that threaten to harm public life quality. Possible approaches to this task include infrastructural improvements, technology adaptation, and contingency planning. When it comes to power outages, for example, municipalities can invest in backup power systems to lower the chances of unpleasant outages. 

Risk management

Authorities must regularly check up on whether something has changed or if there is some danger to any of the utilities. They must work tirelessly on assessing risks, keeping the data fresh, and evaluating risk management to check whether all operations are relevant and able to keep the dangers away. This proper risk management ensures that possible new dangers are identified and solved quickly before they put everyone at risk. 

Electricity distribution lines are public utilities

Operational risks

Operational risks include those from malfunctioning equipment, natural catastrophes, and human mistakes. If such things happen, then the whole service delivery is disrupted and it can compromise public safety. For example, during floods, there may be power and clean water outages, which greatly harm the normal functioning of public life.

Also, if the utilities are not handled properly or if there is some major human mistake, it can have devastating effects. Disaster preparation plans and regular maintenance are all important preventive measures to keep operations risks as low as possible. 

Financial risks

Financial risks include lack of money, unpredictable costs, and ineffective billing processes, all of which can make the quality of service lower, as the utility may not be able to invest in upgrades and regular maintenance. 

Regulatory risks

Every municipal utility must adhere to all federal, state, and municipal rules and regulations. If they don’t, they risk penalties, high costs, and a tarnished reputation. 

Managing risks for municipal utilities is of great importance as it helps provide vital services to everyone. Identifying, assessing, mitigating, and managing risks are all necessary steps to ensure utilities protect their assets, stay relevant to laws and regulations, and keep public safety at the top level.

Estimation of Runoff for Drainage Design

During the siting and geometric design of highways, incorporating adequate drainage systems is a critical consideration. Drainage conditions often determine the durability and performance of highway pavement structures. Therefore, highway and street drainage facilities must effectively convey water away from the pavement surface and into appropriately designed channels.
Inadequate drainage will inevitably lead to severe degradation of the highway structure. Furthermore, accumulated water on the pavement can impede traffic flow, and hydroplaning and reduced visibility due to splash and spray can contribute to accidents.

The importance of adequate drainage systems is reflected in the budgetary allocation for drainage facilities within highway construction projects. Approximately 25% of highway construction funds are designated for erosion control and drainage structures, encompassing culverts, bridges, channels, and ditches.

poor drainage affects the durability of pavements
Poor drainage affects the durability of pavements

In highway engineering, two primary water sources demand attention, which are surface water and groundwater. Surface water occurs from precipitation in the form of rain or snow. While a portion infiltrates the soil, the remaining surface water presents a potential threat to the highway pavement and requires removal. Drainage systems designed to address this concern are categorized as surface drainage.

The second source, subsurface water, refers to water flowing through the permeable zones of the soil. This becomes particularly relevant in situations involving highway cuts or areas with a high water table situated near the pavement structure. Drainage strategies employed to mitigate this source are classified as subsurface drainage.

This article is concerned with the estimation of surface water runoff from pavements and streets.

Parameters Influencing Surface Water Runoff

During the design of drainage facilities for highway construction, engineers utilise three key parameters of rainfall:

  • intensity (rate of fall),
  • duration (length of time for a specific intensity), and
  • frequency (the expected time interval between occurrences of a specific intensity-duration combination).

For example, the U.S. Weather Bureau maintains a network of automated rainfall gauges that gather nationwide intensity and duration data. This data serves as the basis for the development of rainfall-intensity curves, which are then employed to determine the rainfall intensity for a designated return period and duration.

It is important to acknowledge that any estimations of rainfall intensity, duration, or frequency derived from this data are based on the principles of probability. For instance, designing a culvert to handle a “50-year” flood implies a 1 in 50 chance of the culvert reaching capacity in a given year.

This does not guarantee a precipitation event of that exact intensity and duration will occur precisely every 50 years. In actuality, there’s a possibility of experiencing higher-intensity storms one or more times within the design period, albeit with a lower probability.

This highlights the trade-off between minimizing overflow risk and cost. Designing for infrequent storms translates to significantly larger and more expensive drainage facilities. As such, selecting a design frequency necessitates a cost-benefit analysis.

Flooded highway
Flooded highway

Capital costs for the drainage system are weighed against potential public costs associated with severe highway damage from storm runoff. Factors influencing this decision typically include the highway’s significance, traffic volume, and the surrounding area’s population density.

Beyond rainfall, several other hydrological variables are crucial for the engineer’s determination of surface runoff rates. These include:

Drainage Area: This encompasses the land surface contributing runoff to the specific location where channel capacity needs to be assessed. This is also called the catchment area. Drainage areas are typically delineated using topographic maps. Recently, Google Earth maps have been used to analyse watershed areas.

Runoff Coefficient (C): This coefficient represents the ratio of runoff to rainfall for the designated drainage area. Factors influencing the runoff coefficient include ground cover type, drainage area slope, storm duration, prior ground saturation, and overall land slope.

In cases where the drainage area consists of different ground characteristics with different runoff coefficients, a representative value Cw is computed by determining the weighted coefficient.

Cw = ∑CiAi/∑Ai

where:
Cw = weighted runoff coefficient for the whole drainage area
Ci = runoff coefficient for watershed i
Ai = area of watershed i (acres)

Typical values of runoff coefficient C are;

Type of Drainage AreaRunoff Coefficient
Downtown areas0.70 – 0.95
Neighbourhood areas0.50 – 0.70
Apartment dwelling areas 0.50 – 0.70
Light industrial areas0.50 – 0.80
Heavy industrial areas0.60 – 0.90
Parks, cemetries0.10 – 0.25
Unimproved areas0.10 – 0.30
Asphaltic pavement streets0.70 – 0.85
Concrete pavement streets0.80 – 0.95
Cultivated fields0.20 – 0.40
Steep grassed areas (2:1)0.50 – 0.70

It is important to note that a runoff coefficient of 0.75 means that 75% of precipitation in the area will translate to runoff or stormwater.

Time of Concentration (Tc): This parameter reflects the time required for runoff to travel from the farthest hydraulic point within the watershed to the point of interest. Determining the time of concentration for a drainage area is essential for selecting the appropriate average rainfall intensity for a chosen frequency of occurrence.

The time of concentration itself is influenced by several factors such as the size and shape of the drainage area, surface characteristics, slope of the drainage area, rainfall intensity, and whether the flow path is entirely overland or partially channelized.

Determination of Runoff for Drainage Design

The type of surface significantly impacts the amount of runoff generated for a given rainfall intensity and duration. Impervious surfaces like bare rock, roofs, and pavements exhibit much higher runoff rates compared to permeable surfaces such as ploughed fields or dense forests. Therefore, highway engineers strive to quantify the portion of rainfall that translates to runoff.

This task presents a challenge as runoff rates for a specific area during a single rainfall event are typically not static. Fortunately, various methods exist to estimate runoff, with the rational method being explored in this article.

Rational Method

The rational method centres on the principle that a storm’s runoff rate is dictated by three factors: average rainfall intensity, the drainage area’s size, and its surface characteristics. It’s important to acknowledge that real-world rainfall intensity isn’t uniform across large areas or throughout a storm’s duration.

To address this, the rational formula adopts the assumption that for an impervious area (A) experiencing rainfall of average intensity (I), the peak runoff rate (Q) at the drainage area’s outlet occurs when the entire area contributes runoff at a constant rate.

This necessitates a storm duration that’s at least equal to the time of concentration, which signifies the time it takes runoff to travel from the farthest point in the drainage area to the outlet. However, achieving this condition in practice can be challenging, especially for large drainage areas. Consequently, the rational formula is typically applied to relatively small drainage areas, generally not exceeding 200 acres.

The mathematical expression for the rational formula is provided below;

Q = CIA

where:
Q = peak rate of runoff (volume/time)
A = drainage area (Area)
I = average intensity for a selected frequency and duration equal to at least the time of concentration (depth/time)
C = a coefficient representing the fraction of rainfall that remains on the surface of the ground (runoff coefficient)

The units in the rational formula need to be consistent.

image

Design Example

A 120-acre (485623 m2) urban drainage area in Port Harcourt City Nigeria consists of three different watershed areas as follows.

Streets (asphalt pavement) = 10%
Apartment dwelling areas = 60%
Unimproved areas = 10%
Light industrial area = 20%

If the time of concentration for the drainage area is 1 hr, determine the runoff rate for a storm of 50-yr frequency.

rainfall intensity curves for Port Harcourt
Rainfall intensity curve for PortHarcourt (Nwaogazie et al, 2019)

From the rational formula;
Q = 0.278CIA
A = drainage area (km2)
I = rainfall intensity (mm/hr)
C = Average (weighted) runoff coefficient

Runoff coefficients
Streets (asphalt pavement) = 0.75
Apartment dwelling areas = 0.6
Unimproved areas = 0.2
Light industrial area = 0.65

Weighted runoff coefficient = Cw = [0.485(0.1 × 0.75 + 0.6 × 0.6 + 0.1 × 0.2 + 0.2 × 0.65)]/0.485 = 0.585
From the rainfall intensity graph of the City of PortHarcourt, the rainfall intensity of a return period of 50 years and duration of 1 hour (60 minutes) is 110 mm/hr

Q = 0.278 × 0.585 × 110 × 0.485 = 8.67 m3/sec

Conclusion

Drainage design for highways considers rainfall as the primary source of water. The rational method, a common tool for this purpose, focuses on three key factors: average rainfall intensity, drainage area size, and surface type.

While real rainfall varies in intensity and duration, the method assumes a constant rate of runoff from an impervious area for a storm whose duration equals the time for water to travel from the farthest drainage point to the outlet. This time is called the time of concentration. Due to limitations in achieving this ideal scenario, the rational method is best suited for relatively small drainage areas, typically under 200 acres.

The results from the rational formula can be used in sizing stormwater drainage facilities such as ditches, culverts, gutters, channels, sewer pipes, etc.

Sources and Citations
Nwaogazie IL, Sam MG. Probability and non-probability rainfall intensity-duration-frequency modeling for port-harcourt metropolis, Nigeria. Int J Hydro. 2019;3(1):66-75. DOI: 10.15406/ijh.2019.03.00164

Hydraulic Design of Open Channel Drainage Structures

The major objective in the design of an open channel highway drainage structure lies in establishing the optimal hydraulic performance. This process ensures the selection of a structure size that is not only economical but also adequate in conveying the anticipated stormwater runoff. Achieving this balance involves a good understanding of the hydraulic parameters that influence stormwater flow and runoff.

Beyond economic and size considerations, the design of open channel drainage structures must adhere to specific hydraulic requirements. These requirements are instrumental in preventing detrimental outcomes within the drainage system, such as erosion along channel walls or the undesirable accumulation of sediment within the hydraulic structure itself.

Uncontrolled erosion of the drainage structure and linings can compromise the structural integrity of the drainage system, leading to costly repairs and potential safety hazards. Similarly, sediment buildup within the structure can impede its flow capacity, potentially leading to localized flooding during heavy precipitation events.

image 35
Rectangular drainage construction

The proper establishment of the hydraulic requirements for such strucures enables engineers to design open channel drainage systems that effectively manage stormwater runoff while safeguarding the system’s longevity and functionality.

Design of Open Channels

One important design consideration for open channel highway drainage involves achieving an optimal flow velocity. This velocity should be neither excessively low, which could lead to undesirable sediment deposition within the channel, nor excessively high, which could cause erosion of the channel lining itself. The optimum velocity range depends on several factors:

Channel Geometry: The shape and size of the channel significantly influence flow dynamics. A wider and deeper channel can accommodate higher velocities without experiencing erosion compared to a narrower or shallower one.

Channel Lining: The type of material used to line the channel also plays a role. Concrete or riprap linings can withstand higher velocities compared to bare soil channels, which are more susceptible to erosion.

Flow Rate: The quantity of water being transported by the channel is another critical factor. Higher flow rates necessitate a higher velocity to maintain efficient drainage, but exceeding the recommended limits for the specific channel lining can lead to erosion.

Sediment Characteristics: The type of material suspended in the water also influences the optimal velocity. Fine-grained sediments are more prone to deposition at lower velocities, whereas coarser materials can withstand higher velocities without significant erosion risk.

Considering these factors, a channel gradient range of 1% to 5% is generally recommended for achieving the desired flow velocity. Slopes below 1% often result in excessively low velocities, leading to sediment buildup. Conversely, slopes exceeding 5% can generate velocities that cause erosion of even the most robust channel linings.

The design must also account for the discharge point where the drainage channel meets the natural waterway. A significant elevation difference between the channel outlet and the waterway can necessitate additional design considerations, such as the inclusion of energy dissipation structures to prevent scouring and erosion at the discharge point.

rectangular drainage structure

Design Principles

The basis of hydraulic design for drainage ditches lies in establishing the minimum cross-sectional area of the channel. This area must be sufficient to convey the anticipated stormwater runoff from a specific design storm event without causing overflow. Achieving this objective involves some calculations to determine the channel’s capacity.

Manning’s formula is one of the most commonly employed methods for calculating a channel’s capacity. This equation was developed on the fundamental assumption of uniform, steady flow within the channel.

v = 1.486/n × R2/3 × S1/2

Based on this assumption, Manning’s formula allows for the calculation of the average velocity (V) within the channel using the following parameters:

v = average discharge velocity (ft /sec)
R = mean hydraulic radius of flow in the channel (ft) = a/p
a = channel cross-sectional area (ft2)
P = wetted perimeter (ft)
S = longitudinal slope in channel (ft /ft)
n = Manning’s roughness coefficient

  • Manning’s roughness coefficient (n): This coefficient accounts for the frictional resistance exerted by the channel walls and lining material. Manning’s roughness depends on the type of material used to line the surface of the ditch. Rougher surfaces have higher n values, signifying greater resistance to flow.
  • Hydraulic radius (R): This parameter represents the ratio of the channel’s wetted area (the area of the channel in contact with flowing water) to its wetted perimeter (the length of the channel perimeter in contact with flowing water). A larger hydraulic radius translates to a more efficient flow conveyance.
  • Channel slope (S): This represents the inclination of the channel bed, expressed as a decimal slope (e.g., 0.02 for a 2% slope). Steeper slopes generate higher velocities.

Typical ranges of Manning’s roughness coefficient for open channels are provided in the Table below.

MaterialSurface DescriptionRange of Manning’s coefficient n
ConcreteAll sides formed, no finish0.013 – 0.017
ConcreteTrowel finish0.012 – 0.014
ConcreteFloat finish0.013 – 0.015
ConcreteFloat finish, some gravel on bottom0.015 – 0.017
ConcreteSteel formwork0.011
ConcreteWooden formwork0.015
ConcreteGunite, good section0.016 – 0.019
Asphaltsmooth0.013
AsphaltRough0.016

By incorporating these parameters into Manning’s formula, engineers can determine the average flow velocity within the drainage ditch. This velocity, combined with the desired design discharge (flow rate) for the storm event, allows for the calculation of the minimum required cross-sectional area to ensure proper drainage without overflow.

The flow in the channel is then given as;

Q = va = 1.486/n × a × R2/3 × S1/2

Types of Flow in Open Channel Hydraulic Structures

Since Manning’s formula was developed on the assumption of steady flow, it is therefore imperative to briefly discuss these types of flow. Open channel flow behaviour can be categorized into two primary classifications: steady and unsteady flow. Steady flow signifies a constant rate of discharge over time, whereas unsteady flow exhibits variations in discharge with time. Steady flow can be further subdivided based on channel characteristics into uniform and non-uniform flow.

Uniform flow manifests when the channel properties, such as slope, roughness, and cross-section, remain consistent along its entire length. Conversely, non-uniform flow occurs when these properties exhibit variations along the channel. In a scenario of uniform flow, the depth (d) and velocity (v) are considered “normal,” and the water surface slope perfectly aligns with the channel bed slope.

Achieving complete uniformity in channel properties across its entire length is a significant engineering challenge in real-world applications. However, Manning’s equation remains a valuable tool for practical solutions to highway drainage problems. This is because, in most cases, the resulting error associated with assuming uniform flow is negligible.

Another key distinction in open channel flow is the characterization of tranquil and rapid flow regimes. Tranquil flow resembles the movement of water in an open channel with a gentle longitudinal slope. In contrast, rapid flow is analogous to water cascading down a steep incline. The flow depth at which a channel transitions from tranquil to rapid flow is termed the critical depth.

When the flow depth exceeds the critical depth, the flow is classified as subcritical. This type of flow is frequently observed in streams traversing plains and broad valleys. Conversely, supercritical flow occurs when the flow depth falls below the critical depth and is often encountered in steep flumes and mountain streams. The critical depth can also be defined as the flow depth corresponding to the minimum specific energy of the system. Notably, the critical depth depends solely on the channel geometry and discharge.

The velocity and channel slope corresponding to uniform flow at critical depth are designated as critical velocity and critical slope, respectively. Therefore, during supercritical flow, the actual flow velocity and channel slope surpass the critical values, while they remain lower than the critical values during subcritical flow.

precast drainage installation

Design of an Open Channel

Designing an efficient and cost-effective open channel drainage for a highway involves a two-step process:

  1. Channel Sizing for Flow Capacity: The first step entails determining the optimal cross-sectional area for the channel. This area should effectively and economically convey the anticipated stormwater runoff generated by the design storm event to a designated natural waterway.
  2. Erosion Protection Evaluation: The second step focuses on assessing the channel’s necessity for erosion protection measures. If erosion is a potential concern, this step involves selecting the most appropriate type of lining material to safeguard the channel from scour and degradation.

The Manning formula plays an important role in the first step of channel sizing. By assuming a specific cross-section for the channel and solving the formula, engineers can determine whether the proposed channel is sufficiently large to accommodate the design storm runoff.

This solution can be obtained through manual calculations or by utilizing the relevant Federal Highway Administration (FHWA) charts. The following example will demonstrate both approaches for solving the Manning’s formula in this context.

Design Example

Determine a suitable cross section for a channel to carry an estimated runoff of 290 ft3/sec (8.21 m3/sec) if the slope of the channel is 2% and Manning’s roughness coefficient, n, is 0.015.

Solution:
Select a channel section and then use Manning’s formula to determine the flow depth required for the estimated runoff.
Assume a rectangular channel 4 ft (1.2m) wide.
Flow depth = d
Cross-sectional area (a) = 4d
Wetted perimeter (p) = 4 + 2d
Hydraulic radius R = a/p = 4d/(4 + 2d)

Q = va = 1.486/n × a × R2/3 × S1/2
290 = (1.486/0.015) × 4d × [4d/(4 + 2d)]2/3 × (0.02)1/2

Solving this equation can be complex, but a little consideration will show that d = 4.224 ft satisfies the equation.
(1.486/0.015) × (4 × 4.224) × [4 × 4.224/(4 + 2 × 4.224)]2/3 × (0.02)1/2 = 290 ft3/sec

The solution derived from the Manning formula indicates that for a rectangular channel with a width of 4 ft to effectively convey the anticipated design storm runoff of 390 ft³, the channel must possess a minimum depth of 4.224 ft. However, an additional safety factor is incorporated by providing a freeboard of at least 1 ft above the calculated water depth.

This freeboard serves as a buffer zone to accommodate potential fluctuations in flow rate or debris accumulation within the channel. Consequently, the final design depth for this channel can be established as 5 ft.

hydraulic design of open channel drainage

Critical Depth
It’s important to note that the specific formula for determining the critical depth (minimum depth for efficient flow) in a rectangular channel is yc = [q2/g]1/3. Where q is the flow per foot of width, in cfs/ft and g is 32.2 ft /sec2. In this problem,

yc = [(290/4)2/32.2]1/3 = 5.46 ft

Since the critical depth is greater than the depth of flow, the flow is supercritical.

For the geotechnical and structural design of the drainage channel, check the link below;
Geotechnical and Structural Design of Rectangular Roadside Drains

Selecting Optimal Channel Lining

Traditionally, the selection of lining material for drainage channels has relied on ensuring a flow velocity below a specific “permissible velocity” threshold to prevent erosion of the lining. However, advancements in research have revealed a more effective approach. For flexible linings, the selection criterion should prioritize the concept of “maximum permissible depth of flow” (dmax). This parameter establishes the maximum water depth the lining can safely accommodate before succumbing to erosion.

In contrast, rigid channels constructed from materials like concrete or soil-cement exhibit minimal erosion concerns under typical highway traffic conditions. Consequently, these rigid channels lack a defined maximum permissible depth based on erosion control. The primary factor influencing the final design depth for rigid channels becomes the required freeboard – the vertical distance maintained between the water surface and the top of the channel bank for safety purposes.