8.7 C
New York
Tuesday, November 12, 2024
Home Blog Page 3

Estimation of Runoff for Drainage Design

During the siting and geometric design of highways, incorporating adequate drainage systems is a critical consideration. Drainage conditions often determine the durability and performance of highway pavement structures. Therefore, highway and street drainage facilities must effectively convey water away from the pavement surface and into appropriately designed channels.

Inadequate drainage will inevitably lead to severe degradation of the highway structure. Furthermore, accumulated water on the pavement can impede traffic flow, and hydroplaning and reduced visibility due to splash and spray can contribute to accidents.

The importance of adequate drainage systems is reflected in the budgetary allocation for drainage facilities within highway construction projects. Approximately 25% of highway construction funds are designated for erosion control and drainage structures, encompassing culverts, bridges, channels, and ditches.

poor drainage affects the durability of pavements
Poor drainage affects the durability of pavements

In highway engineering, two primary water sources demand attention, which are surface water and groundwater. Surface water occurs from precipitation in the form of rain or snow. While a portion infiltrates the soil, the remaining surface water presents a potential threat to the highway pavement and requires removal. Drainage systems designed to address this concern are categorized as surface drainage.

The second source, subsurface water, refers to water flowing through the permeable zones of the soil. This becomes particularly relevant in situations involving highway cuts or areas with a high water table situated near the pavement structure. Drainage strategies employed to mitigate this source are classified as subsurface drainage.

This article is concerned with the estimation of surface water runoff from pavements and streets.

Parameters Influencing Surface Water Runoff

During the design of drainage facilities for highway construction, engineers utilise three key parameters of rainfall:

  • intensity (rate of fall),
  • duration (length of time for a specific intensity), and
  • frequency (the expected time interval between occurrences of a specific intensity-duration combination).

For example, the U.S. Weather Bureau maintains a network of automated rainfall gauges that gather nationwide intensity and duration data. This data serves as the basis for the development of rainfall-intensity curves, which are then employed to determine the rainfall intensity for a designated return period and duration.

It is important to acknowledge that any estimations of rainfall intensity, duration, or frequency derived from this data are based on the principles of probability. For instance, designing a culvert to handle a “50-year” flood implies a 1 in 50 chance of the culvert reaching capacity in a given year.

This does not guarantee a precipitation event of that exact intensity and duration will occur precisely every 50 years. In actuality, there’s a possibility of experiencing higher-intensity storms one or more times within the design period, albeit with a lower probability.

This highlights the trade-off between minimizing overflow risk and cost. Designing for infrequent storms translates to significantly larger and more expensive drainage facilities. As such, selecting a design frequency necessitates a cost-benefit analysis.

Flooded highway
Flooded highway

Capital costs for the drainage system are weighed against potential public costs associated with severe highway damage from storm runoff. Factors influencing this decision typically include the highway’s significance, traffic volume, and the surrounding area’s population density.

Beyond rainfall, several other hydrological variables are crucial for the engineer’s determination of surface runoff rates. These include:

Drainage Area: This encompasses the land surface contributing runoff to the specific location where channel capacity needs to be assessed. This is also called the catchment area. Drainage areas are typically delineated using topographic maps. Recently, Google Earth maps have been used to analyse watershed areas.

Runoff Coefficient (C): This coefficient represents the ratio of runoff to rainfall for the designated drainage area. Factors influencing the runoff coefficient include ground cover type, drainage area slope, storm duration, prior ground saturation, and overall land slope.

In cases where the drainage area consists of different ground characteristics with different runoff coefficients, a representative value Cw is computed by determining the weighted coefficient.

Cw = ∑CiAi/∑Ai

where:
Cw = weighted runoff coefficient for the whole drainage area
Ci = runoff coefficient for watershed i
Ai = area of watershed i (acres)

Typical values of runoff coefficient C are;

Type of Drainage AreaRunoff Coefficient
Downtown areas0.70 – 0.95
Neighbourhood areas0.50 – 0.70
Apartment dwelling areas 0.50 – 0.70
Light industrial areas0.50 – 0.80
Heavy industrial areas0.60 – 0.90
Parks, cemetries0.10 – 0.25
Unimproved areas0.10 – 0.30
Asphaltic pavement streets0.70 – 0.85
Concrete pavement streets0.80 – 0.95
Cultivated fields0.20 – 0.40
Steep grassed areas (2:1)0.50 – 0.70

It is important to note that a runoff coefficient of 0.75 means that 75% of precipitation in the area will translate to runoff or stormwater.

Time of Concentration (Tc): This parameter reflects the time required for runoff to travel from the farthest hydraulic point within the watershed to the point of interest. Determining the time of concentration for a drainage area is essential for selecting the appropriate average rainfall intensity for a chosen frequency of occurrence.

The time of concentration itself is influenced by several factors such as the size and shape of the drainage area, surface characteristics, slope of the drainage area, rainfall intensity, and whether the flow path is entirely overland or partially channelized.

Determination of Runoff for Drainage Design

The type of surface significantly impacts the amount of runoff generated for a given rainfall intensity and duration. Impervious surfaces like bare rock, roofs, and pavements exhibit much higher runoff rates compared to permeable surfaces such as ploughed fields or dense forests. Therefore, highway engineers strive to quantify the portion of rainfall that translates to runoff.

This task presents a challenge as runoff rates for a specific area during a single rainfall event are typically not static. Fortunately, various methods exist to estimate runoff, with the rational method being explored in this article.

Rational Method

The rational method centres on the principle that a storm’s runoff rate is dictated by three factors: average rainfall intensity, the drainage area’s size, and its surface characteristics. It’s important to acknowledge that real-world rainfall intensity isn’t uniform across large areas or throughout a storm’s duration.

To address this, the rational formula adopts the assumption that for an impervious area (A) experiencing rainfall of average intensity (I), the peak runoff rate (Q) at the drainage area’s outlet occurs when the entire area contributes runoff at a constant rate.

This necessitates a storm duration that’s at least equal to the time of concentration, which signifies the time it takes runoff to travel from the farthest point in the drainage area to the outlet. However, achieving this condition in practice can be challenging, especially for large drainage areas. Consequently, the rational formula is typically applied to relatively small drainage areas, generally not exceeding 200 acres.

The mathematical expression for the rational formula is provided below;

Q = CIA

where:
Q = peak rate of runoff (volume/time)
A = drainage area (Area)
I = average intensity for a selected frequency and duration equal to at least the time of concentration (depth/time)
C = a coefficient representing the fraction of rainfall that remains on the surface of the ground (runoff coefficient)

The units in the rational formula need to be consistent.

image

Design Example

A 120-acre (485623 m2) urban drainage area in Port Harcourt City Nigeria consists of three different watershed areas as follows.

Streets (asphalt pavement) = 10%
Apartment dwelling areas = 60%
Unimproved areas = 10%
Light industrial area = 20%

If the time of concentration for the drainage area is 1 hr, determine the runoff rate for a storm of 50-yr frequency.

rainfall intensity curves for Port Harcourt
Rainfall intensity curve for PortHarcourt (Nwaogazie et al, 2019)

From the rational formula;
Q = 0.278CIA
A = drainage area (km2)
I = rainfall intensity (mm/hr)
C = Average (weighted) runoff coefficient

Runoff coefficients
Streets (asphalt pavement) = 0.75
Apartment dwelling areas = 0.6
Unimproved areas = 0.2
Light industrial area = 0.65

Weighted runoff coefficient = Cw = [0.485(0.1 × 0.75 + 0.6 × 0.6 + 0.1 × 0.2 + 0.2 × 0.65)]/0.485 = 0.585
From the rainfall intensity graph of the City of PortHarcourt, the rainfall intensity of a return period of 50 years and duration of 1 hour (60 minutes) is 110 mm/hr

Q = 0.278 × 0.585 × 110 × 0.485 = 8.67 m3/sec

Conclusion

Drainage design for highways considers rainfall as the primary source of water. The rational method, a common tool for this purpose, focuses on three key factors: average rainfall intensity, drainage area size, and surface type.

While real rainfall varies in intensity and duration, the method assumes a constant rate of runoff from an impervious area for a storm whose duration equals the time for water to travel from the farthest drainage point to the outlet. This time is called the time of concentration. Due to limitations in achieving this ideal scenario, the rational method is best suited for relatively small drainage areas, typically under 200 acres.

The results from the rational formula can be used in sizing stormwater drainage facilities such as ditches, culverts, gutters, channels, sewer pipes, etc.

Sources and Citations
Nwaogazie IL, Sam MG. Probability and non-probability rainfall intensity-duration-frequency modeling for port-harcourt metropolis, Nigeria. Int J Hydro. 2019;3(1):66-75. DOI: 10.15406/ijh.2019.03.00164

Hydraulic Design of Open Channel Drainage Structures

The major objective in the design of an open channel highway drainage structure lies in establishing the optimal hydraulic performance. This process ensures the selection of a structure size that is not only economical but also adequate in conveying the anticipated stormwater runoff. Achieving this balance involves a good understanding of the hydraulic parameters that influence stormwater flow and runoff.

Beyond economic and size considerations, the design of open channel drainage structures must adhere to specific hydraulic requirements. These requirements are instrumental in preventing detrimental outcomes within the drainage system, such as erosion along channel walls or the undesirable accumulation of sediment within the hydraulic structure itself.

Uncontrolled erosion of the drainage structure and linings can compromise the structural integrity of the drainage system, leading to costly repairs and potential safety hazards. Similarly, sediment buildup within the structure can impede its flow capacity, potentially leading to localized flooding during heavy precipitation events.

image 35
Rectangular drainage construction

The proper establishment of the hydraulic requirements for such strucures enables engineers to design open channel drainage systems that effectively manage stormwater runoff while safeguarding the system’s longevity and functionality.

Design of Open Channels

One important design consideration for open channel highway drainage involves achieving an optimal flow velocity. This velocity should be neither excessively low, which could lead to undesirable sediment deposition within the channel, nor excessively high, which could cause erosion of the channel lining itself. The optimum velocity range depends on several factors:

Channel Geometry: The shape and size of the channel significantly influence flow dynamics. A wider and deeper channel can accommodate higher velocities without experiencing erosion compared to a narrower or shallower one.

Channel Lining: The type of material used to line the channel also plays a role. Concrete or riprap linings can withstand higher velocities compared to bare soil channels, which are more susceptible to erosion.

Flow Rate: The quantity of water being transported by the channel is another critical factor. Higher flow rates necessitate a higher velocity to maintain efficient drainage, but exceeding the recommended limits for the specific channel lining can lead to erosion.

Sediment Characteristics: The type of material suspended in the water also influences the optimal velocity. Fine-grained sediments are more prone to deposition at lower velocities, whereas coarser materials can withstand higher velocities without significant erosion risk.

Considering these factors, a channel gradient range of 1% to 5% is generally recommended for achieving the desired flow velocity. Slopes below 1% often result in excessively low velocities, leading to sediment buildup. Conversely, slopes exceeding 5% can generate velocities that cause erosion of even the most robust channel linings.

The design must also account for the discharge point where the drainage channel meets the natural waterway. A significant elevation difference between the channel outlet and the waterway can necessitate additional design considerations, such as the inclusion of energy dissipation structures to prevent scouring and erosion at the discharge point.

rectangular drainage structure

Design Principles

The basis of hydraulic design for drainage ditches lies in establishing the minimum cross-sectional area of the channel. This area must be sufficient to convey the anticipated stormwater runoff from a specific design storm event without causing overflow. Achieving this objective involves some calculations to determine the channel’s capacity.

Manning’s formula is one of the most commonly employed methods for calculating a channel’s capacity. This equation was developed on the fundamental assumption of uniform, steady flow within the channel.

v = 1.486/n × R2/3 × S1/2

Based on this assumption, Manning’s formula allows for the calculation of the average velocity (V) within the channel using the following parameters:

v = average discharge velocity (ft /sec)
R = mean hydraulic radius of flow in the channel (ft) = a/p
a = channel cross-sectional area (ft2)
P = wetted perimeter (ft)
S = longitudinal slope in channel (ft /ft)
n = Manning’s roughness coefficient

  • Manning’s roughness coefficient (n): This coefficient accounts for the frictional resistance exerted by the channel walls and lining material. Manning’s roughness depends on the type of material used to line the surface of the ditch. Rougher surfaces have higher n values, signifying greater resistance to flow.
  • Hydraulic radius (R): This parameter represents the ratio of the channel’s wetted area (the area of the channel in contact with flowing water) to its wetted perimeter (the length of the channel perimeter in contact with flowing water). A larger hydraulic radius translates to a more efficient flow conveyance.
  • Channel slope (S): This represents the inclination of the channel bed, expressed as a decimal slope (e.g., 0.02 for a 2% slope). Steeper slopes generate higher velocities.

Typical ranges of Manning’s roughness coefficient for open channels are provided in the Table below.

MaterialSurface DescriptionRange of Manning’s coefficient n
ConcreteAll sides formed, no finish0.013 – 0.017
ConcreteTrowel finish0.012 – 0.014
ConcreteFloat finish0.013 – 0.015
ConcreteFloat finish, some gravel on bottom0.015 – 0.017
ConcreteSteel formwork0.011
ConcreteWooden formwork0.015
ConcreteGunite, good section0.016 – 0.019
Asphaltsmooth0.013
AsphaltRough0.016

By incorporating these parameters into Manning’s formula, engineers can determine the average flow velocity within the drainage ditch. This velocity, combined with the desired design discharge (flow rate) for the storm event, allows for the calculation of the minimum required cross-sectional area to ensure proper drainage without overflow.

The flow in the channel is then given as;

Q = va = 1.486/n × a × R2/3 × S1/2

Types of Flow in Open Channel Hydraulic Structures

Since Manning’s formula was developed on the assumption of steady flow, it is therefore imperative to briefly discuss these types of flow. Open channel flow behaviour can be categorized into two primary classifications: steady and unsteady flow. Steady flow signifies a constant rate of discharge over time, whereas unsteady flow exhibits variations in discharge with time. Steady flow can be further subdivided based on channel characteristics into uniform and non-uniform flow.

Uniform flow manifests when the channel properties, such as slope, roughness, and cross-section, remain consistent along its entire length. Conversely, non-uniform flow occurs when these properties exhibit variations along the channel. In a scenario of uniform flow, the depth (d) and velocity (v) are considered “normal,” and the water surface slope perfectly aligns with the channel bed slope.

Achieving complete uniformity in channel properties across its entire length is a significant engineering challenge in real-world applications. However, Manning’s equation remains a valuable tool for practical solutions to highway drainage problems. This is because, in most cases, the resulting error associated with assuming uniform flow is negligible.

Another key distinction in open channel flow is the characterization of tranquil and rapid flow regimes. Tranquil flow resembles the movement of water in an open channel with a gentle longitudinal slope. In contrast, rapid flow is analogous to water cascading down a steep incline. The flow depth at which a channel transitions from tranquil to rapid flow is termed the critical depth.

When the flow depth exceeds the critical depth, the flow is classified as subcritical. This type of flow is frequently observed in streams traversing plains and broad valleys. Conversely, supercritical flow occurs when the flow depth falls below the critical depth and is often encountered in steep flumes and mountain streams. The critical depth can also be defined as the flow depth corresponding to the minimum specific energy of the system. Notably, the critical depth depends solely on the channel geometry and discharge.

The velocity and channel slope corresponding to uniform flow at critical depth are designated as critical velocity and critical slope, respectively. Therefore, during supercritical flow, the actual flow velocity and channel slope surpass the critical values, while they remain lower than the critical values during subcritical flow.

precast drainage installation

Design of an Open Channel

Designing an efficient and cost-effective open channel drainage for a highway involves a two-step process:

  1. Channel Sizing for Flow Capacity: The first step entails determining the optimal cross-sectional area for the channel. This area should effectively and economically convey the anticipated stormwater runoff generated by the design storm event to a designated natural waterway.
  2. Erosion Protection Evaluation: The second step focuses on assessing the channel’s necessity for erosion protection measures. If erosion is a potential concern, this step involves selecting the most appropriate type of lining material to safeguard the channel from scour and degradation.

The Manning formula plays an important role in the first step of channel sizing. By assuming a specific cross-section for the channel and solving the formula, engineers can determine whether the proposed channel is sufficiently large to accommodate the design storm runoff.

This solution can be obtained through manual calculations or by utilizing the relevant Federal Highway Administration (FHWA) charts. The following example will demonstrate both approaches for solving the Manning’s formula in this context.

Design Example

Determine a suitable cross section for a channel to carry an estimated runoff of 290 ft3/sec (8.21 m3/sec) if the slope of the channel is 2% and Manning’s roughness coefficient, n, is 0.015.

Solution:
Select a channel section and then use Manning’s formula to determine the flow depth required for the estimated runoff.
Assume a rectangular channel 4 ft (1.2m) wide.
Flow depth = d
Cross-sectional area (a) = 4d
Wetted perimeter (p) = 4 + 2d
Hydraulic radius R = a/p = 4d/(4 + 2d)

Q = va = 1.486/n × a × R2/3 × S1/2
290 = (1.486/0.015) × 4d × [4d/(4 + 2d)]2/3 × (0.02)1/2

Solving this equation can be complex, but a little consideration will show that d = 4.224 ft satisfies the equation.
(1.486/0.015) × (4 × 4.224) × [4 × 4.224/(4 + 2 × 4.224)]2/3 × (0.02)1/2 = 290 ft3/sec

The solution derived from the Manning formula indicates that for a rectangular channel with a width of 4 ft to effectively convey the anticipated design storm runoff of 390 ft³, the channel must possess a minimum depth of 4.224 ft. However, an additional safety factor is incorporated by providing a freeboard of at least 1 ft above the calculated water depth.

This freeboard serves as a buffer zone to accommodate potential fluctuations in flow rate or debris accumulation within the channel. Consequently, the final design depth for this channel can be established as 5 ft.

hydraulic design of open channel drainage

Critical Depth
It’s important to note that the specific formula for determining the critical depth (minimum depth for efficient flow) in a rectangular channel is yc = [q2/g]1/3. Where q is the flow per foot of width, in cfs/ft and g is 32.2 ft /sec2. In this problem,

yc = [(290/4)2/32.2]1/3 = 5.46 ft

Since the critical depth is greater than the depth of flow, the flow is supercritical.

For the geotechnical and structural design of the drainage channel, check the link below;
Geotechnical and Structural Design of Rectangular Roadside Drains

Selecting Optimal Channel Lining

Traditionally, the selection of lining material for drainage channels has relied on ensuring a flow velocity below a specific “permissible velocity” threshold to prevent erosion of the lining. However, advancements in research have revealed a more effective approach. For flexible linings, the selection criterion should prioritize the concept of “maximum permissible depth of flow” (dmax). This parameter establishes the maximum water depth the lining can safely accommodate before succumbing to erosion.

In contrast, rigid channels constructed from materials like concrete or soil-cement exhibit minimal erosion concerns under typical highway traffic conditions. Consequently, these rigid channels lack a defined maximum permissible depth based on erosion control. The primary factor influencing the final design depth for rigid channels becomes the required freeboard – the vertical distance maintained between the water surface and the top of the channel bank for safety purposes.

Depth and Rate of Consolidation Settlement of Foundations

Building foundations founded on saturated clay soils will undergo time-dependent consolidation settlement. This is due to the slow rate of porewater dissipation of clay soils due to their fineness and cohesion. This pore water dissipation is accompanied by volume change in the soil, which results in settlement. It is therefore obvious that such settlement will possess magnitude (depth), and will take some time to complete.

As an engineer or a potential property developer, it is very important to know the depth of settlement that a building foundation will possibly undergo, and the time it will take for such settlement to be complete. This is different from immediate or elastic settlement, which occurs immediately after the foundation is loaded. Immediate settlement occurs in foundations founded on sand or granular materials due to quick pore water dissipation.

In theory, primary consolidation is deemed complete when the pore water pressure is completely dissipated. The subsequent settlement response observed over time is referred to as secondary compression or creep. This phenomenon represents the volume changes within a fine-grained soil triggered by adjustments to its internal structure, the soil fabric, following the completion of primary consolidation.

It is therefore important to distinguish “consolidation” from secondary compression. Consolidation specifically refers to the settlement process that occurs within a soil due to changes in effective stresses, driven by reductions in excess pore water pressure. Notably, the rate of settlement associated with secondary compression is significantly slower compared to that observed during primary consolidation.

foundation settlement
Excessive foundation settlement can be detrimental to buildings and structures

If foundation settlement exceeds tolerable limits, the functionality of the structure for its intended purpose may be compromised, potentially leading to a reduced lifespan. Structures may experience settlement uniformly or non-uniformly. The latter scenario, known as differential settlement, often presents the most critical design consideration for engineers.

Magnitude (depth) of Consolidation Settlement

The magnitude and rate of consolidation settlement depend on the engineering properties of the clay soil, the hydraulic conductivity, the stress history of the soil, the drainage conditions (drainage path), applied pressure, and the thickness of the clay layer.

In order to calculate the magnitude of soil consolidation settlement, it is very important to carry out a one-dimensional consolidation test on an undisturbed sample obtained from the site where the building is to be constructed. It is also important to drill a borehole and develop a borehole log to ascertain the thickness and engineering properties of the different soil layers at the site. This will also help in the definition of the drainage conditions of the clay layer.

The one-dimensional consolidation test, pioneered by Terzaghi, is conducted within a specialized apparatus known as a consolidometer (or oedometer). A picture representation of a consolidometer is shown below.

consolidometer
Consolidometer

The test involves placing an undisturbed soil specimen collected from the field within a metal ring equipped with porous stones on both the top and bottom faces. Standard specimen dimensions typically consist of a diameter of 64 mm (2.5 inches) and a thickness of 25 mm (1 inch).

Load application on the specimen is achieved through a lever arm, with a micrometre dial gauge recording any resulting compression. To ensure a saturated state throughout the testing process, the specimen is submerged underwater. Each load increment is typically maintained for a 24-hour period.

Following this, the load is conventionally doubled, effectively duplicating the pressure exerted on the specimen. This cycle of load application and compression measurement is then repeated. Upon test completion, the dry weight of the specimen is determined. The experiment leads to the plotting of void ratio versus the log of pressure (e-log P curve) from which a lot of information about the compressibility of the soil can be obtained.

Typical e-log P curve

With the information obtained from the analysis of the one-dimensional consolidation test result, it is possible to calculate the probable consolidation settlement of the clay in the field. The equations for the calculation are provided below;

For normally consolidated soils,
Sc = CcH/(1 + e0) × log(σ’0 + ∆σ’)/σ’0

For overconsolidated clays where σ’0 + ∆σ is less than or equal to the pre-consolidation pressure σ’c;
Sc = CsH/(1 + e0) × log(σ’0 + ∆σ’)/σ’0

For overconsolidated clays where σ’0 + ∆σ’ is greater than the pre-consolidation pressure σ’c;
Sc = [CsH/(1 + e0) × log(σ’c /σ’0)] + CcH/(1 + e0) × log(σ’0 + ∆σ’)/σ’c

Where;
Sc = Consolidation settlement
Cc = Compression index (Cc = 0.009(LL – 10)) where LL is the liquid limit of the clay
Cs = swell index of the clay (Cs = Cc/6)
H = thickness of the clay layer
e0 = initial void ratio of the clay
σ’0 = effective overburden pressure at the middle of the clay layer
∆σ’ = increment in pressure due to the foundation load
σ’c = pre-consolidation pressure for overconsolidated soils

Rate of Consolidation Settlement

The rate of consolidation observed in homogeneous soils is directly influenced by a lot of factors such as the soil’s hydraulic conductivity (permeability), its overall thickness, and the designated length of the drainage path. Soil with a lower hydraulic conductivity will experience a longer period for the initial excess porewater drainage, consequently leading to a slower rate of settlement compared to soil with a larger hydraulic conductivity.

During soil consolidation, the length of the drainage path (denoted as Hdr) represents the maximum vertical distance traversed by a pore water particle as it exits the soil stratum. During laboratory consolidation, drainage is usually permitted on both the top and bottom faces of the soil specimen (effectively constituting double drainage conditions), the length of the drainage path, Hdr, is calculated as;

Hdr = H/2

Where H is the thickness of the specimen.

When drainage is permitted only on a single designated face of the soil stratum, the length of the drainage path, Hdr = H. Consequently, shorter drainage paths expedite the consolidation process, leading to the completion of settlement within a reduced timeframe compared to situations with longer drainage paths.

The general equation for one-dimensional consolidation according to Terzaghi is given by;

∂u/∂t = Cv(∂2u/∂z2)

Where Cv is the coefficient of volume change. This equation describes the spatial variation of excess porewater pressure (∆u) with time (t) and depth (z). The solution to the consolidation equation obtained using Fourier series is given by;

solution of consolidation

Where Tv = Cvt/Hdr is a non-dimensional parameter known as the time factor.

At the start of the consolidation process (t = 0, Tv = 0), the initial excess porewater pressure, ∆uo, is equal to the applied vertical stress imposed throughout the entire soil layer. The moment drainage commences, the initial excess porewater pressure instantly reduces to zero at the designated permeable boundaries.

Following the initiation of drainage (t > 0), the total applied vertical stress increment, ∆σz, acting at a specific depth, z, is equal to the summation of the vertical effective stress increment, ∆σ’z, and the remaining excess porewater pressure, ∆uz. Over an extended period (as time approaches infinity, t → ∞), the excess porewater pressure progressively diminishes to zero. Consequently, the vertical effective stress increment ultimately becomes equivalent to the total vertical stress increment.

We can now define a parameter, Uz, called the degree of consolidation or consolidation ratio, which gives us the amount of consolidation completed at a particular time and depth. This parameter can be expressed mathematically as;

k9


A geotechnical engineer is often concerned with the average degree of consolidation, U, of a whole layer at a particular time rather than the consolidation at a particular depth. The average degree of consolidation can be expressed mathematically from the solution of the one-dimensional consolidation equation as;

average degree of consolidation equation

The variation of the average degree of consolidation U with time factor Tv for a uniform and a triangular distribution of excess porewater pressure can be represented using the equations below.

Tv = π/4(U/100)2 for U < 60%
Tv = 1.781 – 0.933 log (100 – U) for U ≥60%

The time factors corresponding to 50% and 90% consolidation are often used in interpreting consolidation test results. You should remember that Tv = 0.848 for 90% consolidation, and Tv = 0.197 for 50% consolidation.

The time factor (Tv) provides a useful expression to estimate the settlement in the field from the results of a laboratory consolidation test. If two layers of the same clay have the same degree of consolidation, then their time factors and coefficients of consolidation are the same. Hence,

tv1

By simplification;

tv2

Solved Example

The soil profile shown below is to carry a 4m x 4m square footing carrying a service column load of 1750 kN. The clay is normally consolidated. A sample 25 mm thick, taken from the clay layer 3 m thick, was tested in an oedometer with drainage at the upper and lower boundaries. It took the laboratory sample 6 minutes to reach 50% consolidation.

(a) Calculate the consolidation settlement of the clay layer
(b) How much time would it take the 3m clay layer to achieve 50% and 90% consolidation in the field?

CONSOLIDATION SETTLEMENT CALCULATION

Solution

(a) The magnitude of the settlement

This will be calculated at the middle of the clay layer.

Step 1: Calculate the effective stress in the middle of the clay layer.
σ’0 = (16.5 × 2) + (18.5 – 9.81) × 3 + (19.5 – 9.81) × 1.5 = 33 + 26.07 + 14.535 = 73.61 kN/m2

Step 2: Calculate the increment in stress in the middle of the clay layer due to the footing load;
Pressure due to footing load = 1750/(4 × 4) = 109.375 kN/m2
The average increment in stress at a depth z = 5.1 m using 1:2 approximate method.
∆σ’ = (109.375 × 4 × 4)/(4 + 5.1)2 = 21.13 kN/m2

Sc = CcH/(1 + e0) × log(σ’0 + ∆σ’)/σ’0

H = 3m
Cc = 0.009(LL – 10) = 0.009(38 – 10) = 0.252
e0 = 0.92

Sc = (0.252 × 3)/(1 + 0.92) × log(73.61 + 21.13)/73.61 = 0.0431m = 43.153 mm

(b) The rate of consolidation

Note that in the field, drainage is only in one direction.
Drainage in the lab Hdr,lab = 25mm/2 = 12.5mm = 0.0125m
Drainage in the field, Hdr,field = H = 3m

T50 = cvtlab/Hdr,lab2 = cvtfield/Hdr,field2
tlab/Hdr,lab2 = tfield/Hdr,field2

6/0.01252 = tfield/32

Therefore tfield = 345600 minutes = 240 days

For 90% Degree of Consolidation;

cvtfield/Hdr,field2 = T ∝ U2
So,
t ∝ U2

t1/t2 = U12/U22

240 days/t2 = 502/902

t2 = 777.6 days

Therefore, it will take the clay layer 240 days to achieve 50% of the total consolidation (21.57 mm settlement). In about 777.6 days (about two years, 1 month and 17 days), 90% of the total settlement will likely be complete (40.637 mm).

Conclusion

Soil consolidation settlement is a time-dependent process influenced by the soil’s hydraulic conductivity (water flow rate), thickness, and drainage conditions. When vertical stress is applied, the soil’s pore water pressure initially increases to resist the stress. Over time, this excess porewater pressure dissipates as water drains, causing the effective stress on the soil to increase and settlement to occur.

This settlement has two parts: primary consolidation, the dominant early stage where excess porewater is squeezed out and the soil densifies, and secondary compression, a much slower later stage where the soil particles themselves gradually rearrange. The time rate of this settlement can be estimated using data obtained by the one-dimensional oedometer test in the laboratory.

With this information, the foundations of buildings and structures can be efficiently designed.

Design of Double-Cell Box Culverts

A double-cell box culvert is a type of box culvert with two major openings separated by a reinforced concrete wall. It is a prevalent type of precast or cast-in-situ concrete structure employed for conveying stormwater, drainage channels, or even small streams beneath roadways or embankments.

The reason for the adoption of double or more-celled box culverts is to efficiently convey the design stormwater without having excessive span for the culvert. Furthermore, when the height of the embankment is low, or the natural width of the waterway is so wide, a multi-celled box culvert can come in handy.

A degree of structural efficiency is achieved by partitioning a single box culvert into multiple cells. This may become a more attractive and economical alternative once the span of a single box culvert exceeds 3m. The partition walls serve as intermediate supports and reduce the span of the culvert.

multi-cell box culvert
Multi-cell box culvert

By so doing, the deflection and span bending moment on the top slab of the culvert are reduced. Furthermore, as a result of the additional constraints on the structure, there is a significant redistribution of stresses as vehicles of different sizes ply the top of the culvert.

Precast double-cell box culverts are favoured for their structural efficiency, hydraulic performance, and rapid installation compared to cast-in-place alternatives.

Precast double-cell box culverts

There are however some potential disadvantages of multi-celled culverts.

  • Clogging: The space between the two culvert cells can act as a trap for debris and sediment, particularly in areas with high bed load or heavy vegetation. This accumulation can impede water flow and potentially lead to culvert blockage.
  • Sedimentation in Widened Channels: When a natural channel is artificially widened to accommodate multiple culverts, the barrels positioned beyond the main flow path (outside the dominant channel) are more susceptible to excessive sediment deposition. This is because they may not experience the same level of water flow scouring that keeps the main channel clear.
  • Effective Span of Multiple Barrel Culverts: When calculating the total flow capacity of multiple barrel culverts placed side-by-side, the spacing between the barrels can be included in the overall span or opening length. However, this is only valid if the spacing is less than half the opening length of the individual culvert barrels. Exceeding this limit would compromise the hydraulic efficiency of the system.

This technical article discusses the critical aspects of designing double-cell box culverts, covering material selection, loading, structural analysis, and hydraulic considerations.

Material Selection

A typical double-cell box culvert will consist of the base slab, top slab, base/bottom slab, side walls, internal/partition wall, wing walls, aprons and headwalls. The box is typically constructed from precast concrete units, but they can also be constructed in situ. The box is placed on a well-prepared ground that has been blinded with concrete of specified grade and thickness.

The concrete should conform to BS EN 206-1 or relevant ASTM specifications, such as ASTM C33 for standard strength concrete or ASTM C476 for grey moving and paving concrete. The specified compressive strength will depend on the anticipated loads and burial depth of the culvert.

When designing for aggressive environments or freeze-thaw cycles, it may be necessary to incorporate additional considerations:

  • Sulfate Resistance: For sulfate-rich soils, selecting concrete with Type II Portland cement or supplementary cementitious materials (SCMs) that enhance sulfate resistance becomes crucial.
  • Freeze-Thaw Durability: Air-entrained concrete is recommended in regions susceptible to frequent freeze-thaw cycles. The entrained air voids provide space for the expansion of water during freezing, mitigating the risk of concrete cracking.

In specific situations, alternative materials like galvanized steel or high-density polyethylene (HDPE) pipes might be considered. However, these options are generally less common for double-cell box culverts due to limitations in span capabilities and live load capacity.

Hydraulic Design of Double-cell Box Culvert

Hydraulic analysis is very important to ensure the culvert has sufficient capacity to convey the anticipated flow rate without causing upstream flooding or excessive outlet velocities. Key factors to consider include:

  • Design Flow Rate: The maximum water flow rate the culvert needs to accommodate. This is determined by hydrological studies considering factors like drainage area, rainfall intensity, and return period.
  • Watercourse Slope: The natural gradient of the stream or channel flowing through the culvert.
  • Manning’s Roughness Coefficient: A value representing the frictional resistance of the culvert material to water flow.
  • Headwater and Tailwater Depths: The water depths upstream and downstream of the culvert, respectively. These depths influence the available energy head for flow through the culvert.

Hydraulic analysis software or Manning’s equation can be used to calculate the culvert’s hydraulic capacity and ensure it meets the design flow rate requirements. The software considers factors like culvert geometry, slope, and roughness coefficient to determine the flow velocity and water depth within the culvert.

Precast double cell box culvert
Precast double-cell box culvert

Loading on Double Cell Culverts

The loading on double-cell box culverts is similar to the loading on single-cell box culverts. They are;

Permanent Loads

This category encompasses all static loads acting on the structure that remain constant over time. They can be further broken down into:

  • Dead Loads: The self-weight of the structural components themselves such as the top slab, side walls, etc
  • Superimposed Dead Loads: The weight of permanent, non-structural elements placed on the structure, such as earth fill, asphalt laying, sidewalks, utility lines, railings, and fixed partitions.
  • Horizontal Earth Pressure: The lateral pressure exerted by surrounding soil masses against the structure’s buried components.
  • Hydrostatic Pressure and Buoyancy: The pressure exerted by water acting on submerged portions of the structure. Buoyancy represents the upward force acting on the structure due to water displacement.
  • Differential Settlement Effects: Uneven settlement of the foundation supporting the structure can induce additional stresses and require special design considerations.

Vertical Live Loads

These represent the dynamic vertical loads applied to the structure due to moving traffic or pedestrians. They can be further categorized:

  • HA or HB Loads on the Carriageway: These represent the standardized design vehicle loads specified in design codes, such as the AASHTO (American Association of State Highway and Transportation Officials) specifications. In Eurocode, we talk about Load Model 1, Load Model 2 or Load Model 3.
  • Footway and Cycle Track Loading: The weight of pedestrians and cyclists using designated walkways or cycle tracks on the structure.
  • Accidental Wheel Loading: Loads resulting from an errant vehicle potentially encountering a curb or edge of the structure.
  • Construction Traffic: Loads imposed by heavy equipment or vehicles used during construction or maintenance activities on the structure.
Vehicle on a box culvert

Horizontal Live Loads

These represent the dynamic horizontal forces acting on the structure:

  • Live Load Surcharge: The additional horizontal pressure exerted by vehicles during construction, service, or maintenance on the buried walls of the culvert.
  • Traction: The horizontal force generated by vehicle tyres against the structure’s surface, which can influence stability under braking or acceleration conditions.
  • Temperature Effects: Thermal expansion and contraction of the structure’s materials due to temperature variations can induce horizontal forces.
  • Parapet Collision: The impact force exerted by a vehicle colliding with the structure’s parapet wall.
  • Accidental Skidding: The horizontal force resulting from a vehicle losing traction and skidding across the structure’s surface.
  • Centrifugal Load: The outward horizontal force acting on a curved structure due to vehicle traffic negotiating the curve.

Load Combinations

The load combinations to be used in the design shall be as given in BD 37. Only combinations 1, 3 and 4 apply to this standard as follows:

(a) Combination 1
Permanent loads, Vertical live loads and Horizontal live load surcharge.

(b) Combination 3
Combination 1 plus temperature effects.

(c) Combination 4
Permanent loads and Horizontal live load surcharge plus one of the following:
i. Traction
ii. Accidental load due to skidding
iii. Centrifugal loads
iv. Loads due to collision with parapets and the associated vertical (primary) live loads in accordance with BD 37.

Structural Analysis

A thorough structural analysis is important to ensure the culvert can withstand anticipated dead and live loads. The structural analysis aims to determine the internal forces and displacements in the culvert such as bending moments, shear forces, and axial forces. Manual calculations can be adopted using methods such as;

(a) Force method
(b) Stiffness method
(c) Hardy cross moment distribution method

Commonly, structural analysis software utilising finite element analysis specifically designed for precast concrete culverts can be employed to efficiently evaluate these forces and determine the required dimensions and reinforcement for the culvert sections. The software considers various factors like span, burial depth, traffic loads, and soil properties to generate design outputs.

Design Example

The geometry of a double-cell box culvert is shown below, with an earth cushion that is 900 mm thick from the pavement. The culvert is 9 m long, and it is expected to carry Load Model 1 traffic. The ground investigation report shows the foundation material to be cohesionless soil having an angle of internal friction (φ’) = 30° and a unit weight of 19 kN/m3. Design the culvert using the following materials data.

fck = 30 N/mm2
fyk = 500 N/mm2
All concrete cover = 50 mm
Unit weight of concrete = 25 kN/m3

image 68

Unit weight of backfill material (γ) = 19.5 kN/m3.
Angle of internal friction of backfill φ’ = 30°
Earth fill over the culvert = 900 mm thick (unit weight = 19.5 kN/m3)
Road stone base = 200 mm thick (unit weight = 20 kN/m3)
Asphalt paving = 75 mm thick (unit weight = 23 kN/m3)

Loading

Consider loading on a 1 m strip of the double-cell box culvert.

(i) Self Weight
Wall thickness = 300 mm
Top and bottom slab thickness = 300 mm
Unit weight of concrete (γ) = 25 kN/m3

Self-weight of top slab = (25 × 0.30) = 7.5 kN/m2
Self-weight of bottom slab = (25 × 0.30) = 7.5 kN/m2
Self-weight of walls = 3(25 × 0.30 × 1.75) = 39.375 kN/m

Weight of culvert per metre run = 2(7.5 × 5.3) + 39.375 = 118.875 kN/m

(ii) Earth Fill Over Culvert
Weight of earth fill per metre run = (19.5 × 0.9) = 17.55 kN/m 

(iii) Road Construction
Weight of stone base = 20 × 0.2 = 4.0 kN/m
Weight of asphalt wearing course = 23 × 0.075 = 1.725 kN/m 

(iv) Vertical Traffic Loading
According to clause 10.2.1 of PD 6694-1:2011, a buried concrete structure with a depth cover Hc less than 0.6 m should be treated as a normal bridge structure and designed for traffic specified in BS EN 1991-2. When the cover exceeds 0.6m, the vertical traffic action may be considered as dispersed through the fill at an angle of 30 degrees to the vertical.

Wheel load dispersal through fill to top of culvert
Wheel load dispersal through fill to the top of culvert

When the dispersal zone of more than two wheels overlaps, the local pressure may be taken as the pressure of the most heavily loaded strip. In the figure below, PQ is the most heavily loaded segment. The load on the strip can be taken as bW1/L1 + aW2/L2. Where W1 is the load of the larger wheel and a is the overlap length. For metre strip designs, b should be taken as 1m.

Wheel load overlapping zone on box culvert
Wheel load overlapping zone on a box culvert
Load model 1 arrangement

Number of notional lanes = n1 = Int(w/3) = Int(9/3) = 3 
Notional Lane Width = 3.0 m
Width of remaining area = 9 – (3 × 3.0) = 0

UDL in Lane 1 = αq1q1k = 0.61 × 9 = 5.5 kN/m2
UDL in Lane 2 = αq2q2k = 2.2 × 2.5 = 5.5 kN/m2
UDL in Lane 3 = αq3q3k = 2.2 × 2.5 = 5.5 kN/m2

TS in Lane 1 = Q1k = 300 kN
TS in Lane 2 = Q2k = 200 kN
TS in Lane 3 = Q3k = 100 kN

Contact patch area = 400 × 400mm
Depth of wheel load dispersal to the top of the culvert = 900 mm + 200mm + 75mm = 1175 mm

Dispersed area on top of box = 400 + (2 × 1175 × tan30°) = 1757 × 1757 mm

image 26
Load Model 1 placement on the double-cell culvert

Load Model1 placement on the double-cell culvert

Maximum transverse load on strip = bW1/L1 + aW2/L2 = [(1 × 150)/1.757] + [(0.757 × 100)/1.757] = 85.37 + 43.084 = 128.45 kN/m2
Check also; 150/1.379 = 108.77 kN/m
Therefore, the overlap zone is the most critical.

Longitudinal Dispersal:
Dispersal zone width for each axle = 1.757m
Patch load for each axle = 128.45 / 1.757 = 73.1 kN/m

Load Model 2
Wheel load = 200 kN
Contact patch area = 400 × 400mm
Wheel spacing on axle = 2.0m ∴ dispersal zones do not overlap
Dispersed area on top of box = 400 + (2 × 1175 × tan30°) = 1757 × 1757 mm
Patch load for each wheel = 200 / 1.7572 = 64.78 kN/m

(v) Horizontal Surcharge Model for LM1
According to Table 6 of PD 6694-1:2011, the traffic surcharge for abutments and other buried structures may be given by a full UDL of 20Kd (kN/m2) and a horizontal line load F = 330Kd applied at the top of the structure for normal traffic category. Where Kd = Ka or K0.

For buried structures with a fill of less than 2m, a reduction factor (1 – Hc / 2)2 should be applied to the horizontal line load. Horizontal line load can be ignored when the depth of the fill exceeds 2m.

(1 – Hc / 2)2 = (1 – 1.175/2)2 = 0.17
Two line loads are applied so for a 3m lane width the load on a 1m wide strip = 0.17 × 330Kd = 56.1Kd kN.
Ka or K0 are obtained from the appropriate load case Table in Annex B.

UDL for LM1 and LM2 = 20Kd = 0.5 × 20 = 10 kN/m2
Horizontal line load = = 56.1Kd = 0.5 × 56.1 = 28 kN/m

image 28
Traffic surcharge load on earth retaining structure

Earth Pressure on Box Walls Analysis
The lateral earth pressure acting on the sidewalls originates from two primary sources:

Backfill Pressure: This pressure originates from the soil mass retained between the foundation level and the top-of-roof level. It is typically modelled as a trapezoidal load distribution.

Earth pressure coefficient at rest K0 = 1 – sinφ = 1 – sin30 = 0.5. However, according to Annex B of PD 6694-1, Kmax should be taken as 0.6 for SLS and 0.72 for ULS.

Pressure at the bottom of wall = K0γZ = 0.6 × 19.5 × 3.25 = 38 kN/m2
Pressure at the top of wall = K0γZ = 0.6 × 19.5 × 0.9 = 10.53 kN/m2

lateral pressure
Application of horizontal earth pressure load on double-cell culvert structure

Surcharge Pressure: This pressure arises from any additional load situated above the roof level, such as soil overburden or a constructed carriageway. It is commonly modelled as a uniformly distributed load (UDL).

Surcharge due to stone base = 20 × 0.2 = 4.0 kN/m2
Surcharge due to asphalt wearing course = 23 × 0.075 = 1.725 kN/m2
Total permanent load surcharge = 4 + 1.725 = 5.725 kN/m2

Horizontal surcharge load = 0.5 × 5.725 = 2.86 kN/m

image 25
Application of dead load surcharge on a double-cell culvert structure

Structural Modelling

A two-celled box culvert can be analytically modelled in two ways: as a simplified 2D frame element model or a more detailed 3D space frame model with a unit length. Regardless of the chosen method, the supporting foundation can be simulated using elastic soil springs (for a 3D space frame) or as fixed supports using a 2D frame model. Staad Pro software can then be employed to establish the finite element model.

The 3D space frame model discretizes the culvert shell using plate elements. Additional dummy beam elements can be incorporated where necessary for enhanced accuracy. Dead and live loads are applied within the model, and the resulting stresses and deformations are analyzed through finite element analysis.

Analysis Results

(1) Self-weight

Bending moment diagram of a double-cell culvert due to self weight
Bending moment diagram of a double-cell culvert due to self-weight

(2) Earth fill

earthfill
Bending moment diagram of a double-cell culvert due to earth fill

(3) Road Construction

Bending moment diagram of a double-cell culvert due to road construction

(4) Earth pressure on wall

Bending moment diagram of a double-cell culvert due to horizontal earth pressure

(5) Vertical Traffic Load

Bending moment diagram of a double-cell culvert due to vertical traffic load

(6) Traffic Surcharge

Bending moment diagram of a double-cell culvert due to traffic load surcharge

Partial Factors for Ultimate Limit State (Combination 1)

(a) Self-weight = 1.35
(b) Earth fill = 1.2 × 1.15 = 1.38
(c) Road Construction = 1.2 × 1.15 × 1.55 = 2.14
(d) Earth pressure on the wall (including surcharge) = 1.35 × 0.72 / 0.6 = 1.62
(e) Vertical traffic load = 1.35
(f) Live load surcharge = 1.35 × 0.5 / 0.5 = 1.35

When all these factors are applied, the internal forces at the ultimate limit state are shown below;

Bending moment diagram of the double-cell box culvert at ULS
Shear force diagram of the double-cell box culvert at ULS
Axial force diagram of the double-cell box culvert at ULS

Structural Design

Top Slab and Bottom Slab

Reinforcement design at midspan of span 1 (cl.6.1)
Length of span = 2500 mm
Design bending moment; MEd = 50.2 kNm/m
Effective depth to tension reinforcement;  d = h – cnom – φ/2 = 244.0 mm
K = MEd / (bd2fck) = 0.0281
K < K’ – Compression reinforcement is not required

Lever arm; z = min[0.95d, 0.5(1 + √(1 – 3.53K))]
z = 231.8 mm

As,req = MEd / (fydz) = 497 mm2/m
As,min = max(0.26(fctm/fyk), 0.0013)bd = 368 mm2/m
Asreq = max(Asreq, As,min) = 497 mm2/m

Reinforcement provided; H12@175 mm centres;
Area provided; Asp1 = 646 mm2/m

Reinforcement Design at Support
Design bending moment; MEd = 99.3 kNm/m
Effective depth to tension reinforcement;  d = h – cnom – φ/2 = 242.0 mm
K = MEd / (bd2fck) = 0.056
K < K’ – Compression reinforcement is not required

Lever arm; z = min[0.95d, 0.5(1 + √(1 – 3.53k))]
z = 229.9 mm

As,req = MEd / (fydz) = 993 mm2/m
As,min = max(0.26(fctm/fyk), 0.0013)bd = 364 mm2/m
Asreq = max(Asreq, As,min) = 993 mm2/m

Reinforcement provided; H16@150 mm centres;
Area provided; Asp1 = 1340 mm2/m

Check for combined bending and axial force

MEd = 99.3 kNm
NEd = 86.99 kN

MEd/bh2fcd = (99.3 × 10⁶)/(1000 × 3002 × 17) = 0.065
NEd/bhfcd = (86.99 × 10³)/(1000 × 300 × 17 ) = 0.017

Asfyd/bhfcd = As,min
As,min = 0.1NEd/0.87fyk = 25.55 mm2 < 0.002Ac = 0.002 × 1000 × 300 = 600 mm2

Check for Shear
Shear is considered at a distance d away from the support. As the critical sections (d from support) are close to points of contraflexure then tension can occur both on the inside and outside faces of the structure. The longitudinal tensile steel to resist shear should therefore be provided on both faces.

VEd at d from the face of the middle wall = 155.07 kN/m

VRd,c = [CRd,c.k.(100ρ1 fck)(1/3) + k1cp]b.d ≥ (Vmin + k1cp) b.d
CRd,c = 0.18/γc = 0.18/1.5 = 0.12
k = 1 + √(200/d) = 1 + √(200/242) = 1.9
Vmin = 0.035k(3/2) fck0.5
Vmin = 0.035 × (1.9)1.5 × 300.5 = 0.502 N/mm2
ρ1 = As/bd = 1340/(1000 × 242) = 0.005537 < 0.02

σcp = NEd/Ac < 0.2fcd (Where NEd is the axial force at the section, Ac = cross-sectional area of the concrete), fcd = design compressive strength of the concrete.)
Take NEd = 86.99 kN = 86990 N
Ac = 1000 × 300 = 300000 mm2
σcp = NEd/Ac = 86990 /300000 = 0.2899 N/mm2

fcd = 17 N/mm2
0.2 fcd = 0.2 × 17 = 3.4 > 0.43 ∴ OK

VRd,c = [0.12 × 1.9 × (100 × 0.005537 × 30)(1/3) + 0.15 × 0.2899] × 1000 × 242 = 151293 N = 151.293kN/m ≥ (0.502 + 0.04348) × 1000 × 242 = 122536 N = 122.536 kN/m

Since VRd,c (151.293 kN/m) < VEd (155.07 kN/m), shear reinforcement is required.
The thickness of the top slab can be increased or corner splays introduced to increase shear resistance.

Design of the exterior walls

Wall geometry
Thickness; h = 300 mm
Length; b = 1000 mm/m

Axial load and bending moments from frame analysis

Design axial load; NEd = 169.913 kN/m
Moment about minor axis at top; Mtop = 43.0 kNm/m
Moment about the minor axis at the bottom; Mbtm = 44.7 kNm/m

Effective length for buckling about minor axis; l0 = 2000 mm

Vertical reinforcement = H16@200 c/c each face (Asv = 1005 mm2/m each face)
Horizontal reinforcement = H12@200 c/c near each face

Frame analysis moments combined with moments due to imperfections (cl. 5.2 & 6.1(4))
Ecc. due to geometric imperfections;  ei = l0 /400 = 5.0 mm

Minimum end moment about minor axis;                
M01 = min(abs(Mtop), abs(Mbtm)) + eiNEd = 43.8 kNm/m

Maximum end moment about minor axis;               
M02 = max(abs(Mtop), abs(Mbtm)) + eiNEd = 45.5 kNm/m

Design moment about the minor axis;                           
MEd = max(M02, NEd × max(h/30, 20 mm)) = 45.5 kNm/m

Position of neutral axis; z = 56.7 mm

Concrete compression force (3.1.7(3));                  
Fc = hfcdmin(max(lsbz, 0 mm) , h)b = 771.3 kN/m

Moment of resistance;                                                
MRdc = Fc [h / 2 – (min(lsbz , h)) / 2] = 98.2 kNm/m

Force in tension face bars; Fs =-437.1 kN/m
Force in compression face bars; Fs’ = -164.9 kN/m

Resultant concrete/steel force; F = Fc + Fs + Fs’ = 169.2 kN/m
This is within half of one percent of the applied axial load therefore say OK

Moment of resistance of tension face bars;            
MRds = Fs(d – h/2) = -35.0 kNm/m

Moment of resistance of compression face bars;  
MRds’ = Fs’(h / 2 – d’) = -13.2 kNm/m

Combined Moment of resistance about minor axis;                  
MRd = MRdc + MRds’ – MRds = 120. kNm/m < 45.5 kNm/m. Okay

Calculation shows that the crack width due to SLS effects is 0.184mm which is okay.

Design of the Internal Wall

Wall Thickness; h = 300 mm
Length;  b = 1000 mm/m
Stability about minor axis;  Braced

Design axial load; NEd = 423.7 kN/m
Moment about minor axis at top; Mtop = 0.0 kNm/m
Moment about minor axis at bottom; Mbtm = 0.0 kNm/m

Vertical reinforcement = H16@200 c/c each face (Asv = 1005 mm2/m each face)
Horizontal reinforcement = H12@200 c/c near each face

Frame analysis moments combined with moments due to imperfections (cl. 5.2 & 6.1(4))
Ecc. due to geometric imperfections; ei = l0 /400 = 5.0 mm

Minimum end moment about minor axis;                
M01 = min(abs(Mtop), abs(Mbtm)) + ei × NEd = 2.1 kNm/m

Maximum end moment about minor axis;               
M02 = max(abs(Mtop), abs(Mbtm)) + ei × NEd = 2.1 kNm/m

Design moment about minor axis;                           
MEd = max(M02, NEd × max(h/30, 20 mm)) = 8.5 kNm/m

Moment of resistance;
MRdc = Fc [h / 2 – (min(lsbz , h)) / 2] = 111.1 kNm/m

Force in tension face bars; Fs = -437.1 kN/m
Force in compression face bars; Fs’ = -41.0 kN/m

Resultant concrete/steel force; F = Fc + Fs + Fs’ = 421.6 kN/m
This is within half of one percent of the applied axial load therefore say OK

Moment of resistance of tension face bars;            
MRds = Fs(d – h / 2) = -35.0 kNm/m

Moment of resistance of compression face bars;  
MRds’ = Fs’ (h / 2 – d’) = -3.3 kNm/m

Moment of resistance about minor axis;                  
MRd = MRdc + MRds’ – MRds = 142.8 kNm/m
PASS – The moment capacity exceeds the design bending moment.

Detailing

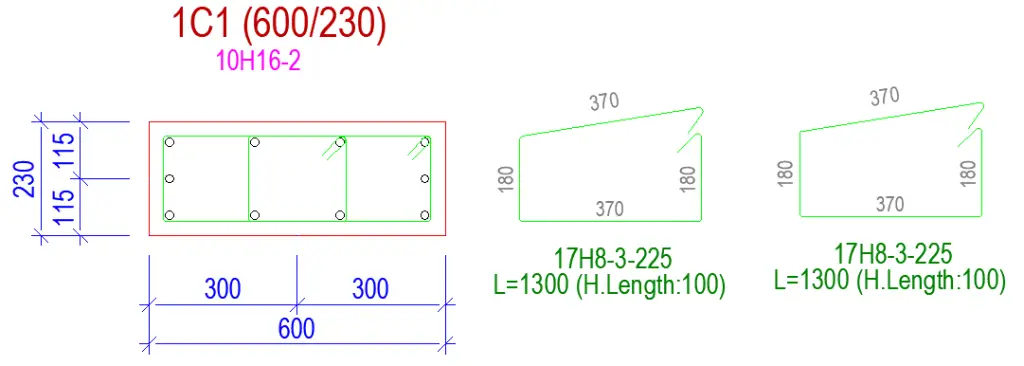
Reinforcement detailing of a double cell box culvert
Reinforcement detailing of a double-cell box culvert

Design Considerations and Best Practices

  • Selection of Culvert Size: For precast double-cell culverts, standard unit dimensions are available from manufacturers. For in-situ culverts, the standard dimension is established on-site through standard setting out procedure. The chosen size should provide sufficient hydraulic capacity while optimizing material utilization and construction costs.
  • Joint Design: The joints between precast units are critical for maintaining watertight integrity and structural continuity. Common joint designs include tongue-and-groove, gasketted, or belled-end configurations for precast culverts. Water bars may be integrated for cast in-situ culverts The chosen joint detail should be compatible with the anticipated loads and ensure effective load transfer between units.
  • Bedding and Backfill: The culvert must be properly bedded on a stable foundation material to distribute loads evenly and prevent settlement. Select granular backfill materials are typically used to surround the culvert and provide lateral support. The backfill material should be compacted according to design specifications to ensure adequate load transfer and minimize the risk of differential settlement.
  • Headwalls and Wingwalls: Headwalls and wingwalls are often incorporated at the inlet and outlet ends of the culvert to provide erosion protection, guide flow, and retain the surrounding soil mass. These structures can be constructed from precast concrete units, cast-in-place concrete, or masonry materials.

Stress Distribution in Soil: Practical Applications in Design and Construction

Just like every other material on earth, soils respond to externally applied load by developing stresses and strains within their material structure. The analysis of stress distribution in soils is concerned with the variation of pressure in soils due to external loads. Two primary factors contribute to stress within soil formations:

(a) the self-weight of the soil itself, often referred to as self-weight or overburden pressure, and
(b) external structural loads applied either at the surface or within the subsurface layers.

A good understanding of how stresses are transmitted and distributed through large soil masses is important in design scenarios involving soils in different engineering applications. Examples include the transmission of wheel loads through embankments to culverts below, the distribution of foundation pressures within soil strata beneath building footings, the transmission of pressures from isolated footings to retaining walls, and the transmission of wheel loads through stabilized pavements to the subgrade layers below. In these scenarios, the stresses propagate both downwards and laterally within the soil mass.

Figure 1: Different types of stresses in soils

The accurate estimation of vertical stresses caused by external loads on a soil mass is important for predicting settlements in structures like buildings, bridges, and embankments. Traditionally, the theory of elasticity has been used to determine these stresses. This theory focuses on the relationships between stresses (forces acting on a material) and strains (deformations caused by those forces). According to elasticity, these relationships are constant.

However, the key requirement for applying this theory isn’t that the soil itself is perfectly elastic, but rather that stresses and their corresponding strains remain proportional. While soil only exhibits this proportionality at relatively low-stress levels, fortunately, the stresses transmitted from typical structural loads also tend to be low. This fortunate coincidence allows the use of elasticity theory for soil stress distribution to provide reasonably accurate results.

In this article, we are going to consider the increment in stress or stress distribution in soils due to;

(a) point loads,
(b) strip loads, and
(C) rectangular loads

Common Methods for Calculating Stress Distribution in Soil

The Boussinesq and Westergaard theories are widely used to analyze how stress is distributed within soil. These theories were initially developed for point loads. Later, the point load solutions were extended to calculate stresses under various other load shapes, including uniform strip loads, uniformly loaded circular areas, and uniformly loaded rectangular areas.

In 1885, Boussinesq employed the mathematical theory of elasticity to analyze stresses caused by a point load on a specific type of material. Boussinesq’s theory is the most popular and has been extensively applied to various geotechnical problems. This material exhibits the following characteristics:

  • Homogeneity: Consistent properties throughout its volume.
  • Elasticity: Deformation under stress with a return to its original shape upon stress removal.
  • Isotropy: Identical properties in all directions at a given point.
  • Semi-infinite extent: Infinitely deep with a flat top surface (analogous to soil extending downwards forever).

Boussinesq’s theory is based on the following key assumptions:

  1. Material Properties: The soil behaves as an elastic, homogeneous, isotropic, and semi-infinite medium, extending infinitely in all directions from a flat surface. (Homogeneity implies identical properties at all points in the same direction, while isotropy implies identical elastic properties in all directions at a single point.)
  2. Stress-Strain Relationship: The material follows Hooke’s Law, which describes a linear relationship between stress and strain.
  3. Self-Weight Neglect: The weight of the soil itself is disregarded.
  4. Initial Stress State: The soil is initially free of any stresses before the point load is applied.
  5. Volume Change Neglect: Changes in soil volume due to loading are considered negligible.
  6. Top Surface Conditions: The top surface is free of shear stresses and experiences only the point load at a specific location.
  7. Stress Continuity: Stresses within the medium are assumed to be continuous, meaning there are no abrupt jumps in stress values.
  8. Stress Symmetry: The distribution of stresses is considered symmetrical with respect to a vertical axis (Z-axis).

Calculating Geostatic Stress

The vertical stress in soil caused by its own weight, also known as geostatic stress, can be determined using the following equation:

σz = γz ——- (1)

where:

  • σz represents the vertical stress in the soil at depth z due to self-weight.
  • γ represents the unit weight of the soil.

When external structural loads are applied to the soil, the total stress at a point is the sum of the geostatic stress and the stress caused by the structural loads. This can be determined by algebraically adding the two stress values.

Point Loads

A point load, or a concentrated load applied at a single point is not a very realistic loading scenario in practice, since all practical loads are distributed over an area no matter how small it may be. However, analyzing point loads proves valuable for most problems in geotechnical engineering.

Several practical scenarios can be idealized as point loads for analysis purposes. Here are some examples:

  • Single column on soil: The pressure exerted by a building column, pole, or a pylon on the underlying soil can be approximated as a point load, especially for slender columns.
  • Anchor Load: The pull exerted by a soil anchor on the surrounding soil mass can be idealized as a point load acting at the anchor’s embedded depth.
  • Pile Tip Load: The force transferred from a pile (a long, slender foundation element) to the soil at its tip can be simplified as a point load, particularly for short piles.
  • Cone Penetrometer Test: This test uses a cone-shaped tip pushed into the soil to measure its resistance. The force applied by the penetrometer can be considered a point load for analysis of soil behaviour around the cone.
  • Sparse Traffic: In some situations, the weight of a single vehicle on a large soil area (like a wide embankment) might be simplified as a point load for initial stress distribution analysis.

It’s important to remember that these are idealized representations. Real-life scenarios involve footings with finite areas, distributed anchor forces, and pile shafts transferring load along their length. However, using point load approximations helps engineers understand the fundamental behaviour of soil under concentrated loads and serves as a stepping stone for analyzing more complex loading conditions.

Stress distribution in an elastic medium due to a point load
Figure 2: Stress distribution in an elastic medium due to a point load

The expression obtained by Boussinesq for computing vertical stress σz, at a depth z (Figure 2) due to a point load P is;

Boussinesq equation for computing vertical stress σz, at a depth z due to a point load P

Solved Example 1:
A concentrated load of 2500 kN acts on the surface of a homogeneous soil mass of a large extent. Find the stress intensity at a depth of 8 meters.

(a) directly under the load, and
(b) at a horizontal distance of 5 metres.

Solution

(a) Directly under the load:
r = 0, therefore r/z = 0
z = 8 m
P = 2500 kN
∆σz = 3P/2π × [z3/(r2 + z2)5⁄2]= (3 × 2500)/2π × 83/(02 + 82)5⁄2 = 18.65 kN/m2

(b) At a horizontal distance of 5 metres:
r = 5 m; z = 8 m
∆σz = 3P/2π × [z3/(r2 + z2)5⁄2]= (3 × 2500)/2π × 83/(52 + 82)5⁄2 = 8.18 kN/m2

Strip Loads (finite width and infinite length)

Strip loads, representing long, uniformly distributed loads over a width, are a common scenario for analyzing building foundations, retaining walls, and embankments. This scenario represents a plane strain condition, where deformations occur primarily in a single plane. This is typical for elongated structures like strip foundations, retaining wall foundations, embankments, and dams.

In such structures, the stress distribution within a specific section (excluding the end sections within 2-3 times the width from the ends) remains consistent across neighbouring sections. This holds true as long as the load doesn’t change in directions perpendicular to the analyzed plane.

Vertical stress caused by a flexible strip load
Figure 3: Vertical stress caused by a flexible strip load

The equation introduced earlier for a point load’s vertical stress increase can be applied to determine the vertical stress caused by a wider, flexible strip load of width B (refer to Figure 3). Imagine the load applied to the strip in Figure 3 is uniformly distributed with intensity q per unit area.

Now, let’s consider a tiny slice of this strip with an infinitesimal width dr. The load acting on this small section can be represented as qdr (load per unit length). Because of its narrow width, we can treat this elemental strip as a line load. To calculate the vertical stress increase, we need to substitute qdr for q and (x r) for x. So,

c9ORHBfRm yRznIyvK9Yex4Psx

The total increase in the vertical stress (∆σz) at a depth z caused by the entire strip load of width B can be determined by integration of the equation above with limits of r from +B/2 to –B/2, or;

EcIVCkgn1xN1wUWqJrwRnA0EYiAcTbn4ufDURRy8ALKMmr1KGVS 8p sOWZDOeP2BH PhQcAILtfhx4hAS mEFJdNLvXh7ySm2qSq mCbhMGHEZfOWFM0NNKZ06k6N1CO0fRvjZjRjcopbG4Oqnbow

The Table below shows the variation of ∆σz with 2z/B for 2x/B. This table can be used conveniently for the calculation of vertical stress at a point caused by a flexible strip load.

KV8DSHpgU1ngjSBgsG5ygIqzYNMmx9wEHA5MwkKNoXLaGdKryi4N q6jXCrWWN9q8Qsh vy7gJs3m2GgP2 E6VmU40wdhbQrTI3o1toMnZFJWrlNlRj53ez0LAWhtUQfBCyMsv9ngWwGfHvSIt LXc
MeoxFTfFyDXd1JHRu7VAsCaT5dQI7zoi0cKea4RM Jk8ERoSJIb7V SLSEKl LgnAoER7dqLxiamSPLlJeW9ZVy9ynQre5fqw3OIwIvw0KWNH1HM
pi6UfuAYabbKzVZmwQeYPPIpjqH3NpvdJXdSlgiHz 9nlR XNkLpDN5Pi7I zN9eJ5 uOvlCy0KZm5r4Cu QCYJQIymO8vTEr6Cb20w 1lrZRvAY3xCm7f

Solved Example 2
A strip footing of width B = 3m is subjected to a uniform pressure load q = 250 kN/m2. At a depth of z = 4 m, determine the vertical stress increase at x = 3, and 0 m.

Solution
q = 250 kN/m2
z = 4m
B = 2m

At x = 3m
2x/B = (2 × 3)/3 = 2.0
2z/B = (2 × 4)/3 = 2.67

∆σz /q = 0.208

Dsz = 0.208 × 250 = 52 kN/m2

At x = 0 m (at the centre of the footing)
2x/B = (2 × 0)/3 = 0
2z/B = (2 × 4)/3 = 2.67

∆σz /q = 0.442

∆σz= 0.442 × 250 = 110.5 kN/m2

Rectangular Loads

In foundation engineering, rectangular areas are a more common load shape, especially for building foundations. By applying the concept of integration, engineers can determine the vertical stress at a point beneath a uniformly loaded rectangular area. This calculation can be based on either Boussinesq’s or Westergaard’s solutions for a point load.

Newmark (1935) specifically addressed this issue by deriving an expression for the vertical stress at a point located below the corner of a uniformly loaded rectangular area.

rRQLBwUBsu8rDriZ2WHeRYBC6HjGxC82FnAEIN7
Figure 4: Vertical stress at the corner of a uniformly loaded rectangular area

The following are the two popular forms of Newmark’s equation for σz:

qIMmvONeg91Ou5b06NDvc3ZoXDQ1NxSZkPDsBMgBMNvW7k nXrlIpqCDhq7jQE5mBrY6gQI4EUixfxAwUTlyAntKI9xlOEWm50LKMYs B8Ouw94dqqtRT UQSIMixQWowVNwx cA2MztE4zOzcm5W o

where m = B/z and n = L/z.

The second term within the brackets is an angle in radians. It is of interest to note that the above expressions do not contain the dimension z; thus, for any magnitude of z, the underground stress depends only on the ratios m and n and the surface load intensity. Since these equations are symmetrical in m and n, the values of m and n are interchangeable. The Equation for stress due to rectangular load may be written in the form:

σz = q. Iσ

where Iσ = Influence value

Fadum (1941) built upon Newmark’s formula (for corner stress under a rectangular load) by creating a chart (Figure 5). This chart displays “influence values” for various combinations of parameters (m and n) that define the rectangle’s proportions relative to the depth (z) and width (B).

Fadum's chart
Figure 5: Fadum’s chart

The principle of superposition allows us to determine the vertical stress at the centre of a uniformly loaded rectangle using the known influence value for a corner. This involves dividing the rectangle into four identical quadrants and applying the influence value for a single quadrant (corner stress divided by four). The same principle can be extended to calculate stress at other points by considering appropriate subdivisions and influence values.

Solved Example 3
A raft foundation of size 12 m x 16m provides an average pressure of 55 kN/m2. Determine the vertical stress increment at a point 8 m below the centre of the loaded area, and at the corner of the foundation using Boussinesq’s theory.

Solution
(a) At the corner of the footing
L = 16 m
B = 12 m
z = 8 m

m = B/Z = 12/8 = 1.5
n = L/z = 16/8 = 2.0

From Fadum’s chart;
Iσ = 0.223
∆σz= 0.223 × 55 = 12.28 kN/m2

(b) At the centre of the footing (divide the foundation into four equal parts)
L = 8 m
B = 6 m
z = 8 m

m = B/Z = 8/8 = 1.0
n = L/z = 6/8 = 0.75

From Fadum’s chart;
Iσ = 0.154
∆σz= 4 × 0.154 × 55 = 33.88 kN/m2

Average pressure at 8m depth = (33.88 + 12.28)/2 = 23.08 kN/m2

Compare stress increment using the famous 1:2 method.

The average vertical stress at depth z = 8m is obtained as:

o9qh iNtW LHzc1jBJf0 un4Ki3 Ze4Q3UTWJp9 OmTX2xpfGwuhG3Q1CDlrTCmyzRtUiHB7ENt 0ab8nhesYzwDSrcWgs9Wb6YM0EwZa

∆σz,average = (55 × 16 × 12)/[(16 + 8) × (12 + 8)] = 10560/480 = 22 kN/m2

Conclusion

Understanding stress distribution in soil due to different types of loading is important for safe and efficient foundation design and geotechnical analysis. Theoretical methods based on Boussinesq’s solutions and influence charts provide valuable tools for engineers. However, recognizing the limitations of these methods and considering the complexities of real soil behaviour is essential for accurate and reliable engineering practices.

Factors to Consider When Selecting Surveying Equipment

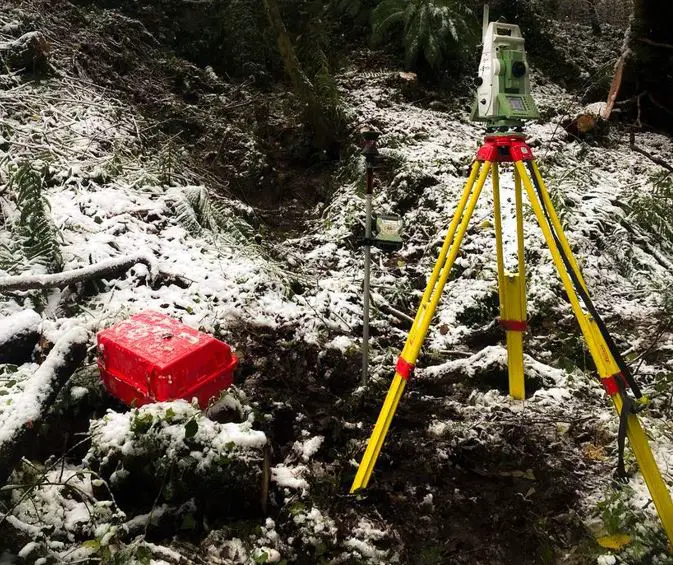
Surveyors play an important role in construction projects. From super highways to airport construction, and simple buildings to sophisticated highrise buildings, the role of surveyors cannot be overemphasised in the construction industry.

In construction projects, they use precise surveying equipment and measurements to establish property lines and acquire detailed data on the land’s topography. This information, including the shape and elevation of the earth’s surface, is important for engineers and architects during the design phase and serves as the foundation for successful construction. The services of a surveyor are also very important in setting out buildings and establishing levels during building construction.

Because of how significant a role they play, they charge a lot for their services. To do the best job possible, they use high-tech surveying equipment. This article will tell you what to consider if you are planning on buying some in order to establish yourself as a surveyor.

image 42
Surveyors are important in the construction sector

Types of Surveying Equipment

Here’s a list of some of the key equipment surveyors use in the construction industry:

Total Stations
A total station is a versatile electronic theodolite that integrates an electronic distance meter (EDM) and microprocessor. It automates many surveying tasks, allowing for highly precise measurements of angles, distances, and elevations. Surveyors use total stations for various tasks such as setting out building foundations, staking property lines, and collecting topographic data.

The total station is a sophisticated surveying equipment

GNSS (Global Navigation Satellite System) Equipment
GNSS receivers, also known as GPS (Global Positioning System) receivers, utilize satellite signals to determine a surveyor’s precise location on Earth. This technology is particularly valuable for large-scale construction projects or those requiring high accuracy in geospatial positioning.

image 39
GNSS is an important surveying equipment

Levelling Instrument (dumpy levels)
Surveyor’s levels are instruments used to establish horizontal datums or reference planes. These instruments typically consist of a telescope mounted on a tripod with a levelling bubble. By sighting through the telescope and adjusting the levelling screws, surveyors can establish level lines and determine elevation differences between points.

image 43
Dumpy level

Prisms and Reflectors
Prisms and reflectors are specialized targets that return light signals from total stations. They enhance the accuracy and range of the EDM measurements, especially over long distances.

Data Collectors and Field Computers
Data collectors are handheld computers specifically designed for field data collection in surveying applications. They allow surveyors to record, store, and process field measurements and observations electronically. Data collectors often integrate seamlessly with total stations and GNSS receivers for efficient data transfer.

surveying data collector
Data collector

Measuring Tapes and Wheels
While total stations and GNSS equipment provide exceptional accuracy for long distances, tape measures and measuring wheels remain essential tools for short-distance measurements, particularly for confined spaces or intricate details.

image 40
Measuring wheel

Tripods and Staffs
Tripods provide stable platforms for mounting surveying instruments like total stations, levels, and prisms. Surveying staffs are graduated poles used in conjunction with levels for determining elevation differences.

Factors to Consider When Selecting Surveying Equipment

This article will tell you what to consider if you are planning on buying some surveying equipment in order to establish yourself as a surveyor.

Digital Products

A surveyor doesn’t just use physical equipment to inspect construction sites. They also use software. They make use of computer-aided design (CAD) software to visualize the properties they are surveying. CAD programs allow surveyors to create virtual copies of the places they are working on, allowing them to be a lot more accurate.

The professionals over at Carlson Equipment make clear on their site that you need the best software you can get. Don’t settle for anything less than perfect. By investing in the highest-quality software you can afford, you ensure that you are able to satisfy your clients and do the best job possible. As a contractor, your main priority should be customer satisfaction. If you do not have access to quality software, that’s not something you are going to be able to ensure. Unhappy customers are bad for business.

Accuracy Needs

The level of precision required for your project is paramount. High-rise buildings or projects with tight tolerances demand more accurate equipment like total stations with higher angular and distance measurement capabilities instead of theodolites. Therefore, the degree of accuracy required influences the choice of surveying equipment to purchase, hire, or utilise for any given construction project.

Project Scale and Complexity

Large-scale projects or those spanning vast areas might benefit from GNSS technology for efficient data collection. Conversely, smaller, intricate projects might prioritize the portability and flexibility of total stations.

Terrain and Accessibility of Site

Rugged terrain or heavily forested areas might limit the effectiveness of GNSS due to signal obstruction. Total stations with long-range capabilities can be advantageous in such scenarios. Therefore, surveyors working in remote areas or heavily forested areas will definitely need to reconsider their choice of equipment.

image 41

Furthermore, it is important to consider the ease of access within the work site. For confined spaces or areas with limited manoeuvrability, lighter and more portable equipment like handheld GPS units or total stations might be preferable.

Online Reviews

The next thing you need to think about is customer feedback. When you are planning on making an online purchase of survey equipment, the best thing you can do is perform extensive online research. Always read the reviews of products you are considering buying because they will give you insight into what they are going to be like to use, helping you to decide whether they’re right or wrong for your business.

Consider Cost

Beyond reviews, you also need to think about cost. The cost of the products you buy needs to be in line with your company’s budget. The equipment used by surveyors can be very expensive. Spend some time working out a budget so that you know how much you can afford to spend. Going into any professional purchase requires a budget. Overspending can cause major problems for your company. If your budget isn’t especially large, consider finance.

Finance Arrangements

Surveying equipment can range significantly in cost. Total stations and GNSS receivers represent higher investment options but offer superior accuracy and data collection capabilities. Balancing project needs with budget constraints is very important.

Finance is a great option for people who want to buy new equipment but don’t have enough money to pay upfront. A finance arrangement is when you pay in instalments by using credit. You’ll need a good company credit score in order to be eligible for finance. You also need to be able to afford to make repayments on time. Missing even a single one can cause major problems.

Expertise and Availability of Crew

The chosen equipment should align with the skillset and experience of your surveying crew. If your team is proficient in operating total stations, it might be a more cost-effective choice compared to GNSS which might require additional training.

Equipment availability is another factor. Renting specialized equipment for specific tasks might be more economical than purchasing for infrequent use.

Software Compatibility

Ensure compatibility between the surveying equipment and the data collection and post-processing software your team utilizes. Seamless data transfer and integration streamline workflows and enhance efficiency.

Durability

Surveying equipment is often used in harsh environments. Investing in rugged and weatherproof tools minimizes downtime and ensures reliable performance.

Brand Reputation and Service

Consider the brand’s reputation for quality and readily available after-sales support when making your selection.

By carefully considering these factors, you can select the most appropriate surveying equipment that effectively meets your project requirements, optimizes workflows, and delivers cost-effective solutions for your construction projects.

Timber Framed Building Construction

Timber framed buildings are buildings whose structural members such as beams, columns, decking, and roofs are constructed using natural or engineered wood/timber materials. Among other construction materials such as steel and concrete, timber is distinguished by its comparatively low weight and superior carbon footprint.

The low-weight characteristic of timber framed buildings translates to several advantages in construction such as ease of handling during construction and reduced dead load of the structure. This means cheaper labour during erection and cheaper foundation costs for the building.

Timber framed building construction

Furthermore, timber exhibits a favourable strength-to-weight ratio, signifying its ability to bear significant loads relative to its mass. Additionally, it possesses adequate stiffness in proportion to its strength, which enhances its structural stability.

The distribution of buildings constructed with timber varies across the world. There is a lot of encouragement for the adoption of wood as a construction material, especially due to its environmental friendliness compared to concrete and steel. Recently across the world, modern tall buildings and bridges are being constructed using timber.

Norway currently holds the record of constructing the world’s tallest timber building, Mjøstårnet, a mixed-use tower designed by Voll Arkitekter and built by Hent and Moelven Limtre. This impressive structure, reaching 85.4 meters in height, utilizes a glue-laminated timber (glulam) frame with CLT wall panels for secondary load-bearing purposes.

The modern uses of timber in the construction industry extend beyond high-rise construction. Australia, for instance, predominantly utilizes lightweight framing in its construction practices, with timber and steel being the favoured materials. Notably, timber offers a significant environmental advantage.

When compared to sawn timber, steel, concrete, and aluminium, timber demonstrably releases the least amount of carbon during construction. Additionally, timber stands out as the sole building material that actively stores carbon.

New Zealand mirrors Australia’s preference for timber construction, with timber frame construction dominating residential projects. Timber framing for residential buildings boasts a dominant market share of approximately 90% compared to alternative framing methods such as steel, masonry, or concrete.

A good number of residential homes are constructed using timber

France has taken a bold step towards promoting sustainable building practices. In 2021, the French government mandated that all new public buildings must incorporate at least 50% timber or other natural materials in their construction, with implementation commencing in 2022.

This global overview underscores the burgeoning interest in timber construction and its potential to contribute to a more sustainable built environment. From record-breaking high-rises to widespread residential applications, timber is proving to be a versatile and environmentally friendly construction material. As innovation continues and regulations evolve, the future of timber construction appears bright.

Demand and Supply of Wood for Building Construction

The availability of wood for timber construction varies significantly across the globe, influenced by factors like forest cover, harvesting practices, and economic development. The United States, Canada, and Mexico boast vast coniferous (softwood) forests, making them major timber producers. In Europe, countries like Sweden, Finland, and Norway also have extensive coniferous forests and well-developed forest management systems, ensuring a steady supply of high-quality timber for construction.

According to the UK government, the UK is the third largest importer of timber and timber products in the world. However, by leveraging robust quality control procedures and streamlined industrial manufacturing processes, the high cost associated with imported timber in some countries can be effectively mitigated by factory prefabrication of complete wall, floor, and roof units.

This prefabrication approach leads to further advantages on the construction site. The use of mobile cranes and semi-skilled labour for a streamlined assembly process affords a significant reduction in overall construction time. The process of prefabricating structural units in timber eliminates the dependency on highly skilled carpentry on-site. This approach streamlines the construction process, as all joints can be efficiently secured using nails.

Prefabrication has so many advantages for timber framed buildings

While the cost of timber in some countries might be considered a disadvantage, it is essential to acknowledge other aspects:

  • Fire Resistance: Timber with smaller dimensions (less than 150mm x 100mm) exhibits limited fire resistance due to the insufficient material volume for charring, which would otherwise protect the inner structure. This limitation can be effectively addressed by employing non-combustible cladding materials, such as internal plasterboard and external facing brick.
  • Hygroscopic Nature: Timber is hygroscopic nature, which means it readily absorbs and releases moisture. This can contribute to decay in environments with high humidity. However, this concern can be mitigated through proper moisture management strategies during construction.

    Techniques such as installing the timber in a dry state, incorporating damp-proof courses (DPCs), and utilizing vapour control layers can significantly reduce the risk of dampness penetration and subsequent decay.

Sustainability of Timber Buildings

When it comes to sustainability in construction, timber performs better compared to concrete and steel. Timber is a renewable resource, with sustainably managed forests ensuring its continued availability. During its growth, timber acts as a carbon sink, actively sequestering carbon dioxide from the atmosphere.

This carbon storage remains trapped within the wood even after it’s harvested for construction, offering a significant embodied carbon benefit over concrete and steel, which both produce substantial carbon emissions during their manufacturing processes. Furthermore, the use of timber often translates to less energy-intensive construction methods, like prefabrication, further reducing the overall environmental footprint of timber-framed buildings.

However, sustainable timber practices are important. Sourcing timber from certified forests that prioritize responsible harvesting and reforestation is essential to maintain the environmental benefits. Additionally, proper treatment and protection of timber during construction and throughout the building’s lifespan are necessary to ensure its durability and minimize the need for replacements, which would negate the initial carbon sequestration advantage.

In essence, the core of a timber-framed building is the frame itself, typically constructed from seasoned, high-quality lumber. Here’s a breakdown of the key components:

  • Posts/columns: These vertical members carry the main weight of the structure, transferring loads from the roof to the foundation. Sizes vary depending on the building design and load requirements.
  • Beams: These horizontal members span between posts, supporting the floor and roof loads. Beam sizes are determined by the span length and intended load.
  • Braces: Diagonal members provide lateral stability to the frame, resisting wind and seismic loads. Bracing can be installed in various configurations, such as X-braces or knee braces.
  • Lintels: These horizontal members are placed above openings like windows and doors to support the wall loads above the opening.
  • Connectors: Metal connectors, such as plates, brackets, and nails, are used to join timber members securely, creating a rigid and stable frame.
image 18

Timber Frame Construction

There are two distinct forms of timber frame:

  • Balloon
  • Platform

Both configurations are constructed upon a foundation consisting of either masonry or concrete walls. The selection for the ground floor can be either a suspended timber floor or a solid concrete slab.

For suspended timber floors, as illustrated below, both balloon and platform styles commence with a “ring beam” built upon a wall plate. The ring beam and wall plate are then securely fastened to the underlying masonry base using rag bolts. This ring beam can be comprised of either a singular timber or two timbers joined by nails.

image 4
Timber joisted floor as a base for traditional timber frame building.

Solid concrete floors, as detailed below, offer two potential foundation options. The first option utilizes a separate floor slab constructed upon a masonry wall. The second option employs a single-poured concrete structure that incorporates the foundation, wall, and floor slab into a single element.

image 5
Starting a timber frame building off a concrete floor slab.

As prevalent in the United States of America and Canada, poured concrete walls can be utilized to create basements or semi-basements. This approach eliminates the need for a timber ring beam. Instead, the wall plate is securely fastened using rag bolts directly to the edge of the concrete floor slab.

image 16
Construction of a timber frame from masonry foundation

In traditional timber ring beam construction, a sole plate comprised of two timbers laid flat was typically installed. Conversely, when employing a wall plate on a concrete floor edge, a single-layer sole plate is enough. Regardless of the method, vertical studs were then erected, with their height determined by the chosen construction style (balloon or platform).

Platform construction involves utilizing studs measuring one story in height. Floor joists are positioned atop these studs to create a platform. Subsequently, another sole plate is installed, followed by additional studs for the next story.

Balloon framing, in contrast, utilizes studs spanning two stories. Acquiring timbers of sufficient length for exceeding two stories is generally impractical. The intermediate floor is then connected to the midpoint of the studs.

image 6

Both approaches incorporate a degree of prefabrication, typically performed on-site. This process usually involves securing studs to a single layer of the sole plate for a complete wall section.

image 7

The studs are then capped with a single runner, all assembled on the ground or floor slab. Bracing elements, constructed from thin, wide timber, are slotted into recesses formed within the sole plate, studs, and runners. Additionally, dwangs are incorporated at approximately 750 mm intervals along the stud height.

Finally, the completed frame section is erected on the wall plate or the remaining half of the sole plate. These two components are then joined with nails, and temporary bracing ensures the panel remains upright. A double runner is then installed atop the assembled panels.

image 19

Platform framing utilizes a double runner positioned atop the studs to serve as a bearing point for the upper floor joists. Following their installation, another single sole plate is secured using nails to the top of the joists. This sole plate then serves as the foundation for an additional set of wall panels corresponding to the next storey height. This process is repeated sequentially. A final double runner is installed atop the uppermost set of panels, and the roof timbers are affixed to this double runner.

In contrast, balloon framing employs a different approach for supporting the floor joining at the midpoint of the stud length. Here, support is achieved through a combination of a thin, wide timber member known as a riband, which is inserted into a recess within the inner face of the stud, and a halving joint created between the joist and stud, further secured with nails driven into the stud. The topmost section of the framed panel is constructed using a single runner. If the roof requires attachment at this level, the runner is doubled, mirroring the approach used in platform framing.

A critical aspect of both platform and balloon construction methods is ensuring consistent spacing for all timbers (joists, studs, and roof timbers). This uniformity allows for the efficient transfer of loads originating from the roof and upper floors directly down to the studs through the joist ends.

For reference, here are the typical dimensions for the various timber components used in this construction method:

  • Studs, runners, sole and wall plates, dwangs, and noggings: 150mm x 50mm to 200mm x 75 mm
  • Bracing and ribands: generally 32 or 38 mm thick and 200 to 250 mm wide
  • Joists: 150 x 50 mm to 300 x 75 mm
  • Diagonal boarding: 20 or 25 mm thick, 150 or 200 mm wide
  • Clap boarding and weatherboarding: 15 or 20 mm thick
  • Matchboarding: 15 mm thick

Following the erection of the frame, the exterior surface is covered with plain-edged sawn boards, typically measuring 150 to 200 mm wide and 20 to 25 mm thick. These boards are laid diagonally with their edges butted together tightly and secured using two nails driven through their face and into each underlying timber element (studs, sole plates, runners, and dwangs).

image 17

Construction of Timber Suspended Upper Floors

A suspended timber upper floor is comprised of a network of beams, technically known as joists. These joists are supported by load-bearing walls or header timber beams and are specifically sized and spaced to ensure they can safely bear all anticipated static (dead) and variable (imposed) loads placed upon the floor.

image 20

A suspended timber upper floor serves several important purposes within a building structure:

  1. Structural Integrity: The primary function is to provide a level and robust platform capable of safely sustaining imposed loads from occupants, furniture, and equipment. This also includes the dead weight of the floor itself and any ceiling structure suspended below.
  2. Thermal Efficiency: The floor plays a role in minimizing heat loss from the lower floor. The specific level of thermal resistance is determined by design considerations and may involve the use of insulation materials within the floor cavity.
  3. Acoustic Performance: The floor assembly contributes to sound insulation, mitigating the transmission of noise between floors. The specific level of soundproofing achieved depends on the design and materials employed.
  4. Fire Safety: The floor contributes to the building’s overall fire resistance, potentially slowing the spread of flames and providing additional time for evacuation in the event of a fire. The specific level of fire resistance is determined by the type of timber used, any fire-retardant treatments applied, and the overall floor assembly design.

Selection of Timber Joist Sizes

Timber joist sizes can be selected using the following methods;

(1) Full structural design of the timber joists
(2) Selection from span-load tables
(3) Empirical formula (Depth of joist = [Span (mm)/24 + 50]; where the assumed width and spacing of the joists are 50 mm and 400 mm c/c respectively).

A typical span-load table for the general structural grade (GS) timber joist is shown below.

image 9

While span-load tables and formulas offer valuable tools for specifying timber elements in construction, it’s acknowledged that they possess limitations. In situations where loads, spans, or joist spacings fall outside the parameters encompassed by these tables, more rigorous calculations become necessary.

Simply calculating the overall dimensions of a timber element is not sufficient for ensuring its structural adequacy. Additional checks are important to confirm that the element meets essential performance criteria:

  • Deflection Resistance: The element must possess adequate stiffness to limit deflection under applied loads. Excessive deflection can lead to serviceability issues, such as cracking of finishes or creating an uncomfortable walking surface.
  • Safe Bearing Capacity: The element’s bearing area where it rests on supports must be sufficient to prevent crushing of the timber or failure of the supporting structure.
  • Shear Resistance: The element must be able to withstand internal shearing forces that act parallel to the grain of the wood. Failure in shear can lead to a sudden and catastrophic collapse.

For such scenarios, this article recommends consulting two informative resources:

  • BS EN 1995-1-1: Design of timber structures: This European Standard provides comprehensive guidance on the design of timber structures.
  • BS EN 338: Structural timber strength classes: This European Standard focuses on structural timber and incorporates information regarding the strength classes of various timber species.

By consulting these resources, engineers can obtain the necessary data to perform the required calculations and ensure the safe and appropriate use of timber in situations exceeding the scope of design tables.

Strutting (Blocking) of Timber Floor Joists

In suspended timber floor construction, strutting elements are incorporated to limit the potential twisting and vibration of the floor joists. These movements, if left unchecked, could lead to damage to the ceiling finishes. Strutting is typically employed when the span of the joists surpasses 2.5 m. Ideally, the strutting should be positioned at the centre line of the joist span.

image 8

It’s important to note that the maximum achievable span for a floor joist, measured centre-to-centre between bearing points (including the centre line of the inner leaf in a cavity wall), is approximately 6 m.

To ensure stability, external walls (including compartment walls, separating walls, and party walls), as well as internal load-bearing walls, must be provided with lateral restraints from adjacent floor structures. This serves to restrict lateral movement of the walls. Exceptions to this requirement exist for walls with a length of less than 3 meters.

image 11

Methods for achieving lateral restraint

MethodDescription
End Bearing of Floor JoistsFloor joists should bear on the wall for a minimum of 90 mm and be spaced at intervals not exceeding 1.2m.
Galvanized Steel StrapsAlternatively, galvanized steel straps can be employed. These straps should be spaced at intervals not exceeding 2 m and securely fastened perpendicular to the joists.

Services Installation and Maintenance

It is important to conceal pipes and cables within a building structure while maintaining accessibility for future maintenance and repairs. When employing timber joists, there are strategic placement options for these service elements. Pipes and cables running parallel to the joists can be conveniently secured to their sides. However, running them perpendicular to the joists necessitates creating holes or notches within the timber itself.

The creation of holes within timber joists is suitable for accommodating flexible cables and coiled soft copper microbore tubing. The ideal location for these holes in simply supported, end-bearing floor joists is at the neutral axis. This specific zone represents the point where compressive and tensile load distribution neutralize, and the material experiences minimal dimensional change (neither lengthening nor shortening) under deflection.

image 10

To protect the structural integrity of timber joists, limitations are placed on the size, spacing, and location of any holes created within them.

  • Maximum Diameter: The diameter of a hole cannot exceed 25% of the joist’s depth.
  • Minimum Spacing: Multiple holes necessitate a minimum center-to-center spacing equivalent to three times the diameter of each hole.
  • Ideal Location: The preferred location for a hole is within the neutral axis of the joist. This zone lies between 25% and 40% of the clear span, measured from the support point where the joist rests. The neutral axis represents the area within the joist that experiences minimal stress from bending forces.

Notches are the most practical method for incorporating rigid pipes and conduits into floors constructed with joists. However, to minimize the impact on the joist’s structural integrity, specific restrictions govern the depth and placement of these notches.

  • Maximum Depth: The depth of a notch cannot exceed 12.5% of the joist’s depth.
  • Permissible Location: Notches can only be made within a designated zone ranging from 7% to 25% of the clear span, measured from the support where the joist rests. This ensures that the notch is located in an area experiencing minimal bending stress.

Fire Protection of Timber Floors

This section outlines fire resistance classifications for floors based on their relative height from the surrounding ground:

  • Less than 5 meters: Floors situated less than 5 meters above the adjacent ground require a minimum fire resistance rating of 30 minutes.
  • More than 5 meters: Floors exceeding 5 meters in height necessitate a minimum fire resistance rating of 60 minutes. However, a 30-minute rating is considered sufficient for three-story dwellings in this category.
image 12

These fire resistance ratings are determined through testing procedures outlined in BS 476 Part 21: Fire tests on building materials and structures. Methods for determination of the fire resistance of load bearing elements of construction. This standard evaluates three key aspects of an element’s fire performance:

  • Load-Bearing Capacity: The ability of the element to sustain its structural integrity during a fire event.
  • Integrity: The element’s capacity to resist fire penetration and prevent the spread of flames.
  • Insulation: The element’s ability to impede heat transfer through radiation and conduction, thereby slowing the spread of fire.

It is important to note that floors constructed over basements or garages must possess a full 30 minutes of fire resistance. Furthermore, when a floor provides structural support or stability for a wall (or vice versa), the fire resistance rating of the supporting element must be equal to or greater than the fire resistance rating of the other element. This ensures a consistent level of fire protection within the building structure.

Damp Proof Course (DPC) and Damp Proof Membranes (DPM) in Building Construction

Damp proof course (DPC) and damp proof membrane (DPM) are two important elements in building construction that play a vital role in preventing moisture ingress (rising damp) through capillary action into a building. Their presence ensures the durability and integrity of buildings by preventing dampness of walls and floors.

It is a building regulation requirement that the elements of a building such as the walls, roof, and floors be designed and constructed in such a way that the building and the people in it shall not be negatively affected by ground moisture, precipitation, condensation, or spillage of water from the plumbing system.

Building elements in direct contact with the ground, such as walls and floors, are particularly susceptible to moisture movement through capillary action. This can lead to a range of detrimental effects, including structural degradation, mould growth, and poor indoor air quality. To mitigate these concerns, damp proofing measures are essential components of a well-designed building envelope.

A DPC is a continuous horizontal barrier integrated within the masonry wall construction. Its primary function is to impede the upward capillary rise of moisture from the ground into the building elements above. This prevents water migration through tiny pores within the wall material. However, a DPM is a sheet material laid horizontally beneath floor slabs or other elements in direct contact with the ground. Its primary function is to prevent moisture transmission from the ground into the building elements above.

image 2

Construction Details of DPC and DPM

Damp proof courses (DPCs) and damp-proof membranes (DPMs) should be clearly detailed and represented in construction drawings due to their importance. However, particular attention must be paid to the junction where walls and solid floors meet. Failure to ensure proper continuity at these critical intersections can compromise the effectiveness of the entire damp-proofing system and create pathways for moisture penetration.

An important consideration involves identifying the optimal material for these intersections. A wide variety of materials possess varying properties in terms of waterproofing capabilities and compatibility with the surrounding building elements. A thorough analysis is required to select the material that best addresses the specific conditions encountered at each junction.

The conventional symbol used to represent damp-proof layers in construction drawings may not always accurately depict the actual thickness of these layers. For particularly thin DPCs and DPMs (less than a few millimetres), representing them to scale on drawings can prove challenging. This can lead to ambiguities in interpretation during construction.

The proposed solution to address the challenge of symbolizing thin damp proofing layers in drawings prioritizes clarity and effectiveness. DPCs and DPMs can be represented with a thickness that exceeds their actual scale. The necessary additional space can be accommodated by reducing the depicted thickness of adjacent building elements on one side of the damp proofing layer.

Importantly, dimensions should always be provided for one face of the damp proofing layer where the adjacent material is shown at full scale. This approach ensures clear communication of the damp proofing system without compromising the overall representation of the construction details.

What is a Damp Proof Course (DPC)?

A damp proof course (DPC) is a horizontal barrier installed in a wall to prevent the upward movement of moisture from the foundation or surrounding soil. It is typically a thin layer of impermeable material, such as concrete, asphalt, bitumen, or plastic, that is embedded in the mortar course of a wall. The primary function of a DPC is to prevent dampness from rising up the wall and entering the building, which can lead to structural damage, decay, and health issues.

Typical DPC details in a building

In order to effectively impede rising damp, the damp-proof course (DPC) must adhere to the following stipulations:

  1. Continuity: The DPC shall be continuous and seamlessly integrated with any damp-proof membrane (DPM) present within the floor structure.
  2. External Wall Height: For DPCs situated within external walls, their elevation must be a minimum of 150 mm above the adjoining ground level.
  3. External Cavity Walls: In instances where the DPC is located within an external cavity wall, the cavity itself must extend downward at least 225 mm below the DPC. Alternatively, a cavity tray equipped with weep holes spaced at regular intervals of 900 mm can be employed. These weep holes serve the critical function of enabling the drainage of water accumulating within the cavity, thereby preventing its transmission to the inner wall leaf.

Properties of a DPC Material

An effective material for a damp proof course (DPC) in buildings should possess the following key properties:

  1. Imperviousness: The primary function of a DPC is to impede moisture ingress. Therefore, the chosen material must be highly resistant to water penetration, acting as a reliable barrier against rising damp.
  2. Strength and Durability: The DPC is positioned within the building envelope, where it is subjected to various loads, both static (dead) and dynamic (live). Consequently, the material needs to be demonstrably strong and durable to withstand these stresses without sustaining damage or compromising its effectiveness.
  3. Dimensional Stability: Over time, fluctuations in temperature and humidity can cause certain materials to expand or contract. To ensure the DPC’s continued functionality, it’s crucial to select a material with good dimensional stability, meaning it will maintain its size and shape throughout its service life.
  4. Chemical Compatibility: The DPC comes into contact with other building materials, such as mortar and concrete. To prevent adverse chemical reactions that could deteriorate the DPC or surrounding elements, the chosen material should exhibit compatibility with these substances.
  5. Resistance to Salts: Certain salts, like sulfates, chlorides, and nitrates, can be detrimental to the DPC’s performance. Therefore, the material should be resistant to the presence of these salts to safeguard its integrity.

In addition to these core properties, other factors such as cost-effectiveness and ease of installation may also be considered when selecting a suitable DPC material.

Types of DPC

BS 743:1970 provides a list of materials that are deemed suitable for the construction of damp proof courses;

  • Lead
  • Copper
  • Bitumen
  • Mastic asphalt
  • Polythene
  • Slates
  • Bricks
  • Materials for mortar

Lead or copper sheeting

  • A highly durable and effective material for DPCs, but also the most expensive.
  • Lead and copper are naturally water-resistant and can last for many years.
  • However, lead is a hazardous material and its use is restricted in some countries.

Bitumen

  • A common and cost-effective material for DPCs.
  • It is a waterproof material that is applied as a hot liquid or sheet membrane.
  • However, bitumen can be brittle and can crack over time, especially in cold weather.

Mastic asphalt

  • A semi-rigid material made from bitumen, sand, and filler.
  • It is more flexible than bitumen and can accommodate some movement in the wall.
  • Mastic asphalt is also more resistant to cracking than bitumen.

Slates and cement mortar

  • A traditional material for DPCs, consisting of two layers: a layer of slate and a layer of cement mortar.
  • Slates are naturally water-resistant and provide a solid base for the DPC.
  • Cement mortar helps to bond the slates together and create a waterproof seal.
image 3
Mortar damp proof course

Engineering bricks

  • A type of brick that is made to be highly water-resistant.
  • Engineering bricks can be a good alternative to bitumen or plastic sheet membranes.
  • They are also more resistant to damage from building movement than other DPC materials.

Chemical DPC

  • A relatively new type of DPC that is injected into the wall.
  • Chemical DPCs create a water-repellent barrier within the wall itself.
  • They are a good option for walls that are already built, as they can be installed without disturbing the existing structure.
damp proof course construction

Concrete as a DPC Material

Concrete can be a viable DPC option, particularly for low-moisture environments and standard wall thicknesses. However, its limitations in impermeability and salt resistance should be considered. However, concrete is a commonly used material for DPCs due to its several advantages such as wide availability, strength, durability, and ease of construction.

While concrete offers some resistance to moisture, it’s not entirely impermeable. Over time, tiny cracks can develop, allowing moisture ingress. This is because concrete is brittle and can crack under excessive movement or stress, potentially compromising its effectiveness. Concrete can also be susceptible to degradation from salts like sulfates and chlorides commonly found in soil.

The following approach can be adopted to enhance the performance of concrete as a DPC material:

  • Mix Design: Using a richer concrete mix (lower water-cement ratio) can improve its impermeability.
  • Waterproofing Additives: Adding waterproofing admixtures to the concrete mix can further enhance its moisture resistance.
  • Bitumen Coating: Applying a hot bitumen layer on top of the concrete DPC can provide additional waterproofing.

What is Damp Proof Membrane (DPM)?

A damp proof membrane (DPM) is a thin, impermeable layer that is applied to the surface of a wall or floor to prevent moisture ingress. Unlike a DPC, which is embedded in the mortar course, a DPM is a separate layer that is typically applied to the surface of the substrate. A minimum thickness of at least 1200 gauge (300 micrometres) is recommended for DPMs. This ensures sufficient strength and puncture resistance.

DPMs are commonly used in flooring applications, such as under concrete slabs or screeds, to prevent moisture from rising up from the ground.

Types of DPM

Damp proof membranes are typically made of high-density polyethylene (HDPE) or polyvinyl chloride (PVC). Other materials like asphalt sheet membranes might be used in specific situations. Generally, there are several types of DPM materials available, including:

  • Polyethylene DPM: A popular choice due to its durability and water resistance.
  • Polypropylene DPM: A flexible and versatile option that can be used in a variety of applications.
  • PVC DPM: A cost-effective option that provides good water resistance.
  • Bitumen-based DPM: A durable and water-resistant option that is suitable for a range of applications.

However, the chosen DPM material should be compatible with other building materials it comes in contact with, like concrete or screed. Certain chemicals in incompatible materials might degrade the DPM over time.

typical DPM installation
Typical DPM installation in a building

Properties of DPM

These materials offer several key properties that make them suitable for damp-proofing applications:

  • Impermeability: HDPE and PVC possess excellent water resistance, effectively preventing moisture transmission through the membrane.
  • Durability: DPMs are designed to withstand harsh environmental conditions and maintain their performance over time. They are resistant to degradation from UV exposure, chemicals commonly found in soil, and biological attack.
  • Flexibility: Compared to rigid materials like concrete, DPMs offer a degree of flexibility, allowing them to accommodate slight movements in the building structure without compromising their effectiveness.
  • Puncture Resistance: While flexible, DPMs are also reasonably puncture resistant, especially when appropriate installation methods are followed.
  • Cost-Effectiveness: Compared to some alternative DPC materials like lead or copper sheeting, DPMs offer a cost-effective solution for damp-proofing.

Installation Considerations

Proper installation is critical for the optimal performance of DPMs. Here are some key factors to consider:

  • Surface Preparation: The substrate where the DPM will be laid needs to be clean, level, and free from sharp objects that could puncture the membrane. DPMs are typically laid on a layer of sand or blinding to provide a smooth and level surface for the membrane. Sometimes, a DPM might be installed above the concrete floor slab.
  • Overlaps and Joints: Overlaps of at least 150mm (preferably 300mm) at the edges of the membrane are essential to create a continuous barrier. Joints can be sealed with high-quality self-adhesive tape or heat welding for a watertight connection.
  • Wall Termination: The DPM should be turned up the wall at a minimum height (typically to the level of the DPC) and integrated with the wall DPC material to create a continuous moisture barrier.
  • Flashings and Penetrations: Any penetrations through the DPM, such as for pipes or cables, require proper flashing details to maintain water-tightness.
  • Protection: DPMs are susceptible to damage during construction. Protecting the membrane from puncturing using a sand-blinding layer or dedicated DPM protection boards is essential.

The Aesthetics of Black PV Panels

Photovoltaic (PV) panels, also known as solar panels, are a rapidly growing technology transforming sunlight into clean, renewable electricity. These panels comprise numerous interconnected solar cells, each containing a semiconductor material that converts light energy into electrical current through the photovoltaic effect. Typically, PV panels are placed on the roofs of buildings, where they absorb particles of light. Some PV panels are blue in colour, while others are black.

When sunlight strikes a solar cell, photons (particles of light) are absorbed by the semiconductor material. This absorption process excites electrons within the material, causing them to flow and generate an electric current. By connecting multiple solar cells in series and parallel, panels are created that can produce significant amounts of electricity.

Conventional solar panels utilize a silver-based front contact grid, resulting in a characteristic blue appearance. However, recent advancements have led to the development of black silicon solar panels, offering a distinct aesthetic and potential performance benefits.

Black PV panels
Black PV panels

Black silicon panels achieve their dark colour through a surface texturing process that modifies the silicon wafer at the nanoscale. This texturing increases light trapping within the cell, enhancing light absorption across a broader range of wavelengths.

Black silicon panels offer several potential performance improvements over conventional panels:

  • Increased Efficiency: The enhanced light trapping and reduced reflection can lead to higher power output and efficiency compared to standard panels.
  • Improved Low-Light Performance: The superior light absorption capabilities can benefit energy generation in low-light conditions, such as during mornings and evenings.

However, black PV panels aren’t just about efficiency. They also have an aesthetically appealing side that is often overlooked. But how exactly do these sleek, all-black panels contribute to the overall charm of a building? We’re here to shed some light on the matter.

Keep reading to discover the hidden beauty of these black panels and why you should consider them for your next solar installation. Let’s get started!

Seamless Modern Integration

Black PV panels blend effortlessly into modern architectural designs. Their sleek appearance integrates smoothly with various building materials like:

This integration supports a minimalist aesthetic, which is a hallmark of contemporary architecture. Additionally, homeowners and builders can enhance visual appeal and harness solar power simultaneously.

Improving Facades without Sacrificing Design

Solar panels are typically associated with utilitarianism. This leads many to believe that they detract from a building’s design. However, black PV panels can benefit the look and feel of a facade without disrupting its aesthetic.

Their colour often complements other design elements such as:

  • roof shingles
  • exterior paint
  • window frames

This creates a cohesive and visually appealing exterior that perfectly incorporates sustainable technology. They simply enhance the building’s look, making it stand out.

Uniformity and Sophistication

The uniform colour of black panels exudes sophisticated minimalism. This uniformity brings a sense of order and elegance to the building’s appearance. Additionally, it symbolizes modernity and forward-thinking.

It aligns well with the principles of bare and sleek design. By choosing black panels, you opt for a solution that marries functionality with style, elevating the aesthetic value of any project.

Making Green Energy Visibly Attractive

Black solar panels represent sustainable advancement. They’re a top choice for demonstrating support for clean energy. They also transform solar setups into a part of your home’s aesthetic, beyond just being functional.

Their sleek appearance sends a strong message about energy’s future. Opting for black panels means you’re supporting renewable energy in a way that’s also appealing to the eye.

image
Black PV panels on a roof

Reducing Visual Clutter on Rooftops

Most solar panels come in blue or silver shades, which can create visual clutter on a rooftop. This is especially true when there are multiple panels installed. But black PV panels offer a more cohesive and uniform look. They create a clean, streamlined appearance that blends seamlessly into the rooftop. This not only enhances the overall aesthetic of the building but also reduces visual distractions.

However, be sure to choose high-quality options, like these premium solar panels in Milwaukee. This ensures that the sleek look is maintained for years to come.

Maximizing Energy Efficiency

These panels absorb more sunlight compared to their lighter counterparts. This boosts heat absorption, enhancing solar energy conversion efficiency. Additionally, they perform well even on the hottest days. Meaning, their efficiency doesn’t decrease as much in high temperatures.

Enhanced Property Value

Potential homebuyers are drawn to sustainable and energy-efficient homes. The presence of black solar panels is a clear indicator of both. These installations suggest lower electricity bills and a smaller carbon footprint. This makes your property more attractive in the real estate market. Furthermore, the sophisticated look of black panels creates a positive first impression. It can increase curb appeal and make your property stand out among other listings.

Low Maintenance Appeal

Black PV panels offer a practical choice for homeowners and businesses alike. Unlike their counterparts, they are less prone to visible dirt and dust accumulation. This means they require less cleaning to maintain their efficiency and aesthetic look. Their durable design also withstands harsh weather conditions like:

  • rain
  • hail
  • extreme temperatures

The focus remains on their sleek appearance and reliable energy production. It minimizes the need for regular upkeep. This ease of maintenance not only saves time but also reduces long-term care costs. This is yet another advantage to consider when choosing panels.

Innovative Technology Integration

These panels use advanced technology to maximize light absorption and energy conversion. They use materials optimized for durability and performance such as:

  • monocrystalline silicon
  • anti-reflective coating
  • back contact cells

Furthermore, their smart, integrated systems allow for real-time energy monitoring and management. This blend of form and function makes black PV panels a practical and stylish choice.

Environmental Impact with Style

Black PV panels do more than beautify buildings. They embody an important environmental commitment with style. By using these panels, homeowners and businesses take a stand against climate change. The dark hue adds modern aesthetics and promotes sustainable living.

Moreover, their efficient operation decreases carbon footprint. With this, you’re not only making your property appealing. But you’re also contributing to a greener future.

Landscaping and Outdoor Design Harmony

The dark, sleek panels blend with the natural environment. This creates a seamless connection between modern technology and nature. They also accentuate garden features, such as:

  • pathways
  • pergolas
  • water features

This harmony of design and function enhances outdoor living areas. It turns gardens into sustainable retreats. It’s where technology complements nature, not competes with it. Additionally, it adds elegance, making eco-conscious choices visually appealing. With this, outdoor spaces become modern, efficient, and inviting.

Customization and Personalization Options

Black PV panels offer a wide range of customization and personalization options. You can choose from different sizes and shapes to fit various roof layouts. This flexibility ensures a perfect match with your building’s design. Additionally, some models provide options for frame colours. This allows for a more harmonized look with the building’s exterior.

Furthermore, you can also select from different capacity and efficiency levels. This means you can customize not just how the panels look, but also how they perform. Such options are not only practical but also allow for a more personalized touch to your solar installation.

image 1

Future-Proofing with Black PV Panels

While solar energy offers numerous advantages, it’s important to acknowledge factors like initial installation costs and potential limitations in energy production during low-light conditions. However, with increasing accessibility and government incentives, solar panels are becoming a more attractive option for individuals and businesses seeking to embrace clean energy solutions. Black PV panels are more than just a step towards sustainability. They represent a blend of functional efficiency with unparalleled aesthetics.

Despite these considerations, ongoing research and development efforts are continuously improving the cost-effectiveness and performance of black silicon panels. As the technology matures, black silicon is expected to play a growing role in the future of solar energy generation.

A Comprehensive Guide to Treatment of Cracks in Buildings

Cracks in buildings are a common phenomenon that can occur due to various reasons such as foundation settlement, shrinkage, thermal expansion, old age, material failure, excessive load, and structural damage. Sometimes, cracks occur in buildings due to the interaction or combination of the factors highlighted above.

Generally, cracks will occur in masonry and concrete elements if the tensile/compressive stress induced in the element exceeds the strength of the material. In concrete elements, it is widely accepted that it is normal for cracks to occur, however, the design interest lies in the width of the crack, crack spacing, severity, and how it affects the appearance and functionality of the structure.

If left untreated, cracks in buildings can lead to water infiltration, structural weakness, and even collapse. Cracks are indications of distress in a building, however, their location, pattern, and severity can be used to assess their significance. It is, therefore, very important to identify and treat cracks in buildings promptly and effectively.

diagonal/stepped cracks on a wall
Diagonal cracks on a wall

However, the efficacy of any crack repair methodologies in a distressed building depends on a thorough understanding of the underlying causes and the selection of repair procedures that duly consider these factors. Failure to do so may result in only temporary solutions, whereby the cracks reoccur sometime after treatment.

To achieve durable and sustainable crack repair outcomes, it is important to develop a holistic understanding of the causal factors contributing to the cracks and address them in conjunction with the crack treatment. This multifaceted approach ensures that the root causes of the cracks are effectively mitigated, thereby avoiding the recurrence of the problem and guaranteeing long-term success.

In this article, we will discuss the causes of cracks, types of cracks, and various treatment methods.

Causes of Cracks in Buildings

Internal stresses within building components can induce dimensional changes. When these components are restrained from movement, as is typically the case, cracking in buildings can occur.

Furthermore, internal stresses which can be compressive, tensile, or shear can lead to direct cracks in buildings. Notably, common construction materials like masonry, concrete, and mortar exhibit low tensile and shear strength. Consequently, even relatively minor forces that induce tension or shear within these materials can lead to cracking.

Cracks can occur from various factors, broadly categorized into structural and non-structural causes.

Structural Causes

Structural cracks are more concerning as they indicate potential issues with the building’s foundation or load-bearing elements. Structural cracks can occur on the major structural elements such as beams, columns, slabs and load-bearing walls. They also affect partitions and non-load-bearing walls. Common causes include:

(1) Foundation settlement: Differential settlement of the foundation due to poor soil compaction, expansive soils, or excessive loads can cause cracks in walls, floors, and ceilings. Internal stresses are induced in structural members due to differential settlement. These stresses are induced due to the inherent constraints in the various structural members of the building. When the rigid joints of the structure prevent one part from moving relative to another, stresses are developed, and cracks occur.

Depending on the magnitude of the relative settlement, these stresses are usually in excess of that due to the normal load imposed on the structure, and more often than not, they may not have been accounted for in the design. Therefore, whenever one part of a building settles relative to another, major cracks occur on the building.

(2) Inadequate Design: Inadequate structural design, such as the provision of an inadequate number of reinforcements, inadequate member sizes, excessive deflection, etc. can cause cracks in a building when it is loaded.

(3) Construction flaws: Faulty construction practices, or the use of substandard materials can lead to cracks in a building. This can manifest in the use of weak concrete mixes, sandcrete blocks of inadequate strength, alkali-silica reactions in concrete, reinforcements of inadequate strength, poor compaction of soil, etc. Therefore, poor construction practices can lead to the development of cracks in buildings.

(4) Movement in supporting elements: A well-established scientific principle states that all materials exhibit thermal expansion (expansion upon heating) and contraction (contraction upon cooling). However, the magnitude of this dimensional change varies across different materials and structures due to their unique molecular and other inherent properties.

When constraints are placed on a structural component that impedes its natural thermal movement, internal stresses are generated within the material. These stresses can take the form of tensile or shear forces, potentially leading to cracking. Thermal expansion and contraction of structural elements due to temperature differences can cause cracks, especially at joints.

(5) Overloading: Excessive load placed on floors or roofs beyond their design capacity can lead to cracking. For instance, converting residential buildings to storage houses without proper structural evaluation can lead to cracks or structural failure.

Non-Structural Causes

These cracks are generally less severe and often cosmetic in nature. While non-structural cracks typically do not compromise the structural integrity of a building, they can present aesthetic concerns. These cracks may create the impression of poorly executed construction or impart a sense of instability within the structure.

Furthermore, in certain scenarios, non-structural cracks can allow moisture ingress, potentially leading to the deterioration of interior finishes and increased maintenance costs. Consequently, the implementation of measures to prevent or minimize the occurrence of such cracks is considered essential.

They can be caused by:

(1) Shrinkage of materials: Loss of moisture during concrete curing can lead to cracking. When surface moisture evaporates at a faster rate than it is replenished by bleed water, shrinkage occurs in the upper layer. This shrinkage is hindered by the less-dried concrete below, inducing tensile stresses within the stiffening and relatively weak surface layer. This is known as autogenous shrinkage.

The resulting cracks exhibit varying depths and may manifest in a random, polygonal pattern, or appear roughly parallel to each other. Cracks also occur in concrete due to drying shrinkage. The characteristics of shrinkage cracks can vary based on inherent properties of the building materials. Cracks may exhibit greater width but be spaced farther apart, or conversely, be thin but appear more closely spaced.

(2) Moisture Content fluctuations: Construction materials such as sandcrete, bricks, mortar, or even concrete can undergo expansion and contraction due to moisture variations. These fluctuations in volume due to changes in moisture content can cause cracks in walls, ceilings, and plaster.

(3) Vibration: Vibrations from traffic or construction activity can lead to minor cracks, especially in older buildings.

Old buildings are susceptible to cracks

Classification of Cracks in Buildings

The characteristics of cracks in buildings can vary considerably. The crack width may be uniform throughout the crack, or it may show a gradual increase from one end to the other. Crack patterns can be straight, jagged, stepped, map-like, or random. Additionally, their orientation can be vertical, horizontal, or diagonal. The depth of cracks may range from solely affecting the surface layer to extending through multiple material layers.

The severity of a crack is determined by its width, depth, location, and whether it’s static (inactive) or moving (active). Cracks are active when the causal factor is still taking place. By implication, such cracks will likely reoccur when treated. An active crack may continue to affect other members or areas of the building, or the existing cracks will continue to increase in width and severity. An example of this is a crack that is occurring as a result of ongoing consolidation settlement of the foundation. However, in inactive cracks, the cause of the settlement has been taken care of, and the crack is now static.

Different types of cracks in concrete

However, here is a general classification system for cracks occurring in a building:

Hairline cracks: These are very thin cracks, typically less than 1/24 inch (1 mm) wide. They are often caused by shrinkage or minor settling and may require cosmetic repair. Also, when the joint between masonry infill panels and reinforced concrete columns is not properly treated, hairline cracks may form on the joint after plastering.

Stress cracks: These are slightly wider than hairline cracks, ranging from 1/24 inch (1.5 mm) to 1/5 inch (5 mm). They may indicate movement in the structure and warrant further investigation by a structural engineer. In reinforced concrete beams, flexural cracks will likely occur at the tension zone of the point of maximum bending moment. Shear cracks are usually diagonal cracks that will occur near the supports.

Variable or random cracks on masonry walls may indicate a myriad of stresses acting on the wall. This may be a result of a deflecting beam or slab bearing on a non-load-bearing masonry wall. Masonry walls will also crack when it is supported by members undergoing deflection.

Wide cracks: Cracks exceeding 1/5 inch (5 mm) in width cause concern and require immediate professional evaluation. They could signify significant structural issues. When cracks in masonry walls are diagonal or stepped, the reason may be differential settlement of the foundation. Vertical cracks in masonry walls may also indicate a settling foundation.

cracking of a building due to differential settlement
Wide cracks in a masonry wall

Steps in the Remediation of Cracks in Buildings

This section outlines a structured approach to concrete and masonry crack repair, ensuring a comprehensive evaluation, accurate diagnosis, and effective treatment approach.

(1) Evaluation Phase
The initial stage involves a thorough assessment of the building’s condition. This may encompass:

  • A careful review of design drawings and structural calculations (where available).
  • A site visit and close examination of the building and the areas in distress (masonry and structural members). This may include testing of samples using the non-destructive method.
  • Examination of the foundations, soil type, and drainage conditions of the building substructure.

Upon completion of this evaluation, the team will possess a comprehensive understanding of the building’s condition and the underlying causes of the cracks.

(2) Identification of the Causative Factor(s)
Following the evaluation stage, a meticulous assessment is required between the observed conditions of the building, foundation, and test results to give a clear indication of the mechanism responsible for the cracks. As cracks can often occur due to multiple factors, identifying the root cause is important before recommending appropriate solutions.

(3) Repair Method Selection
Once the cause(s) of the cracks have been definitively identified, the most suitable repair method and materials can be strategically chosen.

(4) Plan and Specification Development
The next step entails the preparation of detailed plans for treating the critical elements and establishing precise specifications for the repair materials. Due to potential unforeseen circumstances arising during the repair process, these plans should maintain a degree of flexibility.

(5) Repair Implementation
The success of the repair hinges upon a strict adherence to the established plans and specifications. This level of precision should surpass that employed in new building construction. The evaluation and design work should be undertaken by a qualified structural engineer with a keen eye for detail.

Treatment Methods for Different Cracks

The appropriate treatment for a crack depends on its cause and severity. The primary objectives of concrete crack repair can be summarized as follows:

  1. Enhancement of Structural Capacity: This includes restoring or increasing the flexural and tensile strength of the building element.
  2. Improvement of Stiffness: Repair should aim to regain or elevate the rigidity of the distressed element.
  3. Restoration of Functionality: The repair process should ensure the building element can effectively perform its intended function.
  4. Waterproofing and Infiltration Mitigation: Cracks should be sealed to prevent water ingress and potential damage.
  5. Aesthetic Restoration: The repair should improve the visual appeal of the building surface.
  6. Durability Enhancement: The repair should promote the long-term serviceability of the building.
  7. Corrosion Protection for Reinforcement: Cracks should be addressed to prevent a corrosive environment from developing around steel reinforcement within the concrete.

Here’s an overview of common repair methods:

Crack Injection 

Epoxy, polyurethane resins, or concrete grouts are injected into the crack to fill it, stabilize the surrounding area, and prevent water infiltration. This crack repair method typically involves a three-step process:

  1. Installation of Entry and Venting Ports: These ports are strategically placed at frequent intervals along the length of the crack to facilitate material injection and air release.
  2. Sealing of Exposed Crack Surfaces: The crack surface on all exposed areas is meticulously sealed to prevent leakage during the injection process.
  3. Pressurized Epoxy Injection: Epoxy resin is injected under pressure into the crack through the installed ports.
Crack injection procedure of crack treatment

Epoxy injection has proven to be a successful technique for repairing cracks in various concrete structures, including buildings, bridges, dams, and others.

Crack Stitching

Crack stitching is a near-surface reinforcement (NSR) technique employed to introduce additional tensile strength perpendicular to the crack plane. This method involves creating a precise slot across the crack using a saw-cutting technique. The slot is then meticulously cleaned to ensure optimal bonding. U-shaped metal staples, reinforcements, or fibre-reinforced polymer bars are embedded across the crack and tightened to pull the separated sections together.

crack stitching
Crack stitching method of crack treatment

Subsequently, an epoxy resin is typically applied within the slot. This resin serves a dual purpose: acting as a strong bonding agent between the existing concrete and the reinforcement and providing a protective barrier for the bar that will be subsequently placed within the slot. This method is suitable for wider cracks in masonry walls.

Crack stitching in masonry walls

Grouting

For cracks in foundations or concrete slabs, a cementitious grout is pumped under pressure to fill voids and strengthen the affected area. The grouting procedure entails the following sequential steps:

  1. Surface Preparation: The concrete surrounding the crack is cleaned to remove any debris or contaminants that could hinder adhesion.
  2. Grout Nipple Installation: Pre-formed injection points (grout nipples) are strategically installed at predetermined intervals along the crack path. These nipples create a watertight connection with the injection equipment.
  3. Crack Sealing: The portion of the crack between the installed nipples is effectively sealed using cement paint, sealant, or grout. This sealing process prevents leakage during subsequent grouting.
  4. Crack Flushing: The entire crack is thoroughly flushed with water to remove any remaining particles and to verify the integrity of the applied crack seal.
  5. Crack Grouting: Once the crack is clean and the seal is verified, the entire crack is filled with a grout mixture. The specific grout composition, consisting of cement and water or cement, sand, and water, is chosen based on the width of the crack being addressed.

Surface Repairs and Sealing of Cracks

In scenarios where structural integrity is not compromised and only cosmetic repair is required, surface repairs, routing and sealing of cracks can be a suitable approach. This method involves widening the exposed face of the crack to a predetermined depth and subsequently filling and sealing it with an appropriate joint sealant. Compared to procedures like epoxy injection, which require specialized training, routing and sealing is a relatively straightforward technique and is commonly employed for crack treatment.

The selection of the sealant material is flexible, with options including epoxies, urethanes, silicones, polysulfides, asphaltic materials, or polymer mortars. Notably, the use of cement grouts should be avoided due to their high susceptibility to cracking themselves. Hairline cracks or superficial cracks can be repaired with patching materials, sealants, or caulk to improve aesthetics and prevent moisture intrusion. These methods may not fully repair cracks but rather hide or obscure the cracks.

Structural reinforcement

In severe cases, additional structural elements like beams, columns, or piers may be installed to reinforce the weakened area and improve load-bearing capacity.

Preventive Measures: Proactive Steps to Minimize Cracking

Proper foundation design and construction: A well-designed foundation that considers soil conditions and building loads is important to prevent settlement cracks. Proactive steps must be taken during the construction to ensure that proper compaction of trenches and fills is done.

Furthermore, the foundation must be adequately drained. If the soil is expansive or susceptible to differential settlement, the foundation should be designed to accommodate or mitigate against such effects.

Use of high-quality materials: Selecting materials that meet building code requirements and are appropriate for the climate helps minimize shrinkage and movement-related cracks.

Expansion and contraction joints: Incorporating strategically placed expansion joints in buildings, walls, slabs, and roofs allows for natural movement and reduces stress on the structure.

Moisture control: Proper drainage systems and waterproofing membranes prevent moisture-induced cracks in walls and foundations.

Regular maintenance: Regularly inspecting the building for cracks and addressing them promptly helps prevent minor issues from escalating into major problems.

Conclusion

Treatment of cracks in buildings is a critical task that requires a thorough understanding of the causes and types of cracks, as well as the various treatment methods. By understanding the causes and treatments for cracks in buildings, property owners can ensure timely repairs and maintain the structural integrity and safety of their structures.

By following the step-by-step treatment process outlined in this article, building owners and professionals can effectively treat cracks and prevent further damage to the building. Remember, consulting a structural engineer for professional assessment and guidance is always recommended, especially for concerning cracks.