8.7 C
New York
Friday, April 4, 2025
Home Blog Page 28

Design of Slurry Cut-Off Walls | Slurry Trenches

Slurry cut-off walls or slurry trenches are excavations that are made under the ground and filled with engineered slurries for the purpose of preventing the movement of groundwater into an excavation or construction area. Apart from acting as barriers to groundwater movement, slurry walls can also be used as barriers to the flow of leachate or contaminated groundwater. They can also be used to prevent the migration of gases into an area in a soil formation.
Slurry cut-off walls have been used for a long time in the control of groundwater during construction. In principle, engineered slurries are placed into a narrow excavation that forms the boundary of the area that needs to be barricaded from groundwater flow. The slurry will exert a hydrostatic pressure on the face of the excavation which will keep it stable from collapse while at the same time, prevent the movement of groundwater into the area of interest. Slurry cut-off walls are applicable to all kinds of soils but are more applicable to sandy soil deposits where the coefficient of permeability is high. Sandy soils also have more potential for collapse when excavations in it are unsupported.
Excavations for slurry trenches can be carried out using hoe excavators and can extend very deep to the impermeable stratum on the soil profile. Therefore, the construction will require adequate planning for workspace, safety, and operation of heavy construction equipment.

Bentonite slurry is the most commonly used material for filling slurry trenches. Bentonite slurry is formed by mixing bentonite clay with water, after which the colloidal mixture is pumped into the excavation. As a result, no additional shoring or bracing is required in slurry cut-off walls (see design of braced cuts).

One of the requirements of slurry trenches is that the lateral pressure exerted by the slurry on the excavation face must be equal to or greater than the lateral pressure from the soil and ground water. The properties of the slurry which influence the design of slurry trench walls are;

  • Density of the slurry
  • Gel strength (thixotropy) of the slurry
  • Viscosity of the slurry
  • pH of the slurry

The aim of this article is to show how to determine the required minimum density of slurry that will ensure the lateral stability of an excavation using a worked example.

Solved Problem

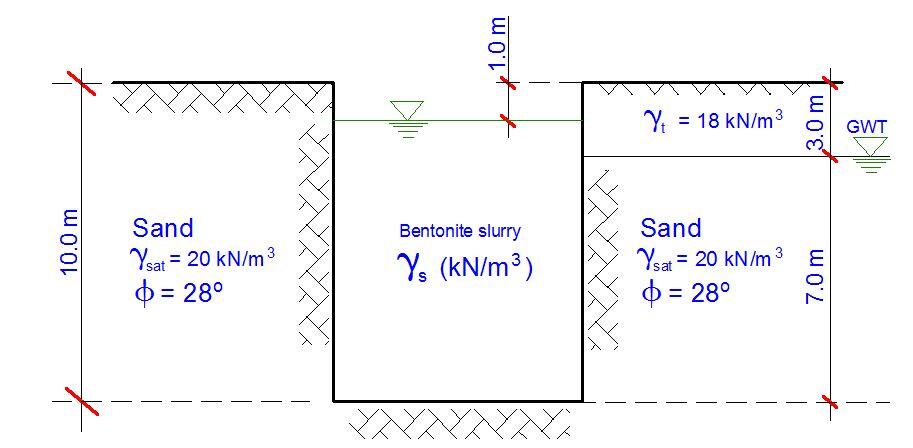
slurry trench problems 1


For the slurry cut-off wall shown above, calculate the minimum density of the slurry in the trench to prevent the wall of the excavation from sliding.

Solution
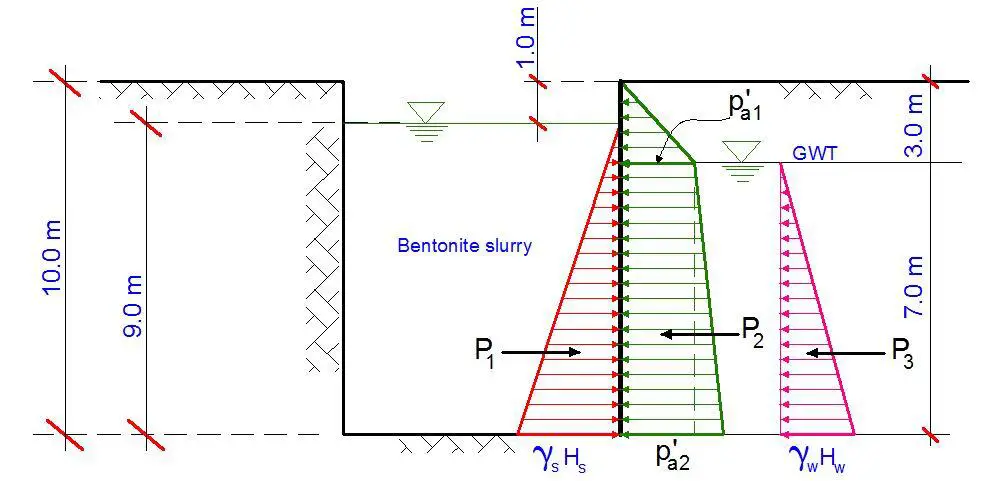
The solution to this problem is based on the principle of lateral earth pressure. The lateral pressure exerted by the slurry must be equal to or greater than the lateral earth and groundwater pressure at the face of the excavation. The free-body diagram of the pressures are shown below;

lateral pressure on slurry cut-off walls

For stability of the excavation;

P1 = P2 + P3

Using Rankine’s earth pressure theory, the coefficient of active earth pressure is given by;

kA = (1 – sinΦ)/(1 + sinΦ) = (1 – sin 28)/(1 + sin 28) = 0.361
P1 = ½γsHs2 = (0.5 × γs × 92) = 40.5γs
P3 = ½γwHw2 = (0.5 × 9.81 × 72) = 240.345 kN/m

p’a1 = kaγth1 = 0.361 × 18 × 3 = 19.494 kN/m2
p’a2 = kath1 + (γsat – γw)hw] = 0.361[18 × 3 + (20 – 9.81) × 7] = 45.244 kN/m2

P2 = ½(p’a1)h1 + ½(p’a1 + p’a2)hw = (0.5 × 19.494 × 3) + 0.5( 19.494 + 45.244) × 7 = 29.241 + 226.583 = 255.824 kN/m

P1 = P2 + P3
40.5γs = 255.824 + 240.345
On solving;
γs = 12.25 kN/m3

Therefore, among other factors the slurry must have a minimum density of 12.25 kN/m3.

Production of Bioreceptive Concrete

Bioreceptivity is defined as the ability of a material to be colonised by one or more groups of living organisms without necessarily undergoing biodeterioration. By implication, a bioreceptive concrete should support and sustain biological growth without experiencing loss in strength or durability. The use of bioreceptive facades has been suggested as a promising cost-effective solution for combating the loss of green areas due to urbanisation.

In nature, bioreceptive surfaces are characterised by the presence of several stress-tolerant micro-organisms such as bacteria, algae, fungi, lichen, and mosses, which together will form biofilms. According to researchers from the Delft University of Technology, Netherlands, these micro-organisms despite being stress-tolerant still require certain requirements to be met in the substrate before they can survive and thrive. The study was published by the Journal of Building Engineering (Elsevier).

The material characteristics that have been commonly observed to improve bioreceptivity are high capillary water content, high surface roughness, abrasion pH level less than 10, high open porosity, etc. The use of phosphorus has also been been observed to improve to bioreceptivity of concrete by providing nutrients for biological growth. Numerous researches are still ongoing on how to improve bioreceptivity especially in materials like concrete which is the most commonly used building material.

bioreceptive concrete

Concrete has properties and features that are close to that of natural stones on which biofilms can form. However, normal concrete has limited or no capacity to support biological growth. Therefore, for concrete to be made bioreceptive, it has to be designed or developed by modifying or adding to its constituent properties. Therefore, the challenge of creating eco-friendly facades using bioreceptive concrete lies in the material itself. This has been the objective of numerous research works on bioreceptive concrete.

As highlighted earlier, one of the reported challenges of creating bioreceptive concrete is reducing the pH of the concrete. Some research works have used either magnesium phosphate cement or carbonation chambers to reduce the pH of their concrete samples. However, this has always proved to be an expensive solution due to the cost of magnesium phosphate. Researchers from Delft University of Technology however used the addition of blastfurnace slag to ordinary portland cement to reduce the pH. According to them, this a common additive in the concrete industry which reduces the pH of the resulting concrete through increased carbonation.

Furthermore, the use of surface retarders was used to achieve increased surface roughness, which the authors described as a commonly applied non-labour intensive procedure. Open porosity and high capillary water content was achieved by increasing the water to cement ratio of the concrete, such that when the hydration reaction is complete, excess pore water will evaporate thereby leaving more voids in the concrete. However, it is important to limit the water-cement ratio to 0.6 in order to not to have a compromised concrete mix in terms of strength. Additionally, crushed expanded clay was used to replace the large diameter aggregates in order to improve the porosity of the mix.

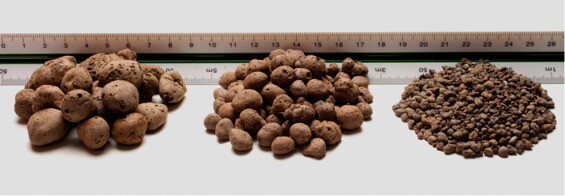
expanded clay aggregate
Expanded clay aggregate

Instead of using phosphorus, the researchers investigated the use of cow bone ash which has been applied in several research works as a partial replacement for cement in concrete production. Cow bone ash contains calcium oxide (CaO) and phosphorus pentoxide (P2O5). The aim of the research work was to investigate the effects of these modifying factors on the bioreceptivity of concrete.

From the research findings, the authors concluded that use of surface retarder increased the bioreceptivity of the concrete likely by increasing the available surface area and by removing the hydrophobic top layer of the concrete. Furthermore, the addition of cow bone ash increased the bioreceptivity of the concrete by making more nutrients (phosphorus) available within the substrate. Crushed expanded clay increased the bioreceptivity of concrete by making the concrete more porous and by a being a bioreceptive material itself.

However, increasing the water to cement ratio did not have a significant effect on the bioreceptivity of the concrete. The research further suggested that it is not necessary to reduce the pH of the concrete to less than 10, since samples with pH more than 10 showed moderate to high biological growth.


Question of the Day | 01-10-2021

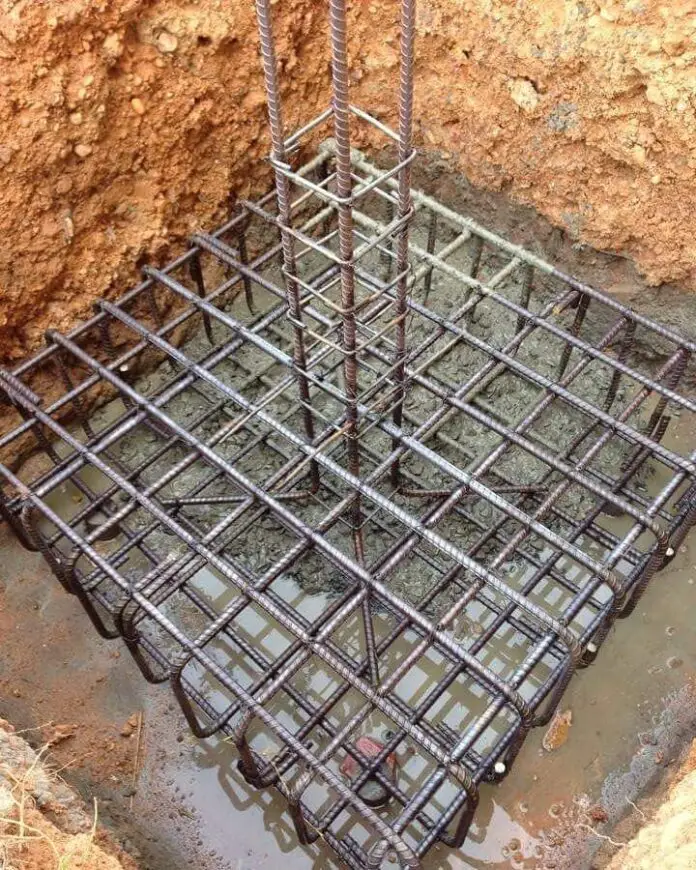
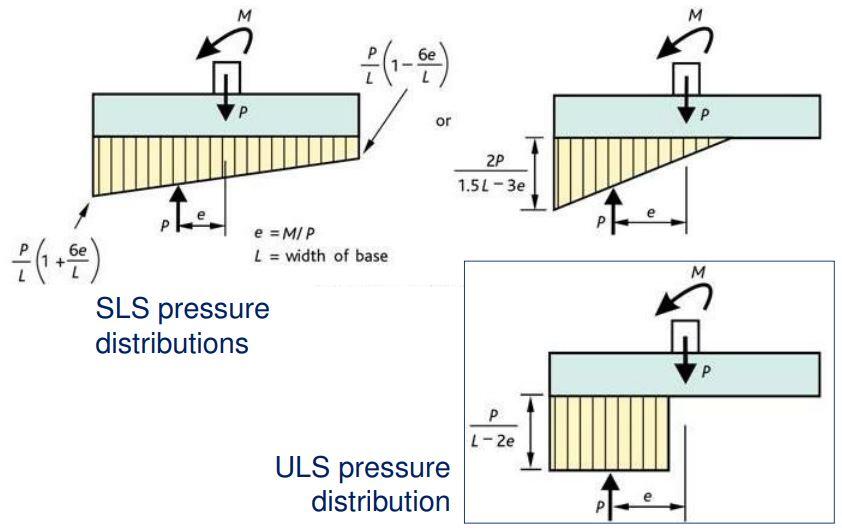
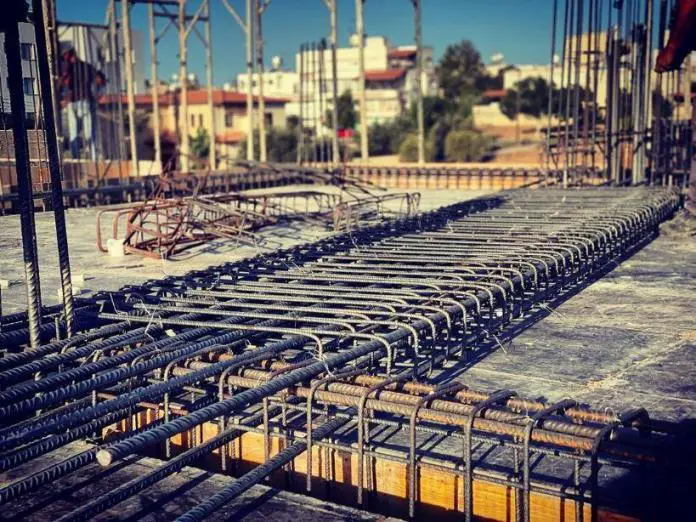
Is there any practical loading condition or analysis of isolated column base (pad foundation) that will require the provision of top and bottom reinforcement as shown in the picture above?

When rigid pad foundations are subjected to eccentric loading, the base pressure distribution becomes either trapezoidal or triangular instead of uniform (rectangular). Any condition that leads to negative pressure (tension) in the soil usually calls for a geometric redesign of the column base size.

pressure distribution of pad foundations

Under which condition can top and bottom reinforcement be required in an isolated pad footing then? Let us know in the comment section.

How to Estimate the Engineering Properties of Fine-Grained Soils

When a soil sample contains a majority of particles (by weight) less than 0.063 mm in size, and stick together when wet, such soil can be described as fine-grained soil. Fine-grained soils usually contain silt and clay particles which can easily be remoulded. Silt particles are between 0.002 mm and 0.063 mm in size while clay particles are smaller than 0.002 mm.

The recommended process for establishing the engineering properties of soils is to carry out as accurately as possible, laboratory or field tests on the soil sample. The tests usually carried out on soils consist of the index properties tests, strength tests, and permeability tests.

Index property tests are usually used for the purpose of soil classification and includes particle size distribution analysis, Atterberg limits tests, linear shrinkage, specific gravity, free swell, etc. These tests are carried out on disturbed soil samples. However, strength tests can include compressibility tests (oedometer tests), shear strength tests, unconfined compression strength tests, CBR, etc. One of the most important tests is the shear strength tests which is used to obtain the angle of internal friction and cohesion of the soil.

According to BS 8004:2015, the following should be considered as minimum when establishing the values of parameters for fine-grained soils:

  • the items listed in BS EN 1997-1:2004, 2.4.3(5);
  • pre-existing slip surfaces;
  • desscation; and
  • any changes in stress state either induced by construction or resulting from the final design condition.

When the plasticity index of a clay soil is greater than 20%, it might exhibit angle of internal friction (angle of shearing resistance) that is considerably lower than that observed at the critical state, if their particles become fully aligned with one another. In BS 8004:2015, this phenomenon is called “sliding shear” in order to distinguish it from from “rolling shear” which is observed in other soils with plasticity index less than 20%. The angle of shearing resistance exhibited during sliding shear is called the “residual angle of shearing resistance“.

Estimation of Undrained Shear Strength of Fine-Grained Soils

According to clause 4.3.1.4.5 of BS 5400:2015, the undrained shear strength of a fine-grained soil may be estimated from the relationship below in the absence of reliable test data:

cu,k/p’v = k1Rok2 = k1(p’v,max/p’v)k2

Where:
cu,k = characteristic underained shear strength
p’v = effective overburden pressure
p’v,max = the maximum overburden pressure that the soil has been previously subjected to;
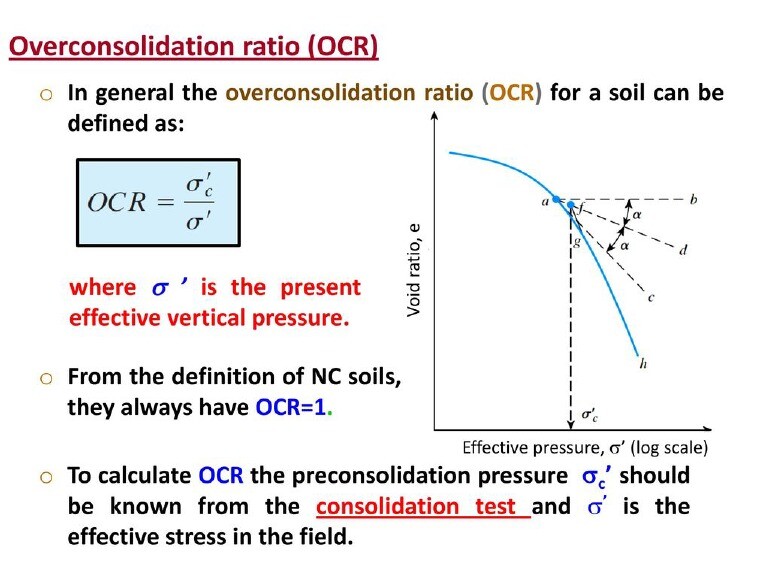
Ro = overconsolidation ratio

k1 and k2 are constants. In the absence of reliable test data, k1 may be taken as 0.23 ± 0.04, while k2 may be taken as 0.8. Furthermore, it should be noted that cu,k/p’v is not a constant but varies with depth.

Overconsolidation ratio of fine-grained soil
Understanding the meaning of overconsolidation ratio

Obviously, consolidation test results should be available before the relationship can be applied. When determining the characteristic undrained strength of high strength fine-grained soils, due allowance should be made for:

  • the detrimental effect of any sand or silt partings containing free groundwater
  • the influence of sampling
  • the influence of the method of testing; and
  • likely softening on excavation

Estimation of Constant Volume Angle of Shearing Resistance of Fine-Grained Soils

In the absence of reliable test data, the characteristic constant volume (ie the angle of internal friction at the critical state) effective angle of shearing resistance φ’cv,k may be estimated from;

φ’cv,k = (42° – 12.5log10Ip) for 5% ≤ Ip ≤ 100%

where:
Ip is the plasticity index of the soil (entered as a %)

The values of φ’cv,k for different plasticity index values based on the expression above is shown in Table 1:

Plasticity Index Ip (%)Characteristic constant volume angle of shearing resistance φ’cv,k (Degrees °)
1527
3024
5021
8018

It should be noted that the effective cohesion at the critical state should be taken as zero (the characteristic constant volume effective cohesion = 0).

The peak effective angle of shearing resistance φ’pk may be related to the constant volume effective abgle of shearing resistance φ’cv by:

φ’pk = φ’cv + φ’dil

Where;
φ’cv is the constant volume effective abgle of shearing resistance
φ’dil is the contribution to φ’pk from soil dilatancy

Column Formwork: Alternatives in Design and Construction

Formwork is an important aspect of the construction of reinforced concrete construction. Column formwork design and construction have evolved over the years with so many alternatives in terms of material selection and installation procedures. Reinforced concrete columns are vertical compression members whose depth to thickness ratio is less than 4, otherwise, it should be described as a shear wall. ACI 318 defined a column as a member with a ratio of height-to-least-lateral-dimension exceeding 3 and is used primarily to support axial compressive load.

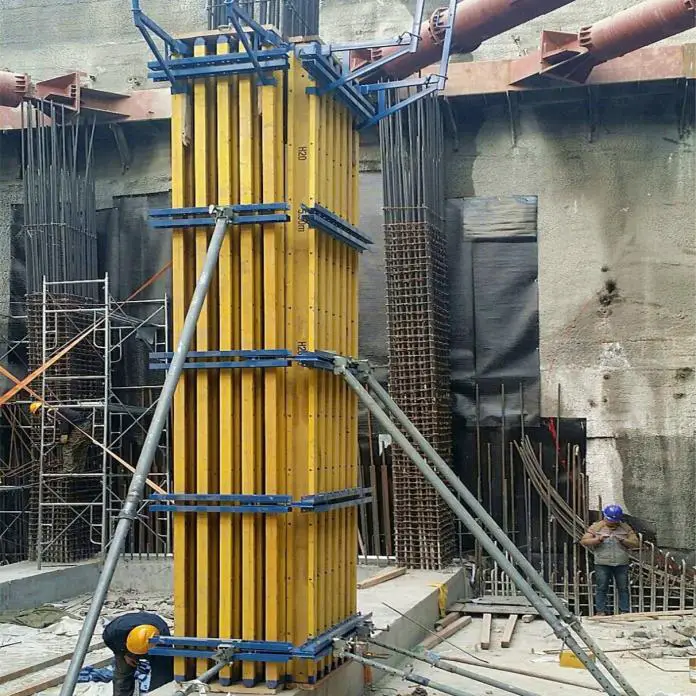
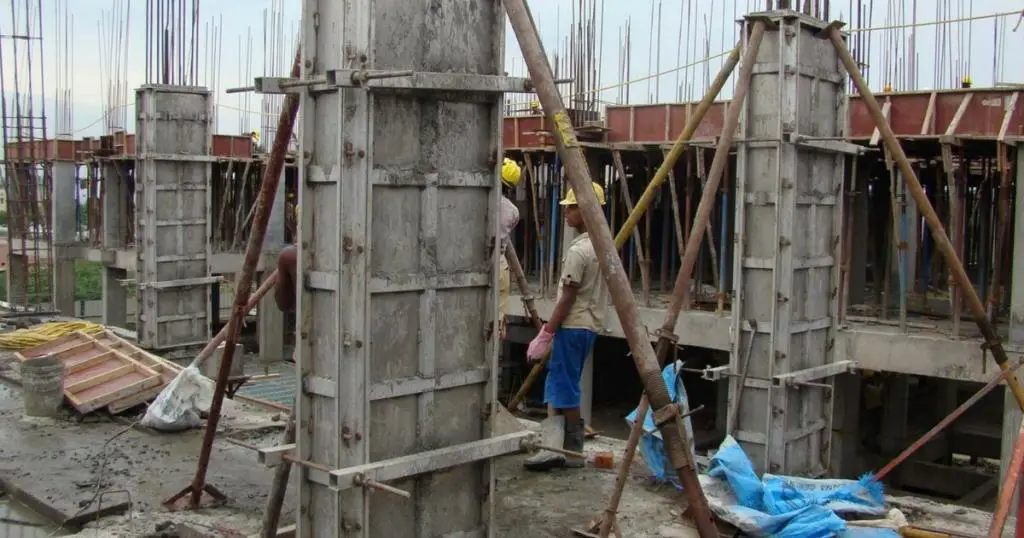
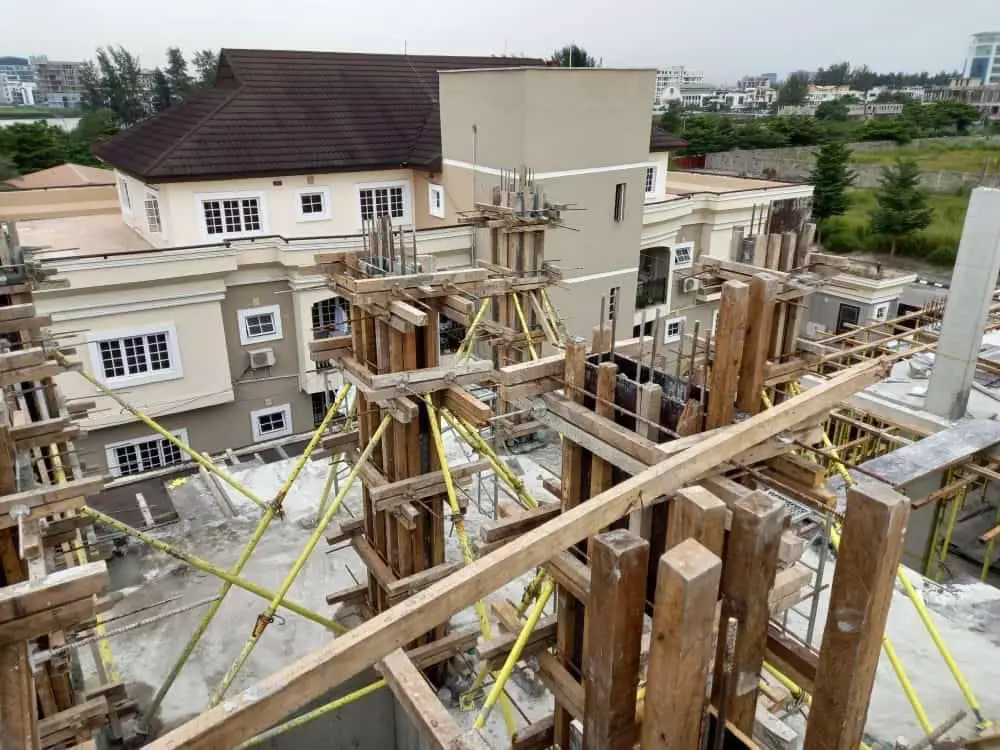
Traditionally, column formworks are entirely constructed from timber planks or plywood with studs, wales, and struts for support. In this case, the timber planks must be sawn to the size of the column with a proper allowance for edge laps and/or closure. The planks are usually joined together through nailing. If the columns in the building are not of the same dimensions, reuse of the column formworks becomes difficult if not impossible. Furthermore, during dismantling, the formworks are prone to damage.

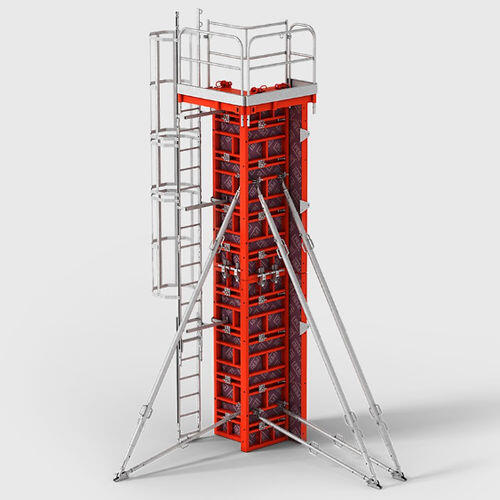
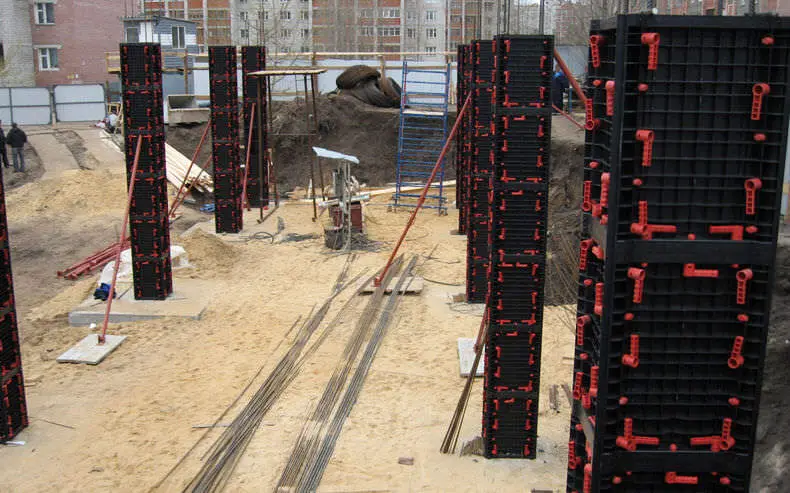
The modern column formwork systems available right now are modular in nature and allow quick assembly and erection on-site while minimising labour and crane time. They are available in steel, timber panels, plastic, aluminium, and even cardboard (not reusable but recycled) and have a variety of internal face surfaces depending on the concrete finish required. Innovations have led to adjustable, reusable column forms which can be clamped on-site to give different column sizes.

peri formwork
Modern composite column formwork (Peri)

A composite system consisting of wooden panels and steel framing is available and offers the advantage of being lightweight when compared to formwork systems that are made of steel. In constructions works where cranes are not available, steel column formworks have been found to be unattractive because of weight. However, modern modular plastic formworks are available which offer lightweight, flexible, and very good re-use potentials to contractors.

Steel column formwork
plastic column formwork
Plastic modular column formwork

Column formworks can also be constructed locally using 20 mm thick plywood, timber studs (or H-beams/Joists), and clamps. Different types of clamps are available and can be constructed locally by welding threaded rods to Y16mm reinforcement bars as shown in the Figure below. Off-cuts of Y25mm bars or strong timber members can be used to hold the column panels and clamps in place. The advantage of this system is the fairly high level of re-use, but the setup and clamping process is more tedious when compared with other types of modular formworks.

column formwork 1
column formwork 3

Construction Sequence of Column Formworks

The basic construction sequence using the modular type of column formwork is as follows:

  1. The column setting out is done as appropriate and the rebars installed.
  2. The concrete kicker of about 75mm thick is cast in the appropriate location
  3. The column forms are assembled and positioned to enclose the column reinforcement.
  4. The column formworks are then positively restrained and braced using props.
  5. Proper checks are done to ensure that columns are perfectly straight and well-aligned before concreting commences.
  6. Concreting is done with minimum disruption of the formwork position.
  7. Column formwork is checked for verticality and alignment after the concreting
  8. Once the concrete has hardened sufficiently the formwork is stripped and moved to the next position manually or by crane. Disposable forms may be left in place for an extended period to aid curing and strength gain of the concrete before removal.

Other Considerations in Column Formwork Installation

  • The column forms are designed for specific maximum concrete pressures. The concrete placement rates have to be adjusted to keep the concrete pressure within the specified limits.
  • The assembled formwork has to be restrained at the base properly to avoid displacement, and grout loss during concreting.
  • In some metal systems, the push/pull props used to stabilise the column formwork are integral.
  • Some systems can be moved on wheels rather than by crane.
  • The formwork and access equipment can be moved in a single operation with some systems
  • Some metal systems can be easily adjusted in plan size and height (by stacking additional panels on top of each other).

Lateral Pressure on Column Formworks

One of the most important parameters in the design of vertical formworks is the lateral pressure exerted on the face of the formwork by the fresh concrete. The lower the plastic viscosity and yield stress of the fresh concrete the more the original lateral pressure will be. However, faster rates of hardening will lead to faster rates of decay in the lateral pressure. Lateral pressure occurs only as long as the concrete is in a fresh state.

The magnitude of pressure exerted by fresh concrete depends on the following;

  1. The depth of fresh concrete from the top (free surface) to the depth under consideration.
  2. The unit weight of the concrete (ρc)
  3. The rate of concrete placement (R)
  4. Temperature of concrete during placement (T)
  5. Unit weight coefficient (Cρ) which depends on the unit weight of the concrete
  6. Chemistry coefficient (Cc) which depends on the type of cementitious materials
  7. Method of concrete placement

According to the ACI Committee 347, the formula for calculating the maximum lateral pressure exerted by fresh concrete on vertical column formworks is;

Pmax = CρCc[7.2 + 785R/(T + 17.8)]

The unit weight coefficient Cρ can be calculated using the Table below;

Density of concreteUnit weight coefficient (Cρ )
Less than 2240 kg/m3 Cρ = 0.5[1 + ρc/2320] but not less than 0.8
2240 – 2400 kg/m3 Cρ = 1.0
More than 2400 kg/m3 Cρ = ρc /2320

The value of the chemistry coefficient Cc can be picked from the Table below;

Type of cementChemistry Coefficient Cc
Types I, II, and III without retarders1.0
Types I, II, and III with retarders 1.2
Other types or blends containing less than 70% slag or 40% fly ash without retarders 1.2
Other types or blends containing less than 70% slag or 40% fly ash with retarders 1.4
Other types or blends containing more than 70% slag or 40% fly ash 1.4

In the UK, the formula for calculating the pressure on formworks according to CIRIA Report 108 is given by the equation below, which must not be greater than the hydrostatic pressure.

Pmax = [C1√R + C2K √(H1 – C1√R)]γ

Where:

Pmax = Maximum lateral pressure against formwork (kPa)
R = Rate of placement (m/h)
C1 = Coefficient for the size and shape of the formwork (1 for walls).
C2 = Coefficient for the constituent materials of the concrete (0.3 – 0.6).
γ = Specific weight of concrete (kN/m3).
H1 = Vertical form height (m).
K = Temperature coefficient K = (36/T + 16)2

Steps in the Design of Column Formwork

The following steps can be adopted in the designing of column formworks;

  1. Determine all the necessary design parameters such as the dimensions of the column, type of concrete, rate of placement, and temperature of placement.
  2. Calculate the design lateral pressure from the fresh concrete, and draw the lateral pressure distribution diagram.
  3. Select suitable plywood (with known mechanical properties) for the sheathing
  4. Select a trial timber backing section (with known mechanical properties) and assume a trial spacing
  5. Determine the bending moment, shear, and deflection of the plywood using the design pressure distribution diagram.
  6. Determine the bending moment and shear on the backing timbers and compare it with the permissible stress of the section.
  7. Design the steel/timber yokes and tie rods by checking the stresses on them. Compare this with the allowable stresses on the members.

What is the likely cause of this failure?

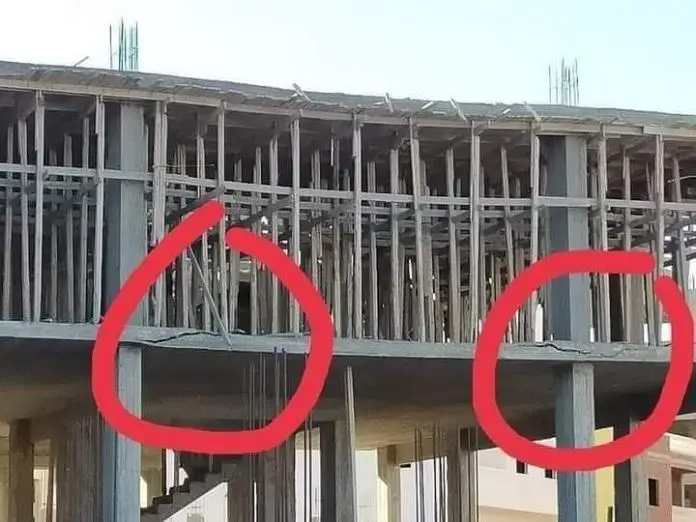
Crack patterns can offer insight into the most likely cause of a structural failure in reinforced concrete structures. Looking at the picture in the post, what is the most likely cause of the structural failure in the building?

Structures are designed to satisfy ultimate and serviceability limit state requirements. Under ultimate limit state requirements, strength requirements such as bending, beam shear, punching shear, axial compression or tension, fatigue, etc are expected to be satisfied. Punching shear occurs when there is a high concentration of localised load (such as column load) on a flat element such as a flat slab or footing.

engeconstrucao CR9KDVErmlw

In serviceability limit state requirements, phenomena that can affect the appearance or functionality of the structure, or comfort of the occupants/users are addressed. Such phenomenon can include deflection, vibration or cracking.

Structural Design of Curved Rafters for Portal Frames

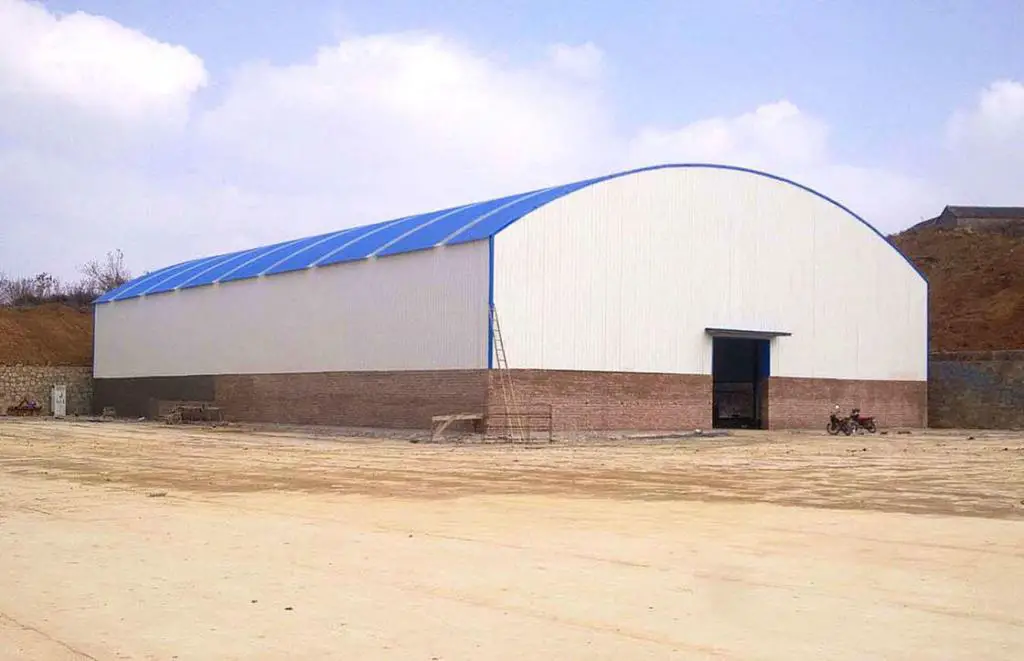
Curved rafters can be adopted in the construction of industrial buildings, warehouses, churches, etc due to their aesthetic appeal. Quite a significant number of portal frames have been constructed all over the world with curved rafters. The relative simplicity of construction can also be a reason for the adoption of curved rafters given that the need for ridge details in the sheeting will be eliminated. Universal Beams are commonly used for curved rafters.

The curving process for a rafter can be achieved using the roller bending or induction bending process, with the former being more popular than the latter due to the cost implications. A straight portion always remains at the end of each bar after curving a member. If a perfectly curved rafter is required, then the straight lengths at the ends should be cut off.

However, for economical reasons, the straight portions can be included to form the final length of the member. This eliminates off-cut waste and the need for making additional cuts. In practical construction, it is difficult to observe the effect of curvature at the end of rafters, therefore it is acceptable to retain the straight portions at the ends. This can also simplify the fabrication of the haunches.

CURVED ROOF WAREHOUSE

Design Issues of Curved Rafters

Discussed in the sections below are some of the issues encountered in the design of curved rafters;

Residual Stresses

It is important to know that the process of curving steel members affects the residual stresses in the member. The magnitude of residual stresses remaining after the curving process depends on the section properties in the plane of curvature. Residual stresses do not affect the cross-sectional resistance of a section.

For Universal Beams curved in elevation (such as curved rafters), the ratio Sx/Zx is typically 1.12. Therefore;

pr = (1.12 – 1)py = 0.12py

This level of residual stress is well within the range commonly found in straight beams due to the differential rate of cooling at the mills between the web and the flange tip. Because the curving process induces strains in excess of the yield strain, the curving process will remove the residual stresses from the straight beam. The residual stresses will therefore be limited to those caused by the curving process, and are not in addition to those in a straight beam.

Out-of-plane bending of flanges due to curvature

The flanges of curved rafters subject to in-plane bending or axial loads must also resist the out-of-plane component of loads resulting from the curvature of the member. This applies to both open sections and box sections.

The out-of-plane bending stress of an I-section is given by;

σ2 = 3σ1b2/RT

Frame analysis – elastic or plastic?

According to King and Brown (2001), elastic frame analysis may be used for any frame with members curved in elevation, provided that the geometry of the curved elements is allowed for. The member resistance checks for structures designed elastically. Plastic analysis is common for portal frames with straight members, and may also be used, within limits, to analyse portal frames with curved rafters.

Modelling curved members for analysis

Computer software can normally only model straight lengths of elements. It is possible to use a series of short straight segments to model a curved member but there are several issues that should be considered. The accuracy of the model will improve with the number of analysis elements, provided that these are chosen so that the off-set between the curved member and the segments is minimised.

The choice of the number of elements will depend largely on the curvature of each curved member. For members with a very slight curvature, there is normally no need to divide the model into a large number of analysis elements, as the differences between the analysis model and the actual structure can be accounted for simply.

Procedure for the design of curved rafters

In common with all portal frames, the following steps must be followed:


· determination of initial sizes
· check of in-plane stability
· check of member resistances

To show how this can be done, a solved example is presented below. The design procedure and geometry are similar to the same presented by King and Brown (2001) using BS 5950-1:2000 design code.


Initial sizes

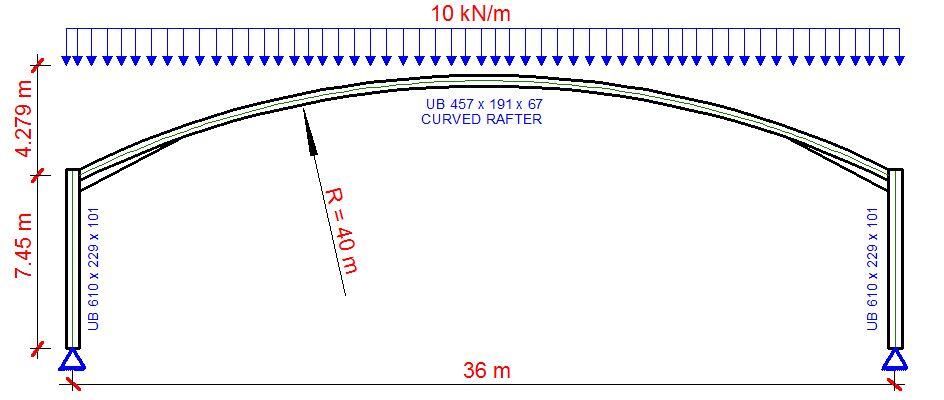
Following an initial analysis, the members shown in the general arrangement below were chosen. The purlins are spaced at 1.5m centre to centre.

Loading on curved rafter

Section Properties

Rafters – 457 x 191 x 67 UB S275

D = 453.4mm; B =189.9 mm; t = 8.5 mm; T = 12.7mm; r = 10.2 mm; A = 85.5 cm2; J = 31.1 cm4; Zx = 153 cm3; Zy =153 cm3; Sx = 1470 cm3; Iy = 1450 cm4; ry = 4.12 cm; rx = 18.5 cm; H = 0.705 dm6


In-plane stability

The portal geometry must be checked to ensure the (simple) sway-check method may be used to verify that the portal is stable in-plane.

5 × h = 5 × 7.450 = 37.25 m
span, L = 36 m < 37.25 m Okay


Rise hr = 4.279 m (based on centre-line dimensions)
0.25 × span = 0.25 × 36 = 9 m > 4.25 m Okay

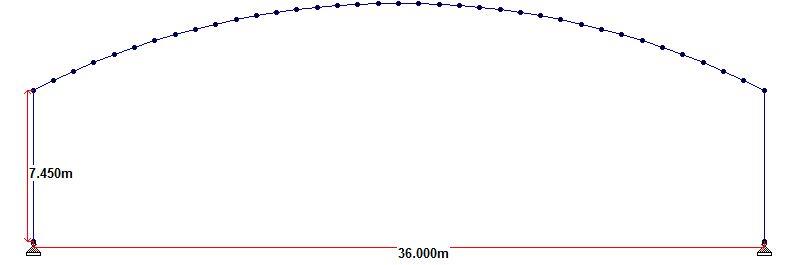
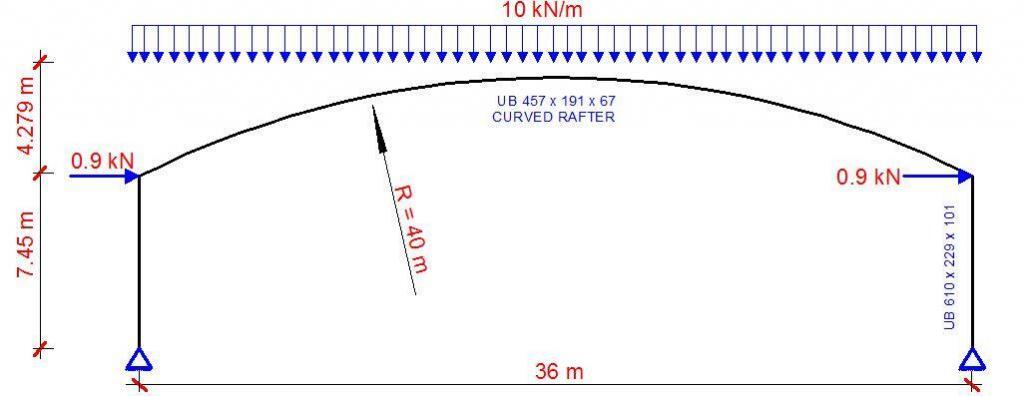
The sway-check method may therefore be used. The notional horizontal loads are taken as 0.5% of the base reaction and applied horizontally in the same direction at the top of each column. The modelling has been carried out using Staad Pro software with 36 straight members to form the curved rafters as shown below.

modelling of curved rafters on staad pro

With a uniformly distributed ultimate limit state load of 10 kN/m, a vertical reaction of 180 kN was obtained at both supports. The horizontal notional load applied at the top of each column was calculated as (0.005 × 180 = 0.9 kN).

notional loading on curved rafters

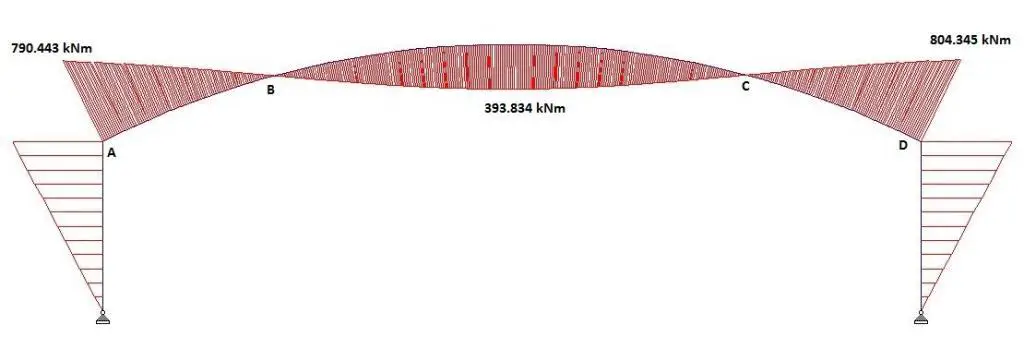
The checks on the columns are no different from those in portal frames with all straight members, and are not included in this example. Between A—B, and C-D, the curved rafter is in hogging. The bending moment produces compression on the concave side of member, and the design resistance is at least that of a straight member.

The regions A-B and C-D should be checked as if straight, with full consideration of restraint positions etc. Between points B and C, the curved rafter is sagging. The bending moment produces compression on the convex side of the member, reducing its capacity. The following checks illustrate how the member in this zone should be checked.

bending moment on curved rafter

From the analysis, the maximum forces between B and C (assumed to coexist).

Where:
MEd = 393.834 kNm
NEd = 128 kN
VEd = 73.2 kN

Reduced Design Strength

The curvature of the rafter induces bending stresses in the flanges, which combine with the axial stress to reduce the effective yield stress of the section. The reduced design strength, Pyd, is calculated following the procedure given in Section 6.3.2 of King and Brown (2001):


Calculate the out-of-plane bending stress:

σ2 = 3σ1b2/RT
σ1 = MEd/Zx + NEd/A = [(393.834 × 10⁶)/(1300 × 103) + (128 × 103)/(85.5 × 103)] = 304.446 N/mm2
b = 0.5(B – t -2r) = 0.5(189.9 – 8.5 – 2 × 10.2) = 80.5 mm
σ2 = 3σ1b2/RT = (3 × 304.446 × 80.52)/(40 x 1000 × 12.7) = 11.65 N/mm2

The reduced design strength can then be calculated using the equation below;
pyd = [py2 – 3(σ2/2)2 – 3τ2]0.5 – (σ2/2)

Ignoring the shear stress τ
pyd = [2752 – 3(11.65/2)2]0.5 – (11.65/2) = 268.989 N/mm2

Cross-section capacity

This is calculated in accordance with BS 5950—1 Clause 4.8.3.2 but substituting Pyd for py
The relationship to be satisfied is:

NEd/Agpyd + MEd,x/Mcx + MEd,y/Mcy ≤ 1.0

(128 × 103)/(85.5 × 103 × 269) + (393.834 × 10⁶)/(1470 × 103 × 269) + 0 = 1.000 (Okay)

Lateral-torsional buckling

Lateral-torsional buckling between purlin positions must be checked, because the bending moment produces compression on the convex side of the member, and the resistance of the member is reduced.

Calculate effective slenderness

λLT = √(McxπE)/(MEpyd)

me

a = EIy = 205 × 103 × 1450 × 104 = 2.97 × 10¹² Nmm2
b = GJ + (π2EH/L2)

Assuing the purlins are spaced at 1.5 m centre to centre

b = [(205 × 103 × 37.1 × 104)/2(1 + 0.3)] + (π2 × 205 × 103 × 0.705 × 1012)/15002 = 6.3395 × 10¹¹ Nmm2

c = a + b = 2.97 × 10¹² + 6.3395 × 1011 = 3.603957 × 10¹² Nmm2

ME = [-90098941.71 + √ (90098941.712 + 3.3031385 × 10¹⁹]/2 = 2828950478 Nmm =2828.95 kNm

λLT = √(McxπE)/(MEpyd) = √(1470 × 103 × 269 × π2 × 205 × 103 )/( 2828950478 × 269) = 32.42

Lateral torsional buckling resistance

To check lateral-torsional buckling, Clause 5.5.2 directs the designer to Clause 4.8.3.3. In-plane stability has already been checked by the sway stability provisions (Clause 5.5.4) so, in general, only the second relationship (covering out-of-plane effects) needs to be satisfied.

For out-of-plane buckling:

NEd/PcY + mLTMLT/Mb ≤ 1.0

For Pcx , Le (eaves to apex) = 18.5 m approximately. Assuming a straight member without haunches:
λy = L/ry = 1500/41.2 = 36.4; pcy = 250 N/mm2
AgPcy = 8550 × 250 × 10-3 = 2137.5 kN

Over a length between purlins, the moment will be taken as constant, therefore, mLT = 1.0
with λLT = 32.42, and py = 275 N/mm2
pb = 274 N/mm2

Mb = pbSx = 274 × 1470 × 10–3 = 402.78 kNm

NEd/Pcy + mLTMLT/Mb = (128)/(2137.5) + (1.0 × 393.834)/( 402.78 ) = 1.037 > 1.00


The section is at limiting equilibrium between B and C and may be accepted for ULS or a slightly higher section selected. Rafter sections A–B and C–D, and the columns, must be checked as straight members.

References
King C. and Brown D. (2001): Design of curved steel. The Steel Construction Institute, UK

The Truth About Hidden Beams | Concealed Beams

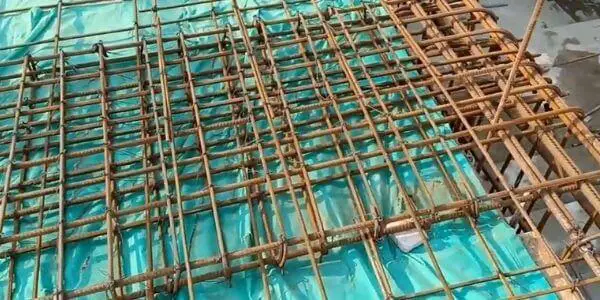
The internet space (mostly blogs) is filled with so much information about hidden beams (also called concealed beams) which is defined as a beam whose depth is equal to the thickness of the slab. In other words, the beam is embedded inside/within the reinforced concrete slab. However, in standard civil engineering textbooks, codes, and standards, no mention is usually made of hidden beams. On a very simple explanation, the idea of hidden beams is the provision of more reinforcements with shear stirrups in a banded area of a floor slab.

According to the literature review of a 2020 research carried out in Ankara, Turkey, and published by the Journal of Building Engineering (Elsevier) no previous literature on experimental studies on hidden beams was encountered by the authors. By implication, prior to the year 2020, no experimental studies have been published on the behaviour of hidden beams.

On the issue of hidden beams, the researchers (Özbek et al., 2020) said,

… some of the designers illegally try to remove the beams by arranging the reinforcement with equivalent strength in the slab and call it the hidden beam. In other words, these hidden beams are constructed by placing additional longitudinal reinforcing bars in the slab along the line where the actual beam should have been present.

hidden beam
Figure 1: Typical hidden beam arrangement in a floor slab

In the research by Özbek et al., (2020), reinforcement ratio and slab thickness were used as the test parameters for the 14 specimens used in the pioneering research campaign. The results showed that hidden beams were able to achieve reference strength of equivalent drop beams after excessive deformations (about eight times larger) or in some cases never achieved the reference strength.

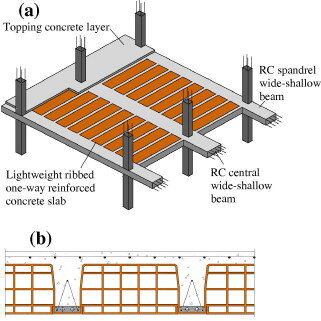
A construction concept that comes close to the so-called hidden beams is the idea of a wide-shallow beam or wide-band beams. A wide-shallow beam is a beam whose depth is generally lower than 350 mm with a cross-section having the width over the depth ratio greater than 2. However, the commonly used values in practice are 250–300 mm for depth and 4–5 for the width to depth ratio (Özbek et al., 2020). Wide-shallow beams are usually adopted in the construction of one-way ribbed slabs and maintain the same thickness with the slab for architectural convenience and for supporting partition loads.

wide shallow beams
Figure 2: Wide shallow beams (Conforti et al, 2013)

In a numerical modelling study published in the Asian Journal of Engineering and Technology by Mohd and Helou (2014) titled ‘Slabs with hidden beams: facts and fallacies‘, the authors concluded that in comparison with the system of drop beams, selected as a comparison basis, hidden beams provide little, if any, added value. Moreover, under monostatic loading, the hidden beams behave more of a slab than a beam.

Furthermore, Helou and Awad (2014) suggested that the presence of hidden can add to the vulnerability of the supporting columns under seismic conditions since they tend to be significantly stiffer than the columns thereby contradicting the preferred strong column-weak beam arrangement.

Numerical Modelling of Hidden Beams

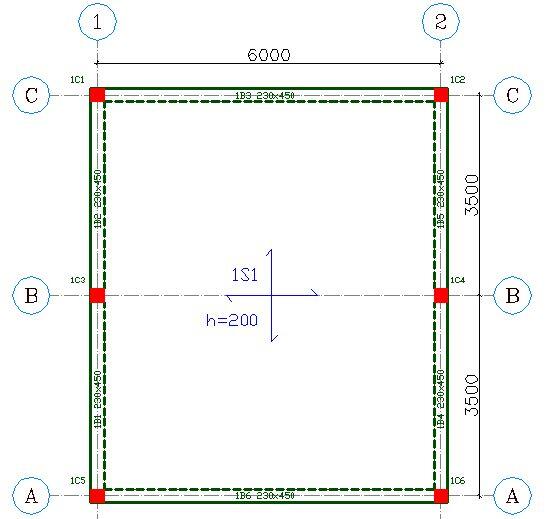
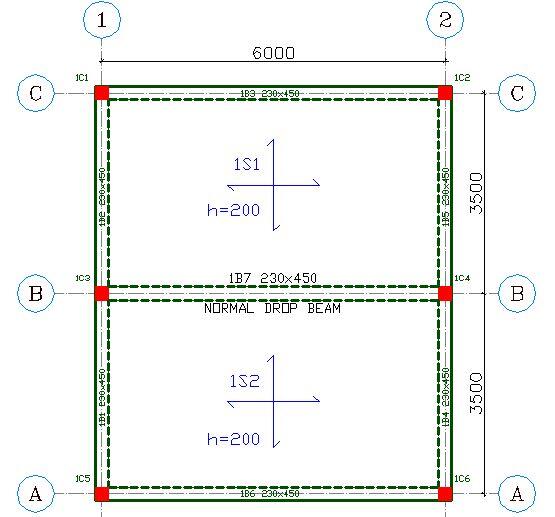
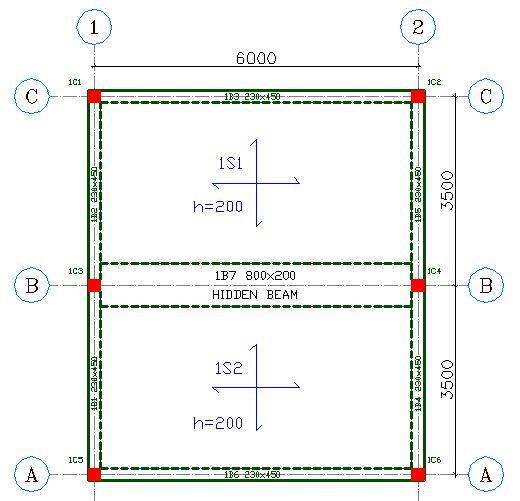
To investigate the design concept of a typical hidden beam, a simple numerical model was carried out using design software, Prota Structures. A simply supported slab of dimensions 7m x 6m and thickness of 200 mm was modelled under the following conditions;

(a) A solid slab without internal beams (CASE 1)

SLAB WITHOUT DROP BEAM
Figure 3: Solid slab with no internal beam


(b) A solid slab with a drop beam (450 x 230 mm) at the midspan (CASE 2)

SLAB WITH NORMAL DROP BEAM
Figure 4: Solid slab with normal drop beam at the mid-span


(c) A solid slab with a beam of 200 mm depth and width of 800 mm at the midspan (hidden beam)CASE 3

plan of slab with hidden beam
Figure 5: Solid slab with hidden beam at the mid-span

Design data
fck = 25 MPa
fyk = 460 Mpa
Concrete cover = 25 mm
Imposed/live/variable action (load) = 3 kN/m2
Additional dead/permanent action (finishes) = 1.5 kN/m2

Analysis Results

Case 1
From the analysis and design of the floor system as a solid slab without any internal beam, the maximum elastic deflection under the reference load was observed to be 18 mm. For the design, the use of T12@100 c/c (parallel to the short span) was observed to satisfy strength and deflection requirements with allowable span/effective depth ratio of 37.98 and actual span/effective depth ratio of 35.503.

deflection of solid slab
Figure 6: Deflection profile of the solid slab

Case 2
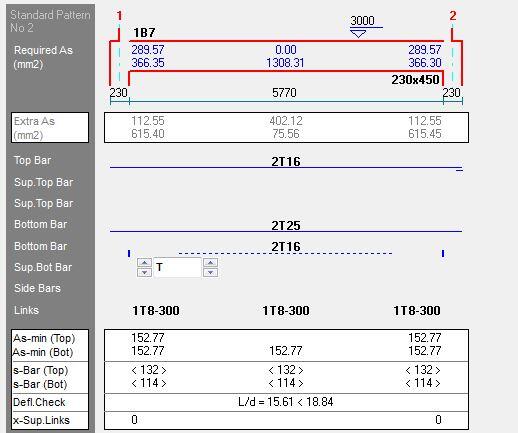
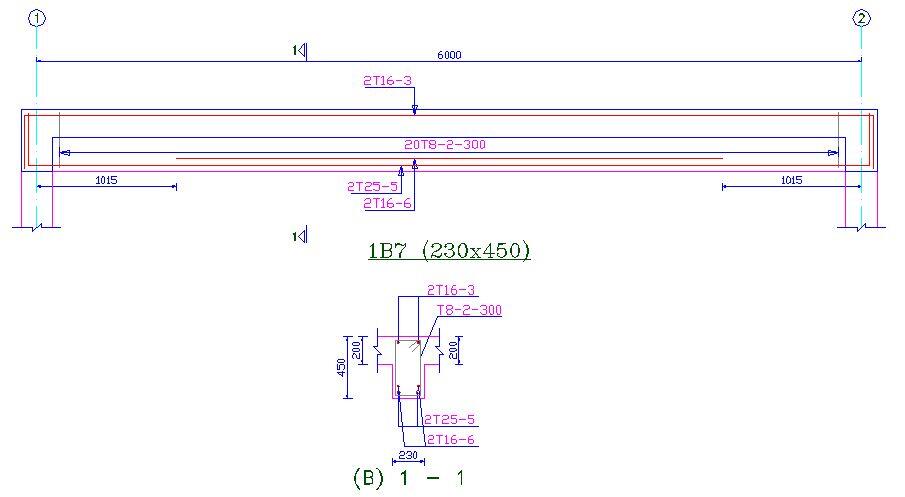
For the slab with a normal drop beam of 450 x 230 mm at the mid-span, the following analysis and design results were obtained for the normal drop beam. At the bottom of the beam (tension zone), the area of steel required was 1308 mm2, while the area of steel provided was 1384 mm2 (2T25 + 2T16). The allowable span/effective depth ratio was calculated as 18.84 while the actual span/effective depth ratio was calculated as 15.61. By implication, the design requirements were observed to be satisfied as shown in Figure 7. The reinforcement detailing is shown in Figure 8.

DROP BEAM
Figure 7: Design snippet of the normal drop beam
DROP BEAM DETAILS
Figure 8: Reinforcement detailing drawing of the normal beam

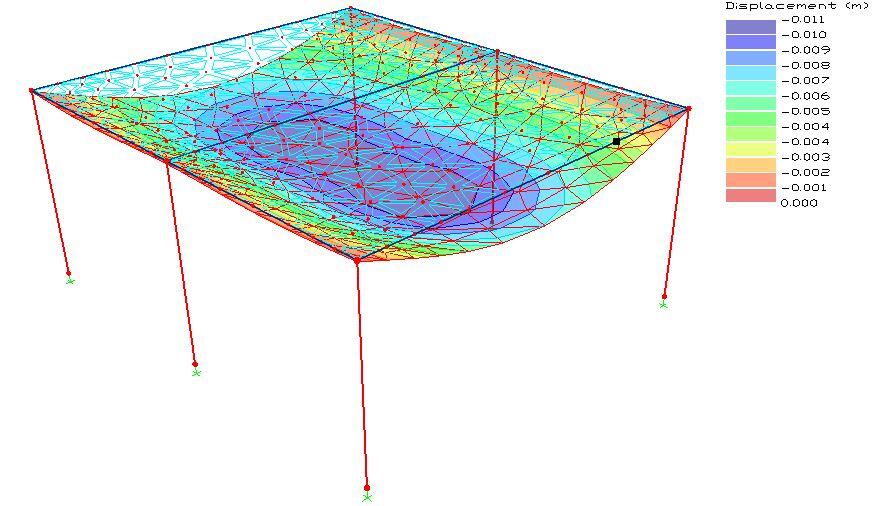
The elastic deflection of the slab under the reference load and arrangement (drop beam at the mid-span) as shown in Figure 9 was observed to be 11 mm;

with drop beam
Figure 9: Deflection profile of the solid slab with normal drop beam at the mid-span

Case 3
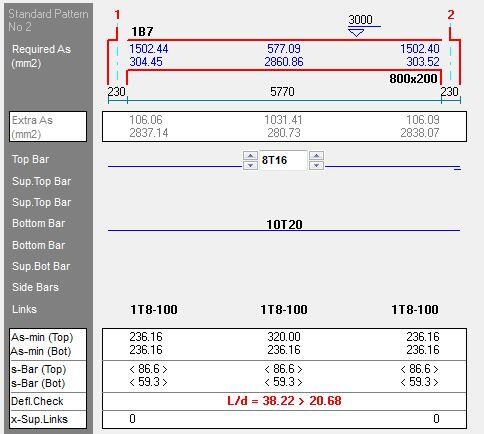
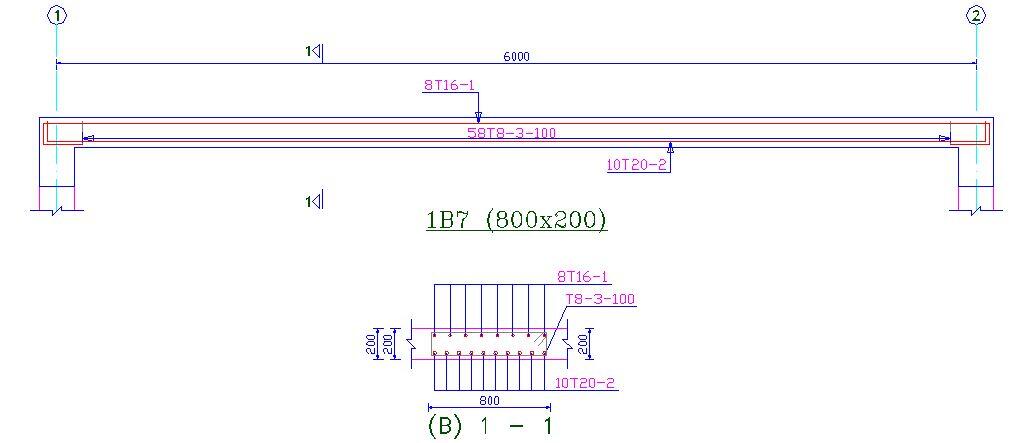
For a slab with a hidden beam of 200 x 800 mm, the following analysis and design results were obtained for the hidden beam. The area of tension reinforcement required was calculated as 2861 mm2, while the area of compression reinforcement required was calculated as 577 mm2. The area of steel provided in the tension zone was 3140 mm2 (10T20), while the area of steel provided in the compression zone was 1608 mm2 (8T16).

Furthermore, unusually high reinforcement requirement was observed at the supports of the hidden beam. The allowable span/effective depth ratio was calculated as 20.68 while the actual span/effective depth ratio was calculated as 38.22. By implication, despite the heavy reinforcement provided in the band of the hidden beam, it failed in deflection using ‘deemed to satisfy rules’ as shown in Figure 10. The reinforcement detailing is shown in Figure 11.

Design snippet of a hidden beam
Figure 10: Design snippet of the hidden beam
Reinforcement detailing of a hidden beam
Figure 11: Reinforcement detailing of the hidden beam

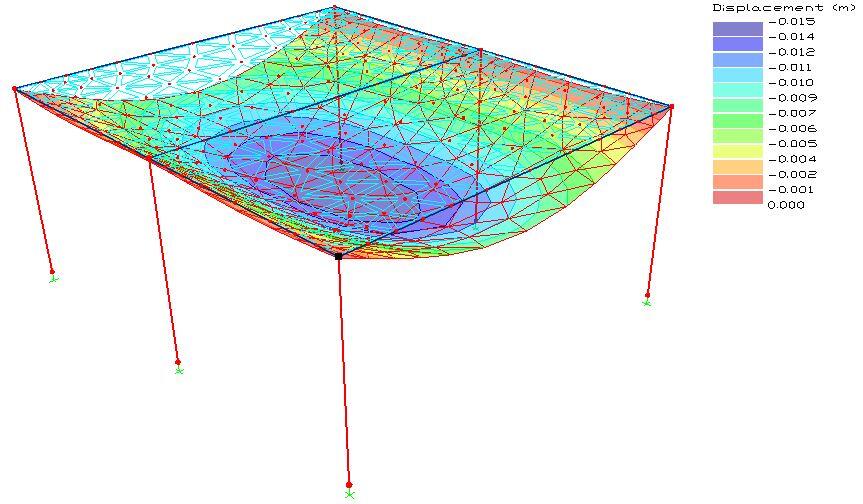
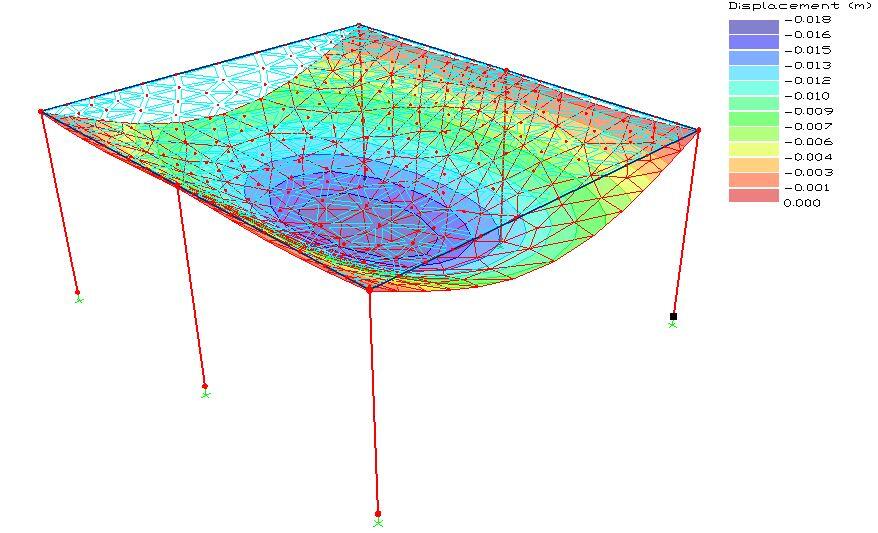
The deflection of the slab under the reference load and hidden beam arrangement as shown in the Figure 12 was observed to be as 15 mm.

DISPLACEMENT HIDDEN BEAM
Figure 12: Deflection profile of the solid slab with a hidden beam at the mid-span

Conclusion

From the literature surveyed and from the simple numerical model carried out in this study, the use of hidden beams do not appear to be favourable or significantly beneficial to the behaviour of floor slabs. In other words, the parameter that significantly affects the deflection behaviour of slabs which is the depth will effectively remain constant, while the designer tweaks the area of steel for higher modification factor. In other words, the design of hidden beams can only be based on strength and not deformation.

A lot of blogs suggest that hidden beams are designed as normal beams, with the sole difference of having the same depth with the slab. However, a little study of the hidden beam designed in CASE 3 showed that it failed in deflection and will not likely pass no matter how how the reinforcement is tweaked. By implication, if the hidden beam is assumed as a regular support and the slab designed as two panels as in CASE 2 (lx = 3500 mm), the slab will still likely have serious problems with deflection, unless the satisfactory Y12@100 c/c steel or equivalent area provided in the slab. This therefore makes no economical sense.

Therefore, the use of hidden beams in floor slabs appears to be an imaginary strength enhancing concept without any research based technical backing so far.

References

[1] Conforti A., Minelli F., Plizzari G. A. (2013): Wide-shallow beams with and without steel fibres: A peculiar behaviour in shear and flexure. Composites Part B: Engineering (51):282-290 https://doi.org/10.1016/j.compositesb.2013.03.033
[2] Helou S. H. and Awad R. (2014): Performance-based analysis of hidden beams in reinforced concrete structures. MATEC Web of Conferences (16)100001 (2014)
[3] Mohd M. and Helou S. (2014): Slabs with Hidden Beams, Facts and Fallacies. Asian Journal of Engineering and Technology 02(04):316-319
[4] Özbek E., Aykaç B., Bocek M., Cem Yılmaz M. C., Mohammed A. B. K., Er S. B., Aykaç S. (2020): Behavior and strength of hidden Rc beams embedded in slabs. Journal of Building Engineering, 29(2):101130. https://doi.org/10.1016/j.jobe.2019.101130

Evaluation of Surcharge Load on Earth Retaining Structures

Earth retaining structures are subjected to a myriad of loads such as earth pressure, water pressure, and earthquake loads (in seismic zones). However, when loads are applied on the earth retained at the back of the retaining wall, surcharge loads are induced on the retaining structure. The magnitude of lateral pressure transferred to the wall depends on the spatial distribution of the load, its magnitude, and location (distance away from the wall). The aim of this article is to evaluate the common sources of surcharge loads on earth retaining structures.

Different forces or loads can be placed on the earth being retained. These loads will produce a surcharge on the retaining structure. Surcharge loads on retaining walls can be permanent or temporary. The most common sources of surcharge are;

  • Foundations of structures close to the retaining wall
  • Pavements or compound floorings
  • Moving vehicles (traffic)
  • Construction equipment
  • Compaction process
  • Variation in ground surfacing/undulations

These loads vary in spatial distribution and will exert different magnitudes and distributions of lateral pressure. For instance, the surcharge pressure exerted by a uniformly distributed concrete flooring will be quite different from the surcharge load due to an isolated footing close to the retaining wall. Let us now review these possible loads/actions in detail;

General Loading Condition

According to BS 8002, the minimum surcharge load that should be applied to retaining walls is 10 kN/m2. For shallower retaining walls, the surcharge may be reduced if the designer is confident that a surcharge of 10 kN/m2 will not occur during the life of the structure.

Additional surcharge loading should be used in the design to take account of incidental loading arising from the construction plant, stacking of materials, and movement of traffic both during construction and subsequently unless the nature or layout of the site precludes the need for such additional surcharge. However, as practicable as possible, stockpiling materials close to retaining walls should be avoided.

Uniform surcharge loads such as that due to HA load and 45 units of HB loads (with values of10 kN/m2 and 20 kN/m2 respectively) will exert a rectangular pressure distribution on the back of the retaining wall. The magnitude of the surcharge pressure (ps) will be given by;

ps = khq (kN/m2)

Where;
kh = coefficient of active earth pressure or at rest (as appropriate)
ka = coefficient of active pressure = (1 – sin Φ’)/ (1 + sin Φ’)
k0 = coefficient of earth pressure at rest = 1 – sin Φ’
q = characteristic value of the surcharge load (kN/m2)

surcharge load and surcharge pressure distribution
Figure 1: Typical surcharge load and surcharge load lateral pressure distribution

Imposed Surcharge Loads from Traffic: Highways

Where retaining walls give support to highways it was traditional to check for the effects of HA loading at ground level. HA surcharge load is usually taken to be 10 kN/m2. According to BD37/01, the surcharge load for 45 units of HB load should be 20 kN/m2. The equivalent to BS EN 1991-2 and the UK NA is the application of the load model in Figure NA.6 of the National Annex, where the axle loads are 65, 65, 115, and 75 kN (S = 320 kN) at centres 1.2, 3.9 and 1.3 m apart (S = 6.4 m) as shown in Figure 2. Each axle consists of two wheels of equal load at a distance of 2.0 m apart.

LOAD MODEL FOR NORMAL TRAFFIC SURCHARGE
Figure 2: Normal traffic surcharge load model (EN 1991-2, UK NA)

Clause 6.6.3 of PD 6694-1 allows an alternative. For global effects on ‘other earth retaining walls’ adjacent to highways, two vertical uniformly distributed transverse line loads of QL, are applied 2.0 m apart on a notional lane of the carriageway, where

QL = 320/(2 × 6.4) = 25 kN/m over a length of 6.4 m

Besides normal γQ factors, axle loads and line loads are subject to an overload factor of 1.5 and, when checking a single vehicle in one notional lane, a dynamic factor of 1.4. The dynamic factor dissipates to 1.0 at 7.0 m depth or when convoys of vehicles are considered in each notional lane (representing a traffic jam situation).

In association with the axle loads or line loads, it is suggested that a surcharge of 5 kN/m2 is applied as an imposed load to pavements adjacent to basements. This figure is in agreement with NA.2.36 of the UK NA to BS EN 1991-2 as a maximum uniformly distributed load for continuous dense crowding (e.g. footbridges serving a stadium) and with BS EN 1991-1-1 for traffic and parking areas with vehicles > 30 kN.

Concentrated Surcharge Loads (Point Loads)

Using Boussinesq equations to determine vertical pressure, lateral pressure at a point O on a wall due to a discrete load Q as shown in Figure 3 may be taken as:

σ’ah = Kh(3QZ3)/(2πR5)

where
Kh = Kad or K0d (coefficient of active pressure or at rest as appropriate)
Q = load, kN
Z = depth, m
R = (x2 + y2 + z2)0.5

concentrated surcharge load on retaining wall
Figure 3: Schematic representation of point load and line load surcharge

It is recommended that horizontal earth pressures against ‘rigid’ walls determined using Boussinesq’s theory of stresses in an elastic half-space should be doubled for design purposes. Boussinesq’s theory for horizontal pressures assumes horizontal movement. However, with truly rigid walls there is actually no movement. So an identical balancing surcharge on the other side of the wall, i.e. a mirror image surcharge, is required and this in effect doubles the pressure. Doubling pressure is in line with field data by Terzarghi and with French practice.

Surcharge Line Load Parallel to Retaining Wall

Assuming that the length of the load is comparable to that of the wall, lateral pressure at a point O will depend mainly on the depth z. In this case, lateral pressure may be taken as:

σ’ah = Kh(2QZ3)/(πR4)

where
Kh = Kad or K0d as appropriate
Q = load per metre length of load kN/m
Z = depth, m
R = (x2 + z2)0.5

As explained earlier, it is recommended that horizontal earth pressures determined using Boussinesq’s theory of stresses in an elastic half-space should be doubled.

Strip Surcharge Load Parallel to Retaining Wall

Assuming that the length of the load is comparable to that of the wall, lateral pressure at a point O will depend only on the depth z as shown in Figure 4. In this case, lateral pressure may be taken as:

σ’ah = Kh(q/π) [α + sinα cos(α + 2β)]

where
Kh = Kad or K0d as appropriate
q = load per metre width of load
α, β = angles (in radians)

strip load surcharge on retaining wall
Figure 4: Schematic representation of strip load surcharge

Rectangular Surcharge Loads Exerting Uniform Pressure

Rectangular loads such as pad footings will exert a surcharge load on retaining walls. Standard textbooks provide solutions for vertical stress, σ’v,z at depth z under a corner of a rectangular area carrying a uniform pressure q. It is usually in the form;

σ’v,z = qIr

where;
q = uniform pressure
Ir = coefficient.

Values of Ir are provided for different aspect ratios of the loaded area to depth and can be read from Fadum’s chart. Lateral pressure at the required depth may be determined as KhqIr. The method of superposition allows the determination of vertical stress under any point within or outside the loaded area. An example of this has been presented on how to apply surcharge load from pad footings to retaining walls.

Compaction Pressure on Retaining Walls

The lateral pressure due to the action of compacting equipment can induce surcharge load on the earth retaining structure. The magnitude of the lateral pressure depends on the characteristic design compaction design force, the unit weight of the soil, and the coefficient of earth pressure adopted. The compaction pressure of machines on earth retaining walls can be read here.

How to Design Built-up Beams | Welded-Plate Girders

Sometimes, I-beam sections or girders are built up by welding structural steel plates together. This is usually done when the section required is so heavy that it cannot be picked from the standard sections available, or when the section required is not available with local manufacturers or dealers.

The difference between hot-rolled I-section and welded steel sections is shown in Figure 1. The design of a built-up beam (plate girder) involves the selection of adequate individual section sizes, weld sizes, and stiffeners (if required), and verifying their performance as a composite whole in satisfying ultimate and serviceability limit state requirements.

Built-up beam section
Figure 1: (a)Built-up I-beam (b) Hot rolled I-section

Design Example of Built-Up Beams

Ghosh (2010) presented an example of the design of a welded-plate girder for a crane gantry in an iron melting workshop/industry. The example has been reproduced here to show how to design welded-plate girders according to the requirements of EN 1993-1-1:2005.

Design Forces

Ultimate design vertical moment = Mvu = 29515 kNm
Ultimate design vertical shear force = Vvu = 6282 kN
Ultimate design horizontal moment = Mhu = 601 kNm
Maximum ultimate horizontal longitudinal tractive force = 312 kN
Span of girder = 24 m

Design of section
The section will be designed as a welded-plate girder. Eurocode 3, Part 1-1 (Eurocode, 2005) will be followed. The tables and figures referred to below can be found in Annex A of the Eurocode (Appendix B of this book), except where otherwise mentioned.

built up beams
Figure 2: Huge welded I-Section

Design strength
By referring to Table 3.1 of Eurocode 3 (“Nominal values of yield strength fy and ultimate tensile strength fu for hot-rolled structural steel”), the design strength (fy) in the ULS method of design for the flanges and web can be obtained; its value varies with the thickness of plate considered.

In our case, we adopt steel grade S275 with a design yield strength fy = 275 N/mm2. So, for a nominal plate thickness t ≤ 40 mm, fy = 275 N/mm2, and for t ≤ 80 mm, fy = 255 N/mm2. If the design strength of the web fyw is greater than the design strength of the flange fyf, then the design strength of the flange should always be used when considering moments or shear.

Initial sizing of section
The dimensions of the webs and flanges are assumed to be as given below. Overall depth of girder = h. The depth should be chosen to limit the allowable deflection. In practice, the overall depth should normally be taken to be between 1/10 and 1/12 of the span. In our case, we assume the overall depth h = 1/10 of span = 23.4/10 = 2.34 m = 2340 mm. We assume an overall depth h = 2500 mm (as the girder is subjected to high dynamic wheel loads).


Depth of straight portion of web (d)
d = h − (2 × size of weld) − (2 × thickness of flange )= 2500 − 2 × 12 (assumed weld size) − 2 × 55 (assumed) = 2366 mm.

Breadth of flange (b)
The breadth of the flange should be at least 1/40 to 1/30 of the span in order to prevent excessive lateral deflection. In our case, we assume a breadth b = 1/30 of span = (1/30) × 23.4 = 0.78 m, say 0.9 m = 900 mm.

Thickness of web (tw)
Several tests have shown that the web does not buckle owing to diagonal compression when the ratio d/tw is less than 70, if the web is not stiffened by a vertical transverse stiffener. Referring to Table 5.2 (sheet 1) of Eurocode 3, Part 1-1, the minimum thickness of web required to avoid buckling of the compression flange in the ULS design method with an unstiffened web is as follows.

For class 1 classification,
d/tw ≤ 72ε, where
ε = stress factor = (235/fy)0.5 = (235/255)0.5 = 0.96;
d/tw = 2366/tw = 72 × 0.96
Therefore tw = 2366/(72 × 0.96) = 34 mm

With a stiffened web and a spacing of transverse stiffeners a ≤ d,
tw ≥ (d/250)(a/d)0.5.
Assuming a spacing of stiffeners a = 2366 mm;
tw = 2366/250 × (2366/2366)0.5 = 10 mm.
We assume tw = 30 mm.

Thickness of flange (tf)
The minimum thickness of the flange required to limit the outstand of the flange is calculated as follows. The approximate flange area required is given by;

Af = Mvu/(hfy) = (29515 × 106)/(2500 × 255) = 46298 mm2
Assuming the width of the flange b = 900 mm
tf = 46298/900 = 51.4 mm.

We, therefore, assume tf = 55 mm

Classification of cross-sections
Referring to Clause 5.5.2 of Eurocode 3, Part 1-1, the function of cross-section classification is to identify the extent to which the resistance and rotation capacity of the cross-section are limited by its local buckling resistance. In our case, we assume a class 1 cross-section classification without reduction of resistance. Thus, to determine the thickness tf of the flange, we do the following.

For class 1 section classification, c/tf ≤ 9ε,

where;
c = outstand of flange plate = [b − (tw + 2 × 12 (weld size))]/2 = [900 − (25 + 24)]/2 = 425.5 mm.
Assuming tf = 55 m,
c/tf = 425.5/55 = 7.7 and 9ε = 9 × 0.96 = 8.64

Since c/tf (7.7) < 9ε (8.64), the section satisfi es the conditions for class 1 section classification.
So we assume tf = 55 mm.

To determine the thickness of the web tw, we do the following;
For class 1 section classification, d/tw ≤ 72ε. Assuming tw = 30 mm,
d/tw = 2366/30 = 78.9 and 72ε = 72 × 0.96 = 69 < d/tw which does not satisfy the condition. We increase the thickness tw to 35 mm.

d/tw = 2366/35 = 67.6 < 72ε (69) which satisfies the condition. So, we assume tw = 35 mm.

Thus the initial sizing of the section is as follows:

  • Depth of girder h = 2500 mm.
  • Breadth of flange b = 900 mm.
  • Depth of straight portion of web d = 2500 − 2 × 55 − 2 × 12 (weld size) = 2366 mm.
  • Thickness of web tw = 35 mm.
  • Thickness of flange tf = 55 mm.
  • Design strength with flange thickness 55 mm = fy = 255 N/mm2
  • Design strength of web with thickness 35 mm = fy = 255 N/mm2

Although the design strength of the web is 275 N/mm2 for 35 mm thickness, the lower value of fy (255 N/mm2) of the flange should be considered in calculations for moments and shears.

buit up steel section

Moment capacity
Total maximum ultimate vertical design moment = Mvu = 29515 kNm
Total maximum design shear = Vu = 6281 kN

The moment capacity should be calculated in the following way.
When the web depth-to-thickness ratio d/tw ≤ 72ε, it should be assumed that the web is not susceptible to buckling, and the moment capacity should be calculated from the equation;

Mrd = fyWpl

provided the shear force VEd (Vvu) ≤ 0.5Vpl,rd (shear capacity),

where
Mrd = moment capacity,
Wpl = plastic section modulus
Vpl,rd = shear capacity.

In our case, d/tw (67.6) < 72ε (69.1).
Thus, the web is not susceptible to buckling.

The ultimate shear force (Vvu) should also be less than half the shear capacity (Vpl,rd) of the section. Referring to equation (6.18) of Eurocode 3, Part 1-1;

Vpl,rd = Av[fy/(3)0.5]/γMo

where
Av = shear area = dtw + (tw + 2r)tf = 2366 × 25 + (25 + 2 × 12) × 50 = 61600 mm2

Referring to Clause 6.1, γMo = partial factor = 1.0, and fy = 335 N/mm2 (because tf > 40 mm).
Therefore plastic shear capacity Vpl,rd = 61600 × [335/(3)0.5]/1.0/103 = 12669 kN
and 0.5Vpl,rd = 12669/2 = 6335 kN > Vvu (6281 kN).

Thus, Vvu (6281 kN) < 0.5Vpl,Rd (6335 kN). So the section satisfies the conditions.

Since the web is not susceptible to buckling, and the lowest shear value in the section is less than half the shear capacity of the section, the moment capacity for this class 1 compact section should be determined by the “flange only” method. In this case, the whole moment will be taken up by the flanges alone and the web takes the shear only.

Therefore moment capacity of section My,Rd = fyAfhs

where;
Af = area of compression flange = b × tf = 900 × 55 = 49500 mm2
hs = depth between centroids of flanges = 2500 − 55 = 2445 mm
fy = 255 N/mm2

Therefore;

My,Rd = 255 × 49500 × 2445/106 = 30862 kNm > MEd (Mvu) (29515 kNm). Satisfactory

Alternatively, referring to Clause 6.2.5, the moment capacity of the section may be expressed by the following equation:

Mpl,Rd = Wplfy/γMo

The plastic modulus is calculated to be 1.71008 x 108 mm3
Mpl,Rd = Wplfy/γMo = [(1.71008 x 108 × 255)/1.00] × 10-6 = 43607 kNm

where Wpl is the plastic modulus of the section. As the section assumed is built-up welded and of high depth, no rolled I section is available of this depth. The plastic modulus for the assumed depth can be calculated. So the above equation can only be used when the assumed section is manufactured industrially by welding.

In addition, the top flange is also subjected to a stress due to the horizontal transverse moment caused by horizontal crane surges. Therefore, the “flange only” method is suitable in our case. The horizontal transverse ultimate moment Mhu is equal to 601 kN m.

This transverse horizontal moment is resisted by a horizontal girder formed by the connection of the 6 mm plate (acting as a web) of the walking platform (Durbar), between the top flange of the main plate girder and the tie beam at the walking-platform level. Distance between centre line of plate girder and the tie beam = hz = 2.5 m

Horizontal moment of resistance = Mz,Rd = fyAfhz
where Af = area of top flange = 900 × 55 = 49500 mm2.

Therefore
Mz,Rd = 255 × 49 500 × 2500/106 = 31556 kNm > Mhu (601 kNm)

Referring to the criterion based on the quantity;

[My,Ed/My,Rd]α + [Mz,Ed/Mz,Rd]β

where α and β are constants, which may conservatively be taken as unity.

This quantity is equal to
[29515/30862] + [601/31556] = 0.95 + 0.02 = 0.97 < 1 Satisfactory


Therefore we adopt the section for the welded-plate girder. For other design checks such as buckling and stiffness design, see Ghosh (2010).

Source:
Ghosh K. M (2010): Practical Design of Steel Structures. Whittles Publishing, UK