8.7 C
New York
Wednesday, September 18, 2024
Home Blog Page 5

Cost of Duplex Construction in Nigeria | 2024

Duplex building

In Nigeria, duplexes are the most preferred choice for private residential building construction. Duplexes normally consist of a ground floor and one suspended reinforced concrete floor with a living room (sitting room/parlour), en-suite bedrooms, dining room, kitchen, lounges, and other spaces as may be desired. Lobbies are used to connect the spaces in a duplex building, and a staircase is used for vertical circulation. Residential buildings with more than one suspended floor should not be described as duplexes.

In most duplex designs, it is very typical for the living room, dining, kitchen, laundry room, and storeroom to be on the ground floor. The living room may be double volume (with no reinforced concrete slab over it), or it can be covered with a reinforced concrete slab to create more spaces upstairs.

The former alternative is usually for aesthetics and gives a sense of a freer atmosphere in the living room. Furthermore, it reduces the cost of construction due to the void over the sitting room, however, this comes at the expense of the loss of potentially useful space on the first floor.

A traditional townhouse duplex design by Structville Integrated Services Limited

The ground floor of most duplexes in Nigeria also houses the ante-room, visitor’s toilet, and the visitor’s bedroom which is usually provided with its own convenience (en-suite with toilet and bathroom). Depending on the desire of the client or homeowner, additional bedrooms and facilities may be provided on the ground floor. While this is usually very applicable to moderate duplexes, luxury duplexes can considerably vary in arrangement.

The first floor of a moderate duplex usually contains the majority of the bedrooms. A private family lounge can be provided on the first floor with a kitchenette that can serve as a coffee room. In modern construction, all the bedrooms should be en-suite.

Luxury duplexes can contain additional spaces such as exclusive wine cellars, study rooms/private offices, gyms, saunas, library rooms, theatres/cinemas, games rooms, bigger walk-in closets, kids’ play area, exclusive pantry rooms, elevator, panic room, mechanical/electrical panel rooms, internet server rooms, indoor swimming pool, etc. Modern luxury apartments should be smart buildings with most of the facilities fully automated.

The cost of constructing a duplex building in Nigeria depends on a number of factors such as;

Size: The size of the building will significantly increase the cost of materials and labour needed to construct the building. The bigger the building, the bigger the cost of execution.

Type of land: Buildings that are founded on soft/weak soils will cost considerably more than buildings that are founded on stiff non-problematic soils. Also, the effects of the depth groundwater table can influence the cost of construction. Duplex buildings on marginal soils can be supported on a raft or pile foundation, while duplexes on good soils can be supported on pad foundations. Buildings on pad foundations are cheaper than buildings supported on a raft or pile foundation.

Read Also…
The Cost and Processes of Constructing a Raft Foundation in Nigeria

Method of Construction: The construction method you choose might have a big impact on the cost of your building project. Before installing the block walls and partitions, contractors can build the structural parts of duplexes as pure reinforced concrete frames consisting of beams, columns, slabs, and staircases.

On the other hand, the partition walls and the structural frames can be constructed simultaneously, an approach that is more common in low- to medium-budget duplex construction projects. The latter has the advantage of being faster while saving a significant amount of money on materials and labor. The former, however, is of higher quality due to more stringent quality control throughout the construction of the structural elements.

Construction of a building as a pure framed structure
Construction of a building as a pure framed structure (Supervised by Engr. O. U. Ubani)

Location of the project: The cost of a project can also be influenced by its location. Sites that are close to sand and gravel supplies will have lower material costs than sites that are further away. Additionally, if the site is not accessible by truck, significant labour expenditures will be incurred in transloading the items into your site before they are used. Labour costs can also be a factor since the average cost of labour varies from location to location.

Taste of the client: While the cost of constructing the frames and carcass of a duplex should be relatively consistent among buildings of similar size and volume, the cost of finishing a duplex might vary significantly because of the wide range of alternatives available to clients. A building’s finishes might be either high-end or low-cost. This can include everything from roofing sheets to doors, windows, tiles, sanitary fittings, electrical fittings, painting, among other things. A homeowner can choose between the cheapest choice and the most expensive luxury option. The price difference can be as much as 500%.

Getting Started in Duplex Construction

Land Acquisition
As should be expected, the first step in the construction of a duplex should be the acquisition of land. In the villages or rural areas, family or communal lands can be conveniently obtained depending on the family agreements. In the towns of Nigeria, landed properties can be purchased from individuals, corporate bodies, or real estate firms.

In all cases, the land to be used for the construction should be properly surveyed by a registered surveyor, and the title of the land clearly defined. The land should be properly registered and all legal documents for ownership properly verified. All laws for property ownership in the state should be fulfilled by the client.

Architectural Design
After you have secured your plot of land for the proposed construction, the design of the building can commence. The architect designs your preferred building while also satisfying the local building regulation codes/requirements, taking into account the nature, size, and shape of your site.

The airspace and setbacks between the property lines and the building line should adhere to the local building code. Septic tanks, soakaway pits, boreholes, gatehouses, generator houses, outdoor swimming pools, and other structures should all be clearly mapped out on the site layout.

Civil Engineering Designs
The geotechnical and structural engineering designs should be carried out for the ultimate safety of the proposed building. Site investigation and sub-surface exploration should be carried out to determine the engineering properties of the sub-surface soils. This information will inform the type of foundation to be used for the duplex. At the initial stage, a cue should be taken from the type of foundation used for supporting the surrounding buildings if any.

A structural design will identify the location and design of the columns, beams, slabs, staircase, and foundation. The structural design should be carried out, checked, and sealed by a COREN-registered civil engineer. A letter of structural stability and supervision should also be issued to you by the structural engineer.

Mechanical and Electrical Designs
The mechanical design should include the building’s plumbing, HVAC, and water sprinkler systems, among other things. The design should be in harmony with the building’s architectural and structural design so that the route of pipes, ducts, and other utilities can be clearly specified during the design stage, to avoid chiselling of structural components after construction.

The arrangement of electrical pipes and light fittings, security cameras, alarm systems, internet and television cables, cable tray routes, the position of distribution boards/panels, and so on should all be included in the electrical designs. COREN-registered mechanical and electrical engineers shall design and stamp the services drawing.

Approval
Having obtained all the necessary drawings, the complete set of drawings comprising the architectural, structural, mechanical, electrical, and soil test report should be submitted to the Physical Planning Board/Agency of the locality for approval. Other documents as may be required should be submitted too. Once the drawings are approved, the construction can commence.

Cost of Constructing a Duplex in Nigeria

For the sake of convenience in costing and project management, duplex construction in Nigeria can be conveniently broken into the following stages;

  • Substructure (foundation)
  • Ground floor to overhead level
  • First-floor decking
  • First floor to roof overhead level
  • Parapet and roofing
  • Finishes

These stages are consistent with projects where the block walls and the frames are to be built up together. For buildings that are to be constructed as pure frame structures, the above breakdown will not be very adequate.

Let us now survey the cost of constructing each phase of a duplex using the four-bedroom duplex building plan below as a case study. The building is to be constructed in a semi-urban region in south-eastern Nigeria, on lateritic soil with a bearing capacity of 175 kN/m2 at a depth of 1 m. Groundwater is at a great depth from the ground surface.

ground floor
Ground floor plan of the proposed duplex
first floor
First floor plan of the proposed duplex

Substructure (Foundation)

The activities usually carried out under substructure works are setting out, excavation, concrete works (blinding, column bases, strip foundation, column stubs, and ground floor slab), reinforcement works, carpentry works, and filling.

Foundation layout of a typical duplex
Foundation layout of the proposed duplex

Setting out
3 bundles of pegs @ ₦2500 = ₦7500
20 pcs of 2″ x 3″ softwood @ ₦750 = ₦15000
1 bag of 3″ and 2″ nails each @ ₦48,000 each = ₦96,000
6 rolls of twin ropes @ ₦500 = ₦3000
Labour and supervision (allow) = ₦100,000
Total for setting out = ₦221,500

Excavation works
Excavation of 82 m3 of earthwork for the column bases and the strip foundation @ ₦1,800/m3 = ₦147,600
Supervision = ₦60,500
Total cost for excavation works = ₦208,100

Substructure works of a duplex by Structville Integrated Services Limited

Concrete Works (foundation)
Blinding and casting of column base and strip foundation = 26.5 m3 of grade 25 concrete @ ₦108,600/m3 = ₦2,877,900
Labour and supervision cost = ₦425,000
Total cost for concrete works = ₦3,302,900

Reinforcement Works
Column base mat reinforcements = 384 kg of Y12 @ ₦1005/kg = ₦385,920
Column starter bars reinforcements = 455 kg of Y16 @ ₦1005/kg = ₦457,275
Column base links = 50 kg of Y8 @ ₦1005/kg = ₦50,250
Binding wire 1 roll @ ₦34,000 = ₦34,000
Labour and supervision cost = ₦100,000
Total cost for reinforcement works = ₦1,027,445

Block work
170 m2 of 9″ hollow block work @ ₦10,150/m2 = ₦1,725,500
Labour and supervision = ₦254,000
Total for block work = ₦1,979,500

Carpentry Works
Column stubs – 13.5 m2 of 1″ x 10″ plank @ ₦3525/m2 = ₦47,590
Slab edge formwork- 50 m length of 1″ x 9″ plank @ ₦780/m = ₦39,000
20 pcs of 2″ x 3″ bracings @ ₦750 = ₦15,000
Labour and supervision costs = ₦40,000
Total cost for carpentry works = ₦141,590

Backfilling and Compaction
150 tonnes of lateritic earth fill @ ₦6000/tonne = ₦900,000
Labour cost (allow) = ₦150,000
Total cost for backfilling and compaction = ₦1,050,000

Backfilling and Compaction of a Duplex Substructure
Backfilling and Compaction of a Duplex Substructure by Structville Integrated Services Limited

BRC Mesh
160 m2 of A142 BRC mesh @ ₦1400/m2 = ₦224,000
Cost of installation = ₦25,000
Total cost of BRC mesh works = ₦249,000

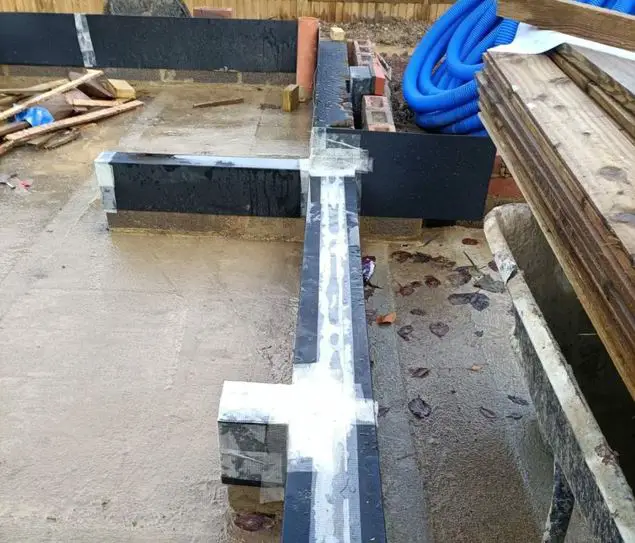
Damp Proof Membrane
Allow ₦75,000 for purchase and installation = ₦75,000

Casting of ground floor slab
Blinding and casting of column base and strip foundation = 22.5 m3 of concrete @ ₦108,600/m3 = ₦2,443,500
Labour and supervision = ₦365,000
Total cost for concreting ground floor slab = ₦2,808,500

Total cost of substructure (foundation to DPC) = ₦11,063,535

Ground Floor to Overhead Level

Block work
212 m2 of 9″ hollow block work @ ₦10,150/m2 = ₦2,151,800
Labour and supervision = ₦304,400
Total cost for block work = ₦2,456,200

Concrete Works (Lintel and Columns)
9m3 of concrete @ ₦108,600/m3 = ₦977,400
Labour and supervision = ₦146,000
Total cost for concrete works = ₦1,123,400

Ground floor to first floor level
Construction of a duplex (ground floor to overhead level) by Structville

Reinforcement Works
Y16 for columns – 512 kg @ ₦1005/kg = ₦514,560
Y12 for lintels – 405 kg @ ₦1005/kg = ₦407,025
Y8 for lintel and column links – 232 kg @ ₦1005/kg = ₦233,160
1 roll of binding wire = ₦34,000
Labour and supervision cost = ₦120,000
Total cost for reinforcement works = ₦1,308,745

Carpentry Works
Column formwork = 31.5 m2 of 1″ x 10″ plank @ ₦3525/m2 = ₦111,040
Lintel formwork (sides) = 46.5 m2 of 1″ x 10″ plank @ ₦3525/m2 = ₦163,915
Lintel formwork (bottom) = 12m2 of sawn 1″ x 9″ plank @ ₦3525/m2 = ₦42,300
Labour and supervision cost = ₦120,000
Total cost of carpentry works = ₦437,255

Total cost from ground floor to overhead level = ₦5,325,600

First Floor Decking

Formwork
1” x 9” x  12’ plank as soffit to slab and staircase = 155 m2 @ ₦3525/m2 = ₦546,375
1” x 9” x  12’ plank as sides to beam = 46.5 m2 of 1″ x 10″ plank @ ₦3525/m2 = ₦163,915
1” x 6” x  12’ plank as sides to beam and riser to staircase = 45 pcs @ ₦1200/pcs = ₦54,000
2” x 3” x 12 softwood = 120 pcs @ ₦750/pcs = ₦90,000
Bamboo props = 275 pcs @ ₦600/pcs = ₦165,000
2 bags of 2″ and 3″ nails each = ₦192,000
Labour and supervision cost = ₦300,000
Total cost of carpentry works = ₦1,511,290

Reinforcement Works
Y16 for beams – 855 kg @ ₦1005/kg = ₦859,275
Y12 for slab – 2425 kg @ ₦1005/kg = ₦2,437,125
Y10 for slab – 295 kg @ ₦1005/kg = ₦296,475
Y8 for links of beams – 190 kg @ ₦1005/kg = ₦190,950
2 rolls of binding wire @ ₦34,000 = ₦68,000
Labour and supervision cost = ₦300,000
Total cost of reinforcement works = ₦4,151,825

reinforcement works of a
Typical reinforcement works on the decking of a Duplex by Structville

Electrical and Mechanical Piping Works
Allow – ₦800,000

Concreting of the slab, beams, and staircase
33m3 of concrete @ ₦108,600/m3 = ₦3,583,800
Labour and supervision cost = ₦512,000
Total cost of concreting = ₦4,095,800

Total cost of first floor decking = ₦10,558,915

First Floor to Roof Overhead Level

Block work
223 m2 of 9″ hollow block work @ ₦10,150/m2 = ₦2,263,500
Labour and supervision = ₦429,100
Total cost for block work = ₦2,692,600

Concrete Works (Lintel and Columns)
9m3 of concrete @ ₦108,600/m3 = ₦977,400
Labour and supervision = ₦157,500
Total cost for concrete works = ₦1,134,900

Reinforcement Works
Y16 for columns – 512 kg @ ₦1005/kg = ₦514,560
Y12 for lintels – 405 kg @ ₦1005/kg = ₦407,025
Y8 for lintel and column links – 232 kg @ ₦1005/kg = ₦233,160
1 roll of binding wire = ₦34,000
Labour and supervision cost = ₦150,000
Total cost for reinforcement works = ₦1,338,745

Carpentry Works
Column formwork = 31.5 m2 of 1″ x 10″ plank @ ₦3525/m2 = ₦111,040
Lintel formwork (sides) = 46.5 m2 of 1″ x 10″ plank @ ₦3525/m2 = ₦169,915
Lintel formwork (bottom) = 12m2 of sawn 1″ x 9″ plank @ ₦3525/m2 = ₦42,300
Labour and supervision cost = ₦150,000
Total cost of carpentry works = ₦473,255

Total Cost from the first floor to roofing level = ₦5,639,500

Cost Summary

Total cost of substructure (foundation to DPC) = ₦11,063,535
Total cost from ground floor to overhead level = ₦5,325,600
Total cost of first floor decking = ₦10,558,915
Total Cost from the first floor to the roofing level = ₦5,639,500
Total cost = ₦32,587,550

Allow 25% for contractor’s profit and overhead = ₦8,146,890

Therefore, the total cost of constructing a 4-bedroom duplex from the foundation to the roofing level should range between ₦32,587,550 to ₦40,734,437. Note that different professionals and contractors may have their own scale of fees or rates for executing every item of work which may vary from what is presented here.

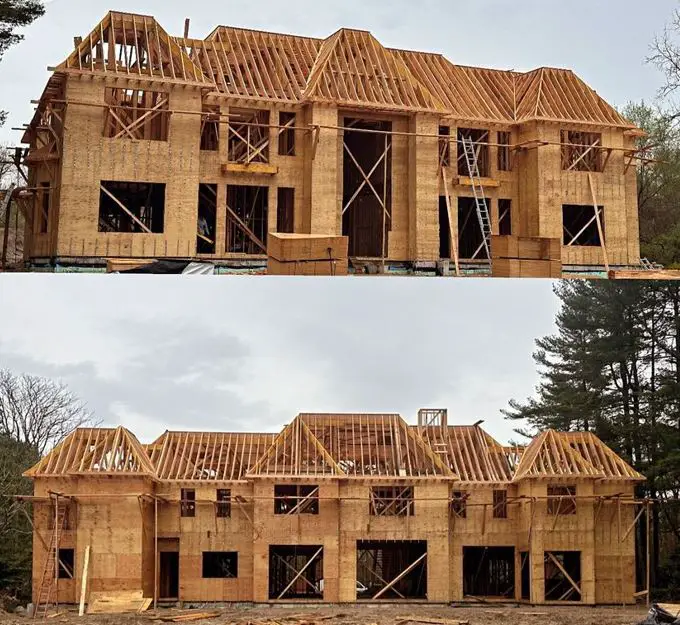
Residential Duplex under Construction by Structville Integrated Services Limited

For your building design and construction services, contact;
Structville Integrated Services Limited
Phone/WhatsApp: +2348060307054, +2347053638996
E-mail: info@structville.com

Analysis of Statically Determinate Frames

Statically determinate frames are usually two-dimensional planar structures whose unknown external reactions or internal member forces can be determined using only the three equations of equilibrium. Statically determinate frames are the basic functional frames of structural engineering, forming the backbone of countless structures from bridges to buildings. Understanding their analysis is fundamental to ensuring the stability and efficiency of most civil engineering structures.

The three equations of equilibrium sufficient for the analysis of statically determinate structures are;

Fx = 0; Fy = 0; Mi = 0

An indeterminate structure is one whose unknown forces cannot be determined by the conditions of static equilibrium alone. Additional considerations, such as compatibility conditions, are necessary for a complete analysis.

Nature of Statically Determinate Frames

As stated earlier, statically determinate frames are usually 2-dimensional structures. Three-dimensional frames are usually statically indeterminate and are more suited to computer-based finite element analysis.

The vertical members in statically determinate frames are referred to as the columns, while the horizontal members are referred to as the beams. Typically, the analysis of statically determinate frames involves the determination of the support reactions, internal stresses (bending moment, shear force, and axial force), and deflections.

Support Reactions

For simplified manual analysis, the support conditions considered in the analysis of frames are;

  • Fixed support (consisting of three reactions)
  • Pinned/hinged support (consisting of two reactions)
  • Roller support (consisting of one reaction)

It therefore follows that when the number of support reactions in a frame exceeds three, special conditions such as internal hinges will be required to make the frame statically determinate. Such frames with internal hinges are usually referred to as compound frames. The degree of static determinacy or indeterminacy can then be calculated as follows;

ID = R – e – s

Where;
ID is the degree of static indeterminacy
e is the number of equilibrium equations (typically 3)
s is the number of special conditions in the structure

Alternatively,

If (3m + R = 3j + s), the structure is statically determinate.

Here:
m represents the number of members.
R represents the number of support reactions.
J represents the number of joints.
s represents the equations of condition (e.g., two equations for an internal roller and one equation for each internal pin).

Rearranging the equation above;

RD = (3m + R) – 3j – S

Where;
m = number of members.
r = number of support reactions.
j = number of nodes
S = number of special conditions

If the degree of static indeterminacy is less than 0, the frame is unstable. A structure is stable if it maintains its geometrical shape when subjected to external forces. Stability is important for ensuring the safety and functionality of a structure.

To obtain the support reactions in a statically determinate frame, it is usually sufficient to take the summation of moments about any of the supports or any point with a known condition (such as an internal hinge) and equate it to zero.

Loads and Actions on Frames

The skeletal framework of structural frames, composed of beams, columns, and trusses, bears the brunt of diverse forces and actions. Understanding and accurately analyzing these loads is paramount for ensuring the safety and functionality of the entire structure.

The types of loading found on frames are;

Point Loads: These concentrated forces act at discrete locations on a member. Columns sitting on a beam or the actions of secondary beams on primary beams are usually idealised as point loads. Their magnitude and position significantly influence the stress distribution within the frame.

point load on a statically determinate frame
Point load on a statically determinate frame

Uniformly Distributed Loads (UDLs): Imagine a blanket of snow uniformly accumulating on a roof. This scenario represents a UDL, where the load acts with constant intensity across the entire length of a member. Self-weight of members is also idealised as uniformly distributed loads. Analyzing such loads involves calculating their total force based on the area they cover and their intensity.

Uniformly distributed load on a statically determinate frame

Varied Distributed Loads: Not all distributed loads are uniform. Consider the wind pressure acting on a tall building, increasing in intensity towards the top due to aerodynamic effects. These loads can be modelled as linear (triangular loads) or non-linear (trapezoidal loads) functions of the member’s length, necessitating more complex analysis techniques like integration or employing equivalent uniform load representations.

Varied distributed load on a statically determinate frame

Concentrated Moments: Imagine a child swinging on a monkey bar; the force applied at the bar’s end creates a concentrated moment, twisting the bar. This can also come from torsion being transmitted from another structural member or machinery. These moments directly influence the bending stresses within the member.

Concentrated moment on a statically determinate frame

Beyond the fundamental loading idealisation, the world of structural loading extends beyond these fundamental categories:

  • Line Loads: Picture the weight of a cable hanging on a support. These act along a linear element, requiring specialized analysis techniques.
  • Hydrostatic and Earth Pressures: Retaining walls holding back water or soil experience continuous pressure from these fluids or packed earth, necessitating specialized analysis based on their specific intensity profiles.
  • Impact Loads: A sudden blow, like a hammer strike, can create dynamic forces requiring specialized analysis to evaluate potential damage and ensure structural integrity.

Analysis of Statically Determinate Frames

The analysis of statically determinate frames involves several key steps. Let’s break it down:

  1. Identify the Frame: Begin by understanding the given frame’s geometry, member lengths, and support conditions. Clearly identify the structure and its supports (hinges, rollers, etc.). Determine the type and location of all applied loads (point loads, distributed loads, moments). Specify the material properties of the frame members (e.g., Young’s modulus, cross-sectional area). Confirm that the frame is statically determinate.
  2. Reaction Forces: Determine the reaction forces at each support using global equilibrium equations (vertical, horizontal, and moment equilibrium). Check for the force and moment equilibrium of the structure.
  3. Cut the Frame: Split the frame into separate members. Consider each member individually. Isolate each member by cutting it at a point of interest. Draw a free-body diagram of the isolated member. Apply the three equations of equilibrium to solve for the internal shear force, bending moment, and axial force (if applicable) at the point of interest. Repeat for other points of interest in each member.
  4. Internal Forces: Calculate the bending moment, shear, and axial force at selected locations of interest (typically member ends, midpoints, and points of maximum moment). These values help us understand the internal forces within the frame.
  5. Check for Deflections (Optional): Use beam deflection formulas or methods like the virtual work method to calculate deflections at specific points in the members. Compare the deflections to allowable limits specified in building codes or design criteria.

Solved Example

For the frame that is loaded as shown in the Figure below, find the support reactions and draw the internal stresses diagram. Internal hinges are located at points G1, G2, and G3 and beam JK cantilevers out at a height of 4m from column CF

image 45

Solution

RD = (3m + r) – 3n – S
m = 10 (ten members)
r = 6 (six reactions)
n = 11(eleven nodes)
S = 3 (three internal hinges)
RD = 3(10) + 6 – 3(11) – 3 = 0

This shows that the structure is statically determinate and stable.

Support reactions
Let ∑MG1L = 0; anticlockwise negative
(Ay × 2) – ((2 × 22)/2) = 0
Ay = 2.0 kN

Let ∑MG3R = 0; clockwise negative
(Dy × 4) – ((2 × 42)/2) = 0
Dy = 4.0 kN

Let ∑MG2L = 0; anticlockwise negative
(Ay × 7) – ((2 × 72)/2) + (By × 3) – (Bx × 6) – (4 × 2) = 0
But Ay = 2.0 kN

Hence, 7By – 6Bx = 43 ———— (a)

Let ∑MC = 0; anticlockwise negative
(Ay × 10) – ((2 × 10²)/2) + ((2 × 72)/2) + (4 × 4) + (By × 6) – (Dy × 7) + (5 × 1.5) – (4 × 7) = 0
But Ay = 2.0 kN, Dy = 4.0 kN

We then substitute the values into the above equation;
Hence By = 10.583 kN

Substituting the value of By into equation (a)
We obtain Bx = -1.1875 kN

Let ∑MB = 0; clockwise negative
(Cy × 6) + ((2 × 42)/2) – ((2 × 132)/2) – (4 × 4) + (Dy × 13) + (7 × 4) – (5 × 7.5) – (Ay × 4) = 0
But Ay = 2.0 kN, Dy = 4.0 kN.

We then substitute the values into the above equation;
Hence Cy = 22.417 kN

Let ∑MG2L = 0;
(Dy × 10) + (Cy × 3) – (Cx × 6) – ((2 × 10²)/2) – (5 × 4.5) – (7 × 2) = 0
But Dy = 4.0 kN, Cy = 22.42 kN
Therefore, Cx = -4.875 kN

image 41

Internal Stresses

Section A – EL (0 ≤ x ≤4.0)
Moment
Mx = Ayx – ((2x2)/2) = 2x x2
At x = 0, MA = 0 (simple hinged support)
At x = 2.0m, MG1 = 2(2) – (2)2 = 0

∂Mx/∂x = Qx = 2 – 2x
When ∂Mx/∂x = 0, M = Maximum at that point
Hence, 2 – 2x = 0
x = 2/2 = 1.0m
Mmax = 2(1) – (1)2 = 1.0 kNm
At x = 4m
MEL = 2(4) – (4)2 = -8 kNm

Shear
∂Mx/∂x = Qx = 2 – 2x
At x = 0
QA = 2 kN
At x = 4m

QEL = 2 – 2(4) = -6 kN

Axial
No axial force in the section

Section B – IB (0 ≤ y ≤ 4.0)
Moment
My = Ax.y = 1.875y
At y = 0, MB = 0 (simple hinged support)
At y = 4m, MIB = 1.875(4) = 7.5 kNm

Shear
∂My/∂y = Qy = 1.875
QB – QIB = 1.875 kN

Axial
Ny + 10.483 kN = 0
NB – N1B = -10.483 kN

Section IUP – EB (4 ≤ y ≤ 6.0)
Mx = Ax.y – 4(y – 4) = 1.875y – 4y + 16
Mx = -2.125y + 16
At x = 4m, MIUP = -2.125(4) + 16 = 7.5 kNm
At x = 6m, MEB = -2.125(6) + 16 = 3.25 kNm

Shear
∂My/∂y = Qy = -2.125
QIUP – QEB = -2.125 kN

Axial
Ny + 10.483 kN = 0
NB – N1B = -10.483 kN

Section ER – G1L (4 ≤ x ≤7.0)
Mx = Ay.x – ((2x2)/2) + By (x – 4) + (1.875 × 6) – (4 × 2)
Mx = 2x – x2 + 10.483(x – 4) + 3.25
Mx = -x2 + 12.483x – 38.682

At x = 4m, MER = -(4)2 + 12.483(4) – 38.682 = -4.75 kNm
At x = 7m, MG1L = -(7)2 + 12.483(7) – 38.682 = 0

∂Mx/∂x = Qx = – 2x + 12.483
When ∂Mx/∂x = 0, M = Maximum at that point
Hence, – 2x + 12.483 = 0
x = 12.483/2 = 6.2415m
Mmax = -(6.2415)2 + 12.483(6.2415) – 38.682 = 0.274 kNm

Shear
∂Mx/∂x = Qx = – 2x + 12.483
At x = 4m, QER = -2(4) + 12.483 = 4.483 kN
At x = 7m, QG1L = -2(7) + 12.483 = -1.517 kN

Axial
Nx – 1.875 + 4 = 0
Nx = -2.125 kN
NER – NG1L = -2.125 kN

Coming from the right-hand side
Section D – FR (0 ≤ x ≤ 7.0)

Moment (clockwise negative)
Mx = Dy.x – ((2x2)/2) = 4x – x2
At x = 0, MA = 0 (simple hinged support)
At x = 4.0m, MG3 = 4(4) – (4)2 = 0
∂Mx/∂x = Qx = 4 – 2x
When ∂Mx/∂x = 0, M = Maximum at that point
Hence, 4 – 2x = 0
x = 4/2 = 2.0m
Mmax = 4(2) – (2)2 = 4.0 kNm
At x = 7m, MEL = 4(7) – (7)2 = -21 kNm

Shear
Since the sign convention changes when we are coming from the right, we reverse the signs.
∂Mx/∂x = Qx = 4 – 2x = -4 + 2x
At x = 0, QD = -4 kN
At x = 7m, QFR = -4 + 2(7) = 10 kN

Axial
No axial force on the section

Section C – JB(0 ≤ y ≤ 4.0)
Moment
My = Cx.y = 4.875y
At y = 0, MC = 0 (simple hinged support)
At y = 4m, MJB = 4.875(4) = 19.5 kNm

Shear
∂My/∂y = Qy= 4.875 = -4.875
QC – QJB = -4.875 kN

Axial
Ny + 22.417 kN = 0
NC – NJB = -22.417 kN

Section K – JR (0 ≤ x ≤1.50)
Moment
Mx = -5x
At x = 0, MK = -5(0) = 0
At x = 1.5m, MJR = -5(1.5) = -7.5 kNm

Shear
∂Mx/∂x = Qx = – 5 = 5
QK – QJR = 5 kN

Axial
Nx = -7 kN (Compression)

Section JUP – FB (4 ≤ y ≤ 6.0)
Moment
My = Cx.y – (5 × 1.5) – 7(y – 4)
My = -2.125y + 20.5
At y = 4m, MJUP = -2.125(4) + 20.5 = 12 kNm
At y = 6m, MFB = -2.125(6) + 20.5 = 7.75 kNm

Shear
∂My/∂y = Qy = -2.125 = 2.125
QJUP – QFB = 2.125 kN

Axial
Nx + 22.417 – 5 = 0
Nx = – 17.417 kN
NJUP – NFB = -17.417 kN

Section FL – G2R (7 ≤ x ≤ 10)
Mx = Dy.x – ((2x2)/2) + Cy (x – 7) + (4.875 × 6) – (7 × 2) – 5(x – 5.5)
Mx = 4x – x2 + 22.417(x – 7) – 5(x – 5.5) + 15.25
Mx = -x2 + 21.417 x – 114.169

At x = 7m, MFL = -(7)2 + 21.417(7) – 114.169 = -13.25 kNm
At x = 10m, MG2R = -(10)2 + 21.417(10) – 114.169 = 0
∂Mx/∂x = Qx = – 2x + 21.417
When ∂Mx/∂x = 0, M = Maximum at that point
Hence, – 2x + 21.417 = 0
x = 21.417/2 = 10.7085m
Hence no point of contraflexure exists in the section.

Shear
∂Mx/∂x = Qx = – 2x + 21.417 = 2x – 21.417
At x = 7m, QFL = 2(7) – 21.417 = -7.417 kN
At x = 10m, QG2R = 2(10) – 21.417 = -1.417 kN

Axial
Nx – 4.875 + 7 = 0
Nx = -2.125 kN
NER – NG1L = -2.125 kN

Bending moment diagram

Bending moment diagram

Shear force diagram

image 43

Axial force diagram

image 44

To download the full calculation sheet, click HERE

Curtain Walls: Uses and Functional Requirements

Architectural envelopes often utilize curtain walls, a type of lightweight, non-loadbearing external cladding which are attached to a framed structure to form a complete exterior sheath. They support only their own weight and wind loads, which are transferred via connectors at floor levels to the main structure.

For precision, BS EN 13830 defines curtain walling as “an external vertical building enclosure predominantly comprised of metallic, wooden, or plastic elements.” In essence, most curtain walls consist of vertical mullions (spanning floor to floor) connected by horizontal transoms. Infill panels, either glass or opaque, fill the resulting openings. Typically, such systems are constructed using proprietary systems provided by specialized metal fabricators.

view of curtain wall
Night view of a building with curtain wall system

Objectives of Curtain Wall Systems

The primary objectives of using curtain-walling systems are to:

  • Enclosure and Environmental Protection: Provide a comprehensive building envelope that protects the structure against external elements like wind, rain, and temperature fluctuations.
  • Efficient Construction: Utilize dry construction methods, potentially streamlining the building process and minimizing disruptions at the site.
  • Structural Optimization: Minimize the additional load placed on the building’s primary structure by the cladding system, enhancing overall structural efficiency.
  • Architectural Expression: Offer a versatile design element to contribute to the building’s overall aesthetic and architectural intent.
highrise building with curtain wall
Curtain walls are popular in highrise buildings due to their low self weight

Functional Requirements of Curtain Walls

The following are the functional requirements of curtain walls.

Weather Resistance

Curtain walls are expected to protect the interior of the building from the weather conditions of the exterior. While the materials of the curtain wall themselves typically offer excellent impermeability, joints within curtain walls present potential vulnerabilities. Careful design and implementation are crucial to ensure weather resistance. Therefore, achieving weather resistance relies on meticulous design and construction. Two approaches exist:

1) Impervious joints: utilizing sealants and gaskets to entirely prevent water entry, mimicking the material’s impermeability.
2) Drained joints: acknowledging potential water ingress but strategically channelling it away through dedicated drainage systems. Both methods require consideration of thermal expansion, structural shifts, and moisture movement, with appropriate materials and skilled installation being crucial for long-term success.

Internal Temperature Control

While large glass areas in curtain walls offer stunning aesthetics, they pose challenges in temperature control. The low heat resistance allows heat transfer and solar radiation to warm internal surfaces, creating uncomfortable heat build-up. Fixed louvres within the system offer limited heat gain reduction, primarily addressing glare. External louvres provide marginal improvement by absorbing and re-radiating heat outwards.

Effective solutions include:

  • Deep recessed windows: Coupled with external vertical fins, these create shading pockets to reduce solar heat gain.
  • Balanced HVAC systems: These actively manage internal temperature through heating and ventilation for year-round comfort.
  • Special solar control glass: Reflective glass with metallic or dielectric coatings deflects solar radiation, reducing heat gain. Tilting the glass further enhances its effectiveness.

Sufficient Structural Strength

While non-loadbearing, curtain walls require sufficient strength to withstand their own weight and varying wind pressures. Wind load intensity depends on three key factors: building height, exposure level, and location.

Curtain wall strength hinges on the rigidity of its vertical mullions and their secure anchorage to the building frame. Glazing beads and compressible materials further enhance resilience against wind damage by allowing panels to move independently within the system, minimizing stress on the overall frame.

curtain wall mullions
Vertical mullions of a curtain wall

Fire Resistance

The high percentage of unprotected areas in curtain walling systems, as defined in Building Regulations (Approved Document B4: Section 12.7), poses a significant fire resistance challenge. To achieve compliance and ensure occupant safety, architects and engineers must carefully select cladding materials or material combinations for opaque infill panels.

These materials should possess inherent fire resistance properties or be treated with fire-retardant coatings to qualify as protected areas as defined in the regulations. For further guidance on external fire spread considerations, refer to Part 7 of the same document.

Assembly and Fixing

The mullion, typically a solid or box section member, forms the backbone of a curtain wall system. It securely connects to the building’s structural frame at floor levels using adjustable anchorages or connectors, ensuring proper load transfer and stability. The infill framing and panels can be delivered as individual components requiring on-site assembly, or as prefabricated units for faster installation. When evaluating different systems, key considerations include:

  • Handling ease: Can the individual components or prefabricated units be safely and efficiently manoeuvred on-site, considering their size and weight?
  • Site assembly: Is extensive field assembly required, potentially impacting construction time and labour costs?
  • Access to fixing points: Can workers readily access and secure the curtain wall to the building structure at all designated anchor points?
assembly and fixing of curtain walls
Assembly and fixing of curtain walls

Sound Insulation

Curtain wall systems, due to their inherent lightweight nature, present challenges in terms of sound insulation. Both structure-borne and airborne sound transmission must be addressed to ensure a comfortable and acoustically controlled indoor environment.

  • Structure-borne sound: Primarily originating from machinery vibrations, this type of sound can be mitigated by isolating offending equipment with resilient pads or incorporating resilient connectors within the mullion connections. Careful equipment selection and placement can further contribute to reducing vibrations at their source.
  • Airborne sound: Lightweight cladding offers minimal inherent sound barrier, making glazed areas particularly vulnerable to sound transmission. Strategies to reduce airborne sound transmission include:
    • Minimizing glazing area: Utilizing less glazing or opting for smaller window sections can significantly reduce sound ingress.
    • Sealed windows with thicker glass: Implementing sealed windows with thicker glass panels increases the mass barrier, thereby enhancing soundproofing capabilities.
    • Double-glazing: Installing double-glazed windows with an air gap of 150-200mm between the panes creates a significant barrier for sound waves, offering superior sound insulation performance.
curtain wall panel
Typical curtain wall panel

Thermal and Structural Movements

Curtain wall systems, positioned on a building’s exterior, face heightened exposure to temperature fluctuations compared to the internal structure. This translates to significant thermal movement within the curtain wall itself, as well as potential differential settlement between the main frame and attached cladding. To accommodate these independent movements, careful design, fabrication, and fixing are crucial.

Key considerations:

  • Slotted bolt connections: These connections offer flexibility at attachment points between the curtain wall and the building frame, allowing for controlled thermal expansion and contraction without compromising structural integrity.
  • Spigot connections: Within the curtain wall system, spigot connections join components while permitting controlled movement. This flexibility mitigates stresses caused by thermal expansion and contraction within the system itself.
  • Mastic-sealed joints: These flexible sealant joints further accommodate movement by allowing slight shifts between individual curtain wall components while maintaining weather resistance.

Infill Panels for Curtain Wall Systems

Curtain wall infill panels, responsible for opaque areas, require specific characteristics to ensure optimal performance and longevity. These include:

  • Lightweight construction: Minimizes overall system weight, reducing structural loads and facilitating handling.
  • Rigidity: Ensures dimensional stability and resistance to deflection under wind loads and thermal stresses.
  • Impermeability: Prevents water ingress and maintains weathertightness of the building envelope.
  • Adequate fire resistance: Complies with relevant building regulations to ensure occupant safety in case of fire.
  • Thermal insulation: Minimizes heat transfer and contributes to energy efficiency.
  • Low maintenance: Requires minimal upkeep for sustained performance and aesthetic appeal.

Panel Construction and Vapour Control:

No single material possesses all these attributes, necessitating the use of composite or sandwich panels. However, such panels pose a risk of interstitial condensation, which can be mitigated by incorporating a vapour control layer near the inner panel surface. This layer, with a vapour resistance exceeding 200 MN/g, can be formed using various materials:

  • Adequately lapped sheeting: Aluminium foil, waterproof building papers, or polyethylene sheet
  • Applied materials: Two coats of bitumen or chlorinated rubber paint

Careful placement is crucial to avoid detrimental interactions between adjacent materials, such as alkali attack on aluminium when in contact with concrete or fibre cement.

External Facing Materials:

Direct exposure to the elements necessitates careful selection of external-facing materials. Plastics and plastic-coated options are viable choices if they comply with fire regulations outlined in relevant documents. One popular choice is vitreous enamelled steel or aluminium sheets (0.7-0.8mm thickness).

This process fuses a thin glass coating onto the metal surface at high temperatures, resulting in:

  • High hardness and impermeability: Resisting damage from acids, corrosion, and abrasion.
  • Crack and craze resistance: Maintaining an attractive finish with lasting strength.

Alternatively, aluminium sheeting with a silicone polyester coating can be employed. By combining these facings with insulating materials like EPS, rockwool, polyurethane, or polyisocyanurate, lightweight infill panels achieving U-values below 0.35 W/m²K can be produced.

Furthermore, both internal and external surfaces must meet fire performance requirements outlined in building regulations, often tested according to specific standards. The insulating core must also exhibit non-combustible properties. Panel dimensions can reach up to 3000mm x 1000mm.

curtain wall construction

Glazing for Curtain Wall Systems

One critical aspect of curtain walls is glazing—the use of glass in large, uninterrupted areas to create consistent and attractive facades. While protecting the building interior from the elements remains the principal objective of facade materials, the function of glazing transcends mere weather tightness. It plays a pivotal role in orchestrating two key aspects of the built environment:

1. Daylight-Driven Illumination:

Glazing serves as a conduit for natural light, not only fulfilling the basic requirement of illuminating interior spaces but also contributing demonstrably to occupant well-being and energy conservation efforts. However, solely relying on daylight to sufficiently illuminate specific tasks necessitates meticulous consideration of several factors. Window size, placement, and calculated daylight factors all come into play in ensuring adequate and appropriate natural light distribution for dedicated work areas.

2. Fostering Visual Connection with the Exterior:

Beyond illumination, glazing fulfils a psychological need by establishing a visual connection with the surrounding environment. This connection has been demonstrably linked to enhanced occupant well-being, underlining the importance of thoughtful planning when incorporating glazed areas. Size, orientation, and the quality of the view obtained through these areas are crucial aspects to consider during the design phase.

As discussed earlier in this article, other critical considerations pertaining to glazing selection include managing solar heat gain, glare control, thermal insulation performance, and acoustic properties. Therefore, these aspects shall not be revisited here.

Cleaning and Maintenance of Curtain Walls

The use of expansive glazing in high-rise structures, particularly in curtain walling systems, presents a significant challenge: safe and cost-effective access for cleaning and maintenance. While manual cleaning with tools like swabs, chamois leathers, and squeegees remains the standard method, access becomes paramount. Neglected cleaning causes the following problems on curtain wall glazings:

  • Aesthetic Integrity: Accumulation of dirt distorts the intended visual appearance.
  • Daylight Transmission: Optimal natural light penetration requires clean surfaces.
  • Visual Clarity: Unobstructed views are essential for occupants and aesthetics.
  • Material Integrity: Glazing materials are susceptible to deterioration from dirt and chemical attack.

For low- to medium-rise structures, access solutions like trestles, stepladders, and straight ladders (up to 11 meters) suffice. However, taller buildings necessitate alternative approaches:

  • Tower Scaffolds: While offering access, their assembly and disassembly time and cost make them impractical for frequent cleaning.
  • Lightweight Scaffolds: Quick-install systems can be considered for moderate heights (up to 6 meters) due to their efficiency.

High-rise curtain wall cleaning predominantly relies on suspended cradles. These come in two forms:

  • Temporary Cradles: These offer flexibility but must be dismantled and reassembled each time.
  • Permanent Systems: Integrated into the building structure, they offer readily available access but carry higher upfront costs.

The simplest permanent solution involves installing a universal beam section at roof level, extending 450 mm beyond the facade and encircling the building. A conventional cradle with castors on its lower flange runs along this beam, controlled by ropes lowered to ground level for access.

While challenges exist, a range of options ensures the cleanliness and integrity of high-rise glazed facades, contributing to both aesthetics and occupant well-being.

Shear Transfer at the Interface of Reinforced Concrete Members

The efficacy of shear transfer at concrete-to-concrete interfaces is very paramount to the structural integrity of numerous reinforced concrete constructions. This is very important due to the need for shear stress transfer within reinforced concrete structures especially at horizontal construction joints. These joints become necessary due to the impracticality of single-pour of concrete in most construction works or the inherent requirements of staged construction sequences.

A prime illustration of this lies in the horizontal plane of interaction between precast concrete girders and cast-in-place concrete bridge decks. The composite behaviour exhibited by the girder and deck, which ultimately dictates the bridge’s stiffness and strength, is contingent upon the interface’s capacity to effectively transmit shear forces. In essence, the transfer of shear forces from the deck to the girders plays a crucial role in determining the structure’s load-carrying capacity.

Mechanism of Shear Transfer

The mechanisms governing shear stress transfer can be broadly categorized into three main contributors:

1. Interlock between roughened surfaces (shear – friction): Intentional surface irregularities, often achieved through sandblasting or texturing, create mechanical interlock between the concrete layers. This interlock resists relative movement under shear, contributing to stress transfer.

2. Dowel action of reinforcement: Steel bars embedded in the concrete, particularly shear connectors like headed studs, act as dowels traversing the interface. When subjected to shear, these dowels experience tension and compression, contributing to interface resistance.

3. Adhesion: The inherent bond between the concrete layers, influenced by factors like material properties, curing conditions, and surface cleanliness, also plays a role in shear transfer.

The critical mechanism of shear transfer across concrete-to-concrete interfaces in reinforced concrete (RC) structures can be elucidated through the saw-tooth model (Figure 1). This model visualizes the interaction between concrete surfaces under shear force.

image 36
Figure 1: Interface Shear Transfer, saw-tooth model

When subjected to shear, a horizontal displacement (h) occurs between the concrete layers. This relative movement triggers a vertical displacement (v) due to interlock between the roughened surfaces. This vertical displacement, in turn, induces tension in the reinforcement crossing the interface. The generated tension translates into a clamping force, enhancing frictional resistance along the interface. Additionally, cohesion, representing the intrinsic bonding force between the concrete surfaces, contributes to shear resistance.

The contribution of each mechanism varies with the applied load. At low loads, cohesion predominates, effectively resisting the shear force. However, as the load increases, cracks develop within the interface, compromising the cohesive bond. Consequently, the burden of shear resistance shifts to a combination of shear-friction and dowel action.

Shear-friction originates from the interaction between the clamping force and the frictional resistance along the interface. Essentially, the clamping force, generated by the tensioned reinforcement, presses the concrete surfaces together, creating friction that opposes the relative movement.

Dowel action stems from the direct shear resistance offered by the steel bars traversing the interface. These bars experience tension and compression under shear, contributing to the overall interface resistance.

Steel bars (stirrups) are used for shear transfer

In essence, the shear transfer mechanism in RC interfaces operates as a dynamic interplay between cohesion, shear-friction, and dowel action. Understanding the individual contributions and their interplay under varying load conditions is crucial for ensuring the structural integrity and performance of RC structures.

Factors Affecting Shear Transfer Capacity

The magnitude of shear transfer capacity is not a static value but depends on several factors, including:

  • Interface characteristics: Surface roughness, presence of contaminants, and potential shrinkage gaps all influence the effectiveness of mechanical interlock and adhesion.
  • Concrete properties: Strength, age, and moisture content of the concrete layers affect their bond characteristics and susceptibility to cracking.
  • Reinforcement details: Type, spacing, and embedment depth of dowel bars significantly impact their contribution to shear transfer.
  • Loading conditions: Sustained or cyclic loading, along with the magnitude and distribution of shear forces, influence the interface’s response.

Shear Transfer According to the Eurocodes

Section 6.2.5 of Eurocode 2 (EC2) defines the methodology for evaluating the shear capacity of interfaces between concretes cast at different times. This approach considers the combined contributions of cohesion and friction to interface resistance.

The shear stress at the interface is calculated by the difference of the longitudinal internal force ΔF (tension or compression) in the examined part of the cross-section separated by the interface. The part of the longitudinal force (compressive or tensile) that is located within the new concrete is expressed by the coefficient β.

Following a stress-based approach, the equation provided within the code expresses the shear stress capacity (VRd,i) as a function of;

vRdi = cfctd + μσn + ρfyd ⋅ (μ⋅sinα + cosα) ≤ vRdi,max

where;
fctd is the design tensile strength of concrete;
σn is the stress per unit area caused by the minimum external normal force across the interface that can act simultaneously with the shear force, positive for compression, such that σn ≤ 0.6fcd;
fyd is the design yield strength of reinforcement, not more than 600 MPa;
ρ is the reinforcement ratio (As/Ac);
α is the angle between concrete interface and interface reinforcement;
c and μ are factors that depend on the roughness of the interface; values are listed in Table 2.

Conditioncμ
Very smooth interface roughness condition; A surface cast against steel, plastic or specially prepared wooden molds.0.0250.5
Smooth interface roughness condition; A slip-formed or extruded surface, or a free surface left without further treatment after vibration.0.20.6
Rough interface condition; A surface with at least 3 mm roughness at about 40 mm spacing, achieved by ranking, exposing of aggregate or other methods giving an equivalent behavior0.40.7
Indented interface condition; A surface with indentations complying with more than 3 mm roughness and also depth of groove should be more than 5 mm and the width of the groove should be more than 10 times its depth0.50.9

vRdi,max = 0.5 ⋅ ν ⋅ fcd

Where ν is the strength reduction factor for shear design in accordance with EN1992-1-1 §6.2.2(6).
ν = 0.6 ⋅ (1 – fck / 250 MPa)
fcd is the design compressive strength of the concrete
fck is the characteristic compressive strength of the concrete after 28 days

SHEAR CONNECTION REINFORCEMENT
Figure 3: Shear interface between concrete cast at different times

Design Example

Design the shear transfer between a girder of 600 mm width to a slab topping of 250 mm thickness. The shear force at the section is 655 kN and the interface between the old and new concrete is rough. Take the lever arm for the internal forces of composite section z = 0.9m. fck = 30 MPa, fyk = 500 MPa.

Solution

Applied shear stress at the interface

By assuming a constant lever arm of internal forces z in the examined infinitesimal segment dx then the corresponding difference of longitudinal force ΔF is:

ΔF = β(M + dM) / z – βM/z = βdM/z

Where dM is the infinitesimal change of the bending moment. In the calculation above the variation of the normal force N is not considered significant. The shear stress at the interface v is calculated by dividing the difference of longitudinal force ΔF by the width of the interface bi and the assumed infinitesimal length dx. According to fundamental mechanics, the shear force is calculated as the derivative of the bending moment V = dM / dx.

The aforementioned analysis leads to the design value of the shear stress at the interface vEdi as given by EN1992-1-1 §6.2.5(1) equation (6.24):

vEdi = βVEd / (zbi) = (1.0 × 655 × 103) / (900 × 600) = 1.213 MPa

Shear strength of the interface

c = 0.400 and μ = 0.700 (for rough surfaces)

The coefficient for concrete cohesion c should be reduced for the case of fatigue or dynamic loads. In general according to EN1992-1-1 §6.2.5(5) under fatigue or dynamic loads, the values for c should be halved. Specifically for bridges, according to EN1992-2 §6.2.5(105) under fatigue and dynamic loads a value of 0.0 should be considered for c. Moreover when the normal stress σn is tensile (i.e. negative) then a value of 0.0 should be considered for c in accordance with EN1992-1-1 §6.2.5(1).

For the examined case the adjustment factor applied to the value of c is 0.40. The adjusted value of the coefficient is c = 0.40 × 0.400 = 0.160.

Maximum shear strength that can be transferred at the interface

The maximum value of the design shear resistance vRdi,max of the interface is limited by the compressive strength of the concrete struts as specified in EN1992-1-1 §6.2.5(1):

vRdi,max = 0.5νfcd
ν = 0.6 ⋅ (1 – fck / 250 MPa) = 0.6 × (1 – 30.00 MPa / 250 MPa) = 0.528
fcd = αcc ⋅ fck / γC = (1.00 × 30.00) / 1.50 = 20.00 MPa

Therefore the maximum value of the design shear resistance vRdi,max is calculated as:
vRdi,max = 0.5νfcd = (0.5 × 0.528 × 20.00 MPa) = 5.280 MPa

For the examined case the applied shear stress on the interface vEdi = 1.213 MPa does not exceed the maximum shear stress capacity of concrete vRdi,max = 5.280 MPa. The corresponding utilization factor is u = 0.23 ≤ 1.0 ⇒ ok.

Calculation of required shear connection reinforcement

The calculation of the required shear connection reinforcement ratio ρ can be performed by solving EN1992-1-1 equation (6.25) for ρ. The equation that defines the design shear resistance of the interface is:

vRdi = cfctd + μσn + ρfyd ⋅ (μ⋅sinα + cosα) ≤ vRdi,max

The values of the trigonometric functions when the shear connection reinforcement forms angle α = 90.0 ° with the interface plane are sinα = 1.0 and cosα = 0. The value of the design tensile strength of concrete fctd is calculated as specified in EN1992-1-1 §3.1.6(2)P:

fctd = αct ⋅ fctk,0.05 / γC = (1.00 × 2.03 MPa) / 1.50 = 1.35 MPa

where fctk,0.05 = 0.7 × fctm = 0.7 × 2.90 MPa = 2.03 MPa is the 5% fractile of the tensile strength of concrete as specified in EN1992-1-1 Table 3.1.

The value of the design yield strength of reinforcement steel fyd is calculated as specified in EN1992-1-1 §3.2:

fyd = fyk / γS = 500/1.15 = 434.8 MPa

The required shear connection reinforcement is calculated when vEdi = vRdi. Provided that vRdi ≤ vRdi,max the aforementioned equation can be solved for the required ratio ρ of the shear connection reinforcement:
σn = 0

ρ = (vEdi – c ⋅ fctd – μ ⋅ σn) / [fyd ⋅ (μ⋅sinα + cosα) ]
(vEdi – c ⋅ fctd – μ ⋅ σn) = 1.213 – (0.16 × 1.35) – 0 = 0.997
[fyd ⋅ (μ⋅sinα + cosα) ] = 434.8 × (0.7 × 1.0 + 0) = 304.36
ρ = 0.997/304.36 = 0.003275

The corresponding required shear connection reinforcement per m length of the interface area is:
Width of area = 600 mm
Length of area (per metre run) = 1000 mm

As = ρ × 1000 mm × 600 mm = 1965 mm2/m

Therefore provide 4legs of H12 @200 mm c/c spacing (Asprov = 2260 mm2/m)

Conclusion

In conclusion, shear transfer in the interface of RC members serves as a critical mechanism for structural integrity. Recognizing the contributing factors, their interactions, and the limitations of current design approaches is essential for ensuring the safety and reliability of such structures. Ongoing research efforts aimed at refining analytical models and leveraging advanced experimental techniques hold promise for advancing our understanding and design capabilities, ultimately leading to safer and more efficient RC structures

Design of Cantilever Steel Carport | Monopitch Canopy Roof Design

Cantilever steel carports have become increasingly popular due to their clean aesthetics, simplicity, minimal space requirements, and ability to span large distances without obstructing parking space. However, the unique structural demands of this design system necessitate careful consideration during the design process. The design of cantilever steel carports is consistent with the design of an open monopitch canopy roof according to EN 1991-1-4.

The design of steel carports involves the selection of adequate steel columns and beams that will be able to withstand the dead, live, and environmental loads that the structure will be subjected to without undergoing excessive deflection, vibration, or failure.

Construction of steel carport

This article discusses the structural design for cantilever steel carports, exploring key principles, considerations, and design approaches.

Structural System of Cantilever Carports

Cantilever steel beams are structural systems that project outwards like outstretched arms. Technically, most steel carport frame structures fall under monopitch canopy roof systems for their wind load analysis and design. This structural system offers elegance, efficiency, and expansive coverage, finding diverse applications in bridges, balconies, and yes, even carports. But beneath their deceptively simple appearance lies a complex interplay of forces, internal stresses, and deformations.

Cantilever beams project outward from support columns without additional support at the free end. This creates a significant bending moment force at the fixed end, necessitating robust column and foundation design.

Bending Moment

Imagine a cantilever beam of a carport structure bearing a load at its free end. The beam tries to resist this bending, leading to the development of internal stresses. The top fibres experience tension, stretching as the beam deflects downwards. Conversely, the bottom fibres are compressed, pushing inwards. This stress distribution is not uniform but varies parabolically across the beam’s depth, with the maximum values occurring at the top and bottom surfaces.

Shear force

While bending usually governs overall behaviour of carport frames, shear forces also play a critical role. Imagine slicing the beam at any section. The internal forces acting across this imaginary cut represent the shear force, responsible for balancing the applied load. This force varies along the beam length, reaching a maximum value at the support and decreasing towards the free end. Understanding shear distribution is critical for selecting appropriate beam sections and preventing shear failure.

Deflection

As the beam of a carport frame bends, the free end undergoes deflection, a measure of its vertical displacement. While deflection is inevitable, excessive movement can be detrimental. Factors like beam length, material properties, load magnitude, and support conditions all influence deflection. Engineers utilize engineering mechanics principles and advanced beam theory to calculate deflections and ensure they stay within acceptable limits.

Buckling

While bending and shear are often the primary concerns, slender beams face an additional problem – buckling. Imagine pushing a long, thin ruler sideways; it bends easily. Likewise, slender beams under compression can buckle, losing their load-carrying capacity abruptly. Engineers carefully assess the risk of buckling based on beam geometry, material properties, and loading conditions, employing design techniques like increasing section depth or adding lateral supports to mitigate the risk.

Connection Details

The design doesn’t end with the beam and column structures of the carport. The connections between the structural elements play a vital role in overall behaviour. Welded, bolted, or a combination of connections transfer internal forces between the beam and the support. Improperly designed or executed connections can lead to premature failure, highlighting the importance of careful design, fabrication, and quality control during construction.

steel carport structure
Typical steel carport structure

Load Analysis

Several loads and load combinations must be accounted for in the design of carports and they typically include:

Dead Loads: Weight of the steel structure, roof covering, and any attachments such as solar panels, electrical/mechanical services, and insulations (though rarely included).

Live Loads: Human access due to erection or maintenance, snow accumulation, and wind pressures. Wind pressure appears to be the most critical load in the design of carport structural systems.

Seismic Loads: Relevant in seismically active regions.

Load Path and Equilibrium: The design ensures a clear and efficient load path from the roof to the columns, foundation, and ultimately the soil. Counterbalancing is often required to achieve equilibrium, achieved through structural elements or anchor design.

Structural Analysis

For complex structural configurations or demanding loading scenarios, advanced analysis techniques like Finite Element Analysis (FEA) become invaluable. FEA software creates a digital model of the structure, discretizing it into smaller elements and applying loads. By solving complex mathematical equations, the software calculates stresses, deflections, and buckling potential at various points within the beam, providing valuable insights beyond analytical solutions.

Structural Design of Carport Structures

Each structural member in the carport frame is individually designed to resist the anticipated loads. This involves:

Beam Design: Selecting appropriate beam sections (e.g., universal beam sections) and checking for bending stress, shear stress, and deflection within allowable limits as per design codes.

Column Design: Designing columns to resist axial loads, bending moments, and potential buckling. Steel column design tables or specific software tools can be employed.

Connection Design: Designing connections between members to ensure adequate strength and stiffness. Welded, bolted, or a combination of connections are used, following code-specified design procedures.

Member Design Example

It is desired to design a monopitch canopy steel carport structure with the details provided below;

image 12
Structural model of a carport structure

Structure data
Height of column = 2.5m
Length of beam = 3.027m
Spacing of frame members = 3.0 m c/c
Spacing of purlins = 0.605m
Angle of inclination of roof = 7.59 degrees

Dead Load
Unit weight of sheeting material = 0.02 kN/m2
Self-weight of members (calculated automatically)
Services (assume) = 0.1 kN/m2

Live Load
Imposed live load = 0.6 kN/m2

Wind Load Analysis of carport Monopitch Canopy Structures

Wind speed = 40 m/s
Basic wind velocity (Exp. 4.1); v = cdir × cseason × vb,0 × cprob = 40.8 m/s
Degree of blockage under the canopy roof: φ = 0
Reference mean velocity pressure; qb = 0.5 × ρ × vb2 = 1.020 kN/m2
Reference height (at which q is sought); z = 2900 mm
Displacement height (sheltering effects excluded); hdis = 0 mm
Aref = bd / cos(α) = 9.000 m ⋅ 3.000 m / 0.991 = 27.239 m2

image 14
Pressure zones for monopitch canopy roofs, reproduced from EN1991-1-4 Table 7.6 and Figure 7.16

Mean wind velocity
The mean wind velocity vm(ze) at reference height ze depends on the terrain roughness, terrain orography and the basic wind velocity vb. It is determined using EN1991-1-4 equation (4.3):

vm(ze) = cr(ze) ⋅ c0(ze) ⋅ vb = 0.7715 × 1.000 × 40.00 m/s = 30.86 m/s

Wind turbulence
The turbulence intensity Iv(ze) at reference height ze is defined as the standard deviation of the turbulence divided by the mean wind velocity. It is calculated in accordance with EN1991-1-4 equation 4.7. For the examined case ze ≥ zmin.

Iv(ze) = kI / [ c0(ze) ⋅ ln(max{zezmin} / z0) ] = 1.000 / [ 1.000 ⋅ ln(max{2.900 m, 2.0 m} / 0.050 m) ] = 0.2463

Basic velocity pressure
The basic velocity pressure qb is the pressure corresponding to the wind momentum determined at the basic wind velocity vb. The basic velocity pressure is calculated according to the fundamental relation specified in EN1991-14 §4.5(1):

qb = (1/2) ⋅ ρ ⋅ vb2 = (1/2) ⋅ 1.25 kg/m3 ⋅ (40.00 m/s)2 = 1000 N/m2 = 1.000 kN/m2

where ρ is the density of the air in accordance with EN1991-1-4 §4.5(1). In this calculation the following value is considered: ρ = 1.25 kg/m3. Note that by definition 1 N = 1 kg⋅m/s2.

Peak velocity pressure
The peak velocity pressure qp(ze) at reference height ze includes mean and short-term velocity fluctuations. It is determined according to EN1991-1-4 equation 4.8:

qp(ze) = (1 + 7⋅Iv(ze)) ⋅ (1/2) ⋅ ρ ⋅ vm(ze)2 = (1 + 7⋅0.2463) ⋅ (1/2) ⋅ 1.25 kg/m3 ⋅ (30.86 m/s)2 = 1621 N/m2
⇒ qp(ze) = 1.621 kN/m2

Calculation of local wind pressure on the canopy roof

Net pressure coefficients
The net pressure coefficients cp,net represent the maximum local pressure for all wind directions and they should be used in the design of local elements such as roofing elements and fixings. Net pressure coefficients are given for three zones A, B, C as defined in the figure included in EN1991-1-4 Table 7.6 that is reproduced above. Zones B, C extend at the sides of the canopy and Zone A at the central region:

The inclined length of the monopitch canopy roof parallel to the wind direction is:
d’ = d / cos(α) = 3.000 m / 0.991 = 3.027 m

Zone C corresponds to the regions parallel to the windward and leeward edges having width d’/10 = 0.303 m. Zone B corresponds to the regions parallel to the side edges having width b/10 = 0.900 m, where b is the width of the canopy transverse to the wind direction. Zone A corresponds to the remaining central region.

The net pressure coefficient cp,net for each of the zones A, B, C are defined in EN1991-1-4 Table 7.6 as a function of the roof angle α and the blockage factor φ. For the examined case: α = 7.59 ° and φ = 0.000. Therefore according to EN1991-1-4 Table 7.6 the following net pressure coefficients and overall force coefficient are obtained, using linear interpolation where appropriate:

For zone A: cp,net,A = -1.307 or +1.007
For zone B: cp,net,B = -1.855 or +2.255
For zone C: cp,net,C = -1.955 or +1.455

Negative values for the external pressure coefficient correspond to suction directed away from the upper surface inducing uplift forces on the roof. Both positive and negative values should be considered for each zone.

Net wind pressure on pressure zones

The net wind pressure on the surfaces of the structure wnet corresponds to the combined effects of external wind pressure and internal wind pressure. For structural surfaces consisting of only one skin the net pressure effect is determined as:

wnet = cp,net ⋅ qp(ze)

For structural surfaces consisting of more than one skin EN1991-1-4 §7.2.10 is applicable. For the different pressure zones on the canopy roof the following net pressures are obtained:

– For zone A: wnet,A = -2.119 kN/m2 or +1.633 kN/m2
(zones A is the remaining central region located more than d’/10 = 0.303 m or b/10 = 0.900 m from the edges)

– For zone B: wnet,B = -3.008 kN/m2 or +3.657 kN/m2
(zone B extends up to b/10 = 0.900 m from the side edges)

– For zone C: wnet,C = -3.170 kN/m2 or +2.360 kN/m2
(zone C extends up to d’/10 = 0.303 m from the windward and leeward edges)

Negative net pressure values correspond to suction directed away from the external surface inducing uplift forces on the canopy roof. Both positive and negative values should be considered.

Calculation of overall wind force on the canopy roof

Overall pressure coefficient
The overall pressure coefficient cf represents the overall wind force and it should be used in the design of the overall load bearing structure. The overall pressure coefficient cf is defined in EN1991-1-4 Table 7.6 as a function of the roof angle α and the blockage factor φ. For the examined case: α = 7.59 ° and φ = 0.000. Therefore according to EN1991-1-4 Table 7.6 the following overall pressure coefficient is obtained, using linear interpolation where appropriate:

cf = -0.804 or 0.452

Negative values for the overall pressure coefficient correspond to suction directed away from the upper surface inducing uplift forces on the roof. Both positive and negative values should be considered.

Structural factor
The structural factor cscd takes into account the structure size effects from the non-simultaneous occurrence of peak wind pressures on the surface and the dynamic effects of structural vibrations due to turbulence. The structural factor cscd is determined in accordance with EN1991-1-4 Section 6. A value of cscd = 1.0 is generally conservative for small structures not-susceptible to wind turbulence effects such as buildings with heights less than 15 m.

In the following calculations, the structural factor is considered as cscd = 1.000.

Overall wind force (for total roof surface)

The wind force Fw corresponding to the overall wind effect on the canopy roof is calculated in accordance with EN1991-1-4 equation 5.3:
Fw = cscd ⋅ cf ⋅ Aref ⋅ qp(ze)

where Aref = 27.239 m2 is the reference wind area of the canopy roof as calculated above.

For the examined case:
– Maximum overall wind force (acting downwards):
Fw = 1.000 ⋅ (+0.452) ⋅ 27.239 m2 ⋅ 1.621 kN/m2 = +19.95 kN

– Minimum overall wind force (acting upwards):
Fw = 1.000 ⋅ (-0.804) ⋅ 27.239 m2 ⋅ 1.621 kN/m2 = -35.49 kN

Negative values correspond to suction directed away from the external surface inducing uplift forces on the canopy roof. Both positive and negative values should be considered, as explained below.

Direction and eccentricity of the overall wind force
According to EN1991-1-4 §7.3(6) and the National Annex the location of the centre of pressure is defined at an eccentricity e from the windward edge. In this calculation, the centre of pressure is considered at an eccentricity e = 0.250⋅d’ = 0.757 m, where d’ = 3.027 m is the inclined length of the canopy roof parallel to the wind direction. Two cases should be examined for the overall effect of the wind force on the canopy roof:

  • Maximum force Fw = +19.95 kN (i.e. acting downwards) located at a distance e = 0.757 m from the windward edge.
  • Minimum force Fw = -35.49 kN (i.e. acting upwards) located at a distance e = 0.757 m from the windward edge.

Structural Analysis and Results

Finite Element Analysis (FEA) software (Staad Pro) was used to model the structure and evaluate stresses, deflections, and buckling potential under various load combinations.

Structural Modelling and Loading

Some of the images from the structural model are shown below.

image 22
3D render of the carport model
image 23
Finite element model of the carport structure/canopy roof
image 25
Gravity load on the carport structure
image 24
Negative wind load (suction) on the canopy roof

Support Reactions

The support reactions from the various load combinations are shown below.

image 26
Support Reactions (1.35gk + 1.5wk) – Suction
image 27
image 28
Support Reactions (1.35gk + 1.5wk) – Gravity

The summary of the maximum and minimum support reactions under various load combinations are shown in the Table below.

image 29

Bending Moment and shear force diagrams

The typical bending moment and shear force diagrams from the various load combinations are shown below.

image 31
Typical bending moment diagram under gravity load
image 33
Typical bending moment diagram under wind suction
image 34
Typical shear force diagram under gravity load

Design of the Cantilever Beams

The summary of the maximum stresses occurring on the beams is shown below. An abridged design calculations are presented afterwards.

image 15

Section type; UB 254x146x37 (BS4-1)
Steel grade – EN 10025-2:2004;  S275
Nominal thickness of element; tnom = max(tf, tw) = 10.9 mm
Nominal yield strength; fy = 275 N/mm2
Nominal ultimate tensile strength; fu = 410 N/mm2
Modulus of elasticity; E = 210000 N/mm2

image 19

The section is Class 1

Check shear
Height of web; hw = h – 2tf = 234.2 mm; h = 1.000
hw / tw = 37.2 = 40.2ε/ h < 72ε / h
Shear buckling resistance can be ignored

Design shear force; Vy,Ed = 32.8 kN
Shear area – cl 6.2.6(3); Av = max(A – 2btf + (tw + 2r)tf, hhwtw) = 1759 mm2
Design shear resistance – cl 6.2.6(2); Vc,y,Rd = Vpl,y,Rd = Av × (fy / √(3)) / γM0 = 279.3 kN
Vy,Ed / Vc,y,Rd = 0.118

Check bending moment
Design bending moment; My,Ed = 61.7 kNm
Design bending resistance moment – eq 6.13; Mc,y,Rd = Mpl,y,Rd = Wpl.y fy / γM0 = 132.9 kNm
My,Ed / Mc,y,Rd = 0.464

Slenderness ratio for lateral torsional buckling
Correction factor – For cantilever beams; kc = 1
C1 = 1 / kc2 = 1
Poissons ratio; n = 0.3
Shear modulus; G = E / [2(1 + n)] = 80769 N/mm2
Unrestrained effective length;  L = 1.0Lz_s1 = 3000 mm

Elastic critical buckling moment; Mcr = C1π2EIz / L2 × √(Iw / Iz + L2GIt / (π2EIz)) = 205.5 kNm
Slenderness ratio for lateral torsional buckling;  λLT = √(Wpl.yfy / Mcr) = 0.804
Limiting slenderness ratio; λLT,0 = 0.4

λLT > λLT,0 – Lateral torsional buckling cannot be ignored

Check buckling resistance
Buckling curve – Table 6.5; b
Imperfection factor – Table 6.3; αLT = 0.34
Correction factor for rolled sections; β = 0.75
LTB reduction determination factor; φLT = 0.5[1 + αLTLT – λLT,0) + βλLT2] = 0.811
LTB reduction factor – eq 6.57; cLT = min(1 / [φLT + √(φLT2 – βλLT2)], 1, 1 /λLT2) = 0.815
Modification factor; f = min(1 – 0.5(1 – kc) × [1 – 2(λLT – 0.8)2], 1) = 1.000
Modified LTB reduction factor – eq 6.58; cLT,mod = min(cLT /f, 1, 1 / λLT2) = 0.815
Design buckling resistance moment – eq 6.55; Mb,y,Rd = cLT,modWpl.yfy / γM1 = 108.3 kNm
My,Ed / Mb,y,Rd = 0.57

Check for Deflection

The following deflection values were obtained for the structure;

Unfactored dead load = 5.423 mm
Unfactored live load = 9.507 mm
Positive wind load (downwards) = 38.4 mm
Negative wind load (upwards) = 40.827 mm

With this information, an appropriate deflection limit can be adopted for the structure.

Design of the columns

The summary of the maximum stresses occurring on the columns is shown below. An abridged design calculations are presented afterwards.

image 20
image 21

Combined bending and axial compression (cl. 6.3.3)
Characteristic resistance to normal force; NRk = Afy = 1150 kN
Characteristic moment resistance – Major axis; My,Rk = (Wpl.yfy) = 132.2 kNm
Characteristic moment resistance – Minor axis; Mz,Rk = Wpl.z fy = 16.5 kNm
Moment factor – Major axis; Cmy = 0.9
Moment factor – Minor axis;  Cmz = 0.9
Moment distribution factor for LTB; ψLT = My,Ed2 / My,Ed1 = 0.842
Moment factor for LTB; CmLT = max(0.4, 0.6 + 0.4 ´ yLT) = 0.937

Interaction factor kyy;                                                       
kyy = Cmy [1 + min(0.8, λy – 0.2) NEd / (χyNRk / γM1)] = 0.901

Interaction factor kzy;                                                       
kzy = 1 – min(0.1, 0.1λz)NEd / ((CmLT – 0.25)(χzNRkM1)) = 0.985

Interaction factor kzz;                                                       
kzz = Cmz [1 + min(1.4, 2λz – 0.6)NEd / (czNRk / γM1)] = 1.029

Interaction factor kyz;                                                       
kyz =  0.6kzz = 0.617

Section utilisation;                       
URB_1 = NEd / (χyNRk / γM1) + kyyMy,Ed / (cLTMy,Rk / γM1) + kyzMz,Ed / (Mz,Rk / γM1)
URB_1 = 0.690

URB_2 = NEd / (χzNRk / γM1) + kzyMy,Ed / (cLTMy,Rk / γM1) + kzzMz,Ed / (Mz,Rk / γM1)
URB_2 = 0.810

Design of the Foundation

Understanding soil properties is critical for foundation design. Geotechnical investigations determine soil-bearing capacity and potential for settlement. The design of the foundation should pay good attention to uplift, sliding and overturning moment from the wind load.

Depending on soil conditions and design loads, foundations can be:

Spread Footings: Individual concrete pads for each column.
Continuous Footings: A continuous concrete strip supporting multiple columns.
Mat Foundation: A concrete slab supporting the entire structure.

Anchor Design: Anchors embedded in the foundation resist uplift forces generated by wind and seismic loads. Anchor selection and embedment depth are critical for structural stability.

Fabrication and Construction Considerations

  • Shop Drawings and Fabrication: Detailed shop drawings ensure accurate fabrication of steel components. Quality control during fabrication is paramount.
  • Erection and Field Welding: Proper erection procedures and qualified welders are necessary to ensure structural integrity and safety.
  • Inspection and Quality Control: On-site inspections at various stages of construction verify adherence to design specifications and ensure construction quality.

Conclusion

Cantilever steel carports offer an aesthetically pleasing and practical solution for vehicle protection. However, due to their inherent structural challenges, their design requires meticulous attention to detail. A clear understanding of the load paths, material properties, design codes, and analysis methods is essential for a safe and reliable structure. Consulting with qualified structural engineers throughout the design and construction process is crucial to ensure a successful and long-lasting cantilever steel carport.

Wind Load Analysis of Signboards and Billboards

Signboards, with their captivating visuals and strategic placements, are very popular elements for advertisement in our towns, streets, and highways. However, the structural stability of signboards hinges on their ability to withstand the dynamic forces of wind. This requires a detailed wind load analysis from the design engineer.

Billboard advertising, despite facing competition from digital alternatives, remains a significant player in the marketing landscape. To understand its economic impact, global billboard advertising spending reached $36.8 billion in 2022, with predictions of a steady rise to $44.2 billion by 2027. The United States accounts for the largest share (around 40%), followed by China and Europe.

image 17
Signboard/Billboard structure

Wind Loads on Signboards

Wind force is the most critical action on billboards. Their cantilevered design, supported by a single column, exposes them to wind-induced stresses. Failure due to wind and hurricanes has been reported, necessitating rigorous analysis and design. Other effects, such as imperfections and the p-delta phenomenon, also impact structural performance under wind load. Wind exerts pressure on objects, generating a force proportional to the wind speed squared. This force, known as wind load, varies with factors like:

  • Location: Geographic location determines wind speeds within established design wind speed maps.
  • Terrain: Topography influences wind turbulence and local wind speeds.
  • Exposure category: Building codes categorize zones based on surrounding obstructions, impacting wind pressures.
  • Signboard geometry: Size, shape, and orientation of the signboard directly influence the wind load experienced.

Methods and Tools for Wind Load Analysis

Several methods are employed for wind load analysis of signboards:

  • Simplified methods: Building codes often provide simplified equations based on specific geometries and exposure categories. However, these methods may not always be suitable for complex designs.
  • Wind tunnel testing: Physical scale models of the signboard are subjected to simulated wind conditions in a wind tunnel, providing accurate pressure data. This method is expensive but precise, especially for unique designs.
  • Computational Fluid Dynamics (CFD) simulations: Numerical simulations model wind flow around the signboard using specialized software. This is a cost-effective alternative to wind tunnel testing, offering valuable insights into complex geometries.

Dynamic Considerations

While static wind loads are vital, signboards may experience dynamic effects like flutter and vortex shedding, resulting in vibrations and potential fatigue failure. Advanced analysis methods or wind tunnel testing may be necessary to assess these dynamic effects, especially for tall and slender signboards.

Wind Load Analysis Example

Let us carry out a wind load analysis on an 8m high signboard in a city centre where the basic wind speed is 35 m/s. The calculated effective wind pressure weff, total wind force FW, and total wind overturning moment MW correspond to the total wind action effects and they are appropriate for global verifications of the element according to the force coefficient method.

For local verifications, appropriate wind pressure on local surfaces must be estimated according to the relevant external pressure coefficients, as specified in EN1991-1-4 §5.2. The calculated wind action effects are characteristic values (unfactored). Appropriate load factors should be applied to the relevant design situation. For ULS verifications the partial load factor γQ = 1.50 is applicable for variable actions.

Input Data

  • Terrain category: = II
  • Basic wind velocity: vb = 35 m/s
  • Width of the signboard wind-loaded area: b = 10 m
  • Height of the signboard wind-loaded area: h = 3 m
  • Separation height of the signboard wind-loaded area from the ground: zg = 5 m
  • Orography factor at reference height zec0(ze) = 1
  • Structural factor: cscd = 1
  • Air density: ρ = 1.25 kg/m3
  • Additional rules defined in the National Annex for the calculation of peak velocity pressure qp(ze): = None
  • The horizontal eccentricity of the centre of pressure from the centre of the signboard as a fraction of the width be/b = 0.25

Calculation of peak velocity pressure

Reference area and height

The reference height for the wind action ze is located at the centre of the signboard, as specified in EN1991-1-4 §7.4.3(3). The reference area for the wind action Aref is the wind-loaded area of the signboard, as specified in EN1991-1-4 §7.4.3(3). Therefore:

ze = zg + h / 2 = 5.000 m + 3.000 m / 2 = 6.500 m
Aref = b ⋅ h = 10.000 m ⋅ 3.000 m = 30.00 m2

Notation for wind load on signboards
Notation for wind load on signboards 

Basic wind velocity

The basic wind velocity vb is defined in EN1991-1-4 §4.2(2)P as a function of the wind direction and time of year at 10 m above ground of terrain category II. The value of vb includes the effects of the directional factor cdir and the seasonal factor cseason and it is provided in the National Annex. In the following calculations, the basic wind velocity is considered as vb = 35.00 m/s.

Terrain roughness

The roughness length z0 and the minimum height zmin are specified in EN1991-1-4 Table 4.1 as a function of the terrain category. For terrain category II the corresponding values are z0 = 0.050 m and zmin = 2.0 m. The terrain factor kr depending on the roughness length z0 = 0.050 m is calculated in accordance with EN1991-1-4 equation (4.5):

kr = 0.19 ⋅ (z0 / z0,II)0.07 = 0.19 ⋅ (0.050 m / 0.050 m)0.07 = 0.1900

The roughness factor cr(ze) at the reference height ze accounts for the variability of the mean wind velocity at the site. It is calculated in accordance with EN1991-1-4 equation 4.4. For the examined case ze ≥ zmin:

cr(ze) = kr ⋅ ln(max{zezmin} / z0) = 0.1900 ⋅ ln(max{6.500 m, 2.0 m} / 0.050 m) = 0.9248

Orography factor

Where orography (e.g. hills, cliffs etc.) is significant its effect on the wind velocities should be taken into account using an orography factor c0(ze) different than 1.0, as specified in EN1994-1-1 §4.3.3. The recommended procedure in EN1994-1-1 §4.3.3 for the calculation of the orography factor c0(ze) is described in EN1994-1-1 §A.3.

In the following calculations, the orography factor is considered as c0(ze) = 1.000.

Mean wind velocity

The mean wind velocity vm(ze) at reference height ze depends on the terrain roughness, terrain orography and the basic wind velocity vb. It is determined using EN1991-1-4 equation (4.3):

vm(ze) = cr(ze) ⋅ c0(ze) ⋅ vb = 0.9248 ⋅ 1.000 ⋅ 35.00 m/s = 32.37 m/s

Wind turbulence

The turbulence intensity Iv(ze) at reference height ze is defined as the standard deviation of the turbulence divided by the mean wind velocity. It is calculated in accordance with EN1991-1-4 equation 4.7. For the examined case ze ≥ zmin.

Iv(ze) = kI / [ c0(ze) ⋅ ln(max{zezmin} / z0) ] = 1.000 / [ 1.000 ⋅ ln(max{6.500 m, 2.0 m} / 0.050 m) ] = 0.2054

Basic velocity pressure

The basic velocity pressure qb is the pressure corresponding to the wind momentum determined at the basic wind velocity vb. The basic velocity pressure is calculated according to the fundamental relation specified in EN1991-14 §4.5(1):

qb = (1/2) ⋅ ρ ⋅ vb2 = (1/2) ⋅ 1.25 kg/m3 ⋅ (35.00 m/s)2 = 766 N/m2 = 0.766 kN/m2

where ρ is the density of the air in accordance with EN1991-1-4 §4.5(1). In this calculation the following value is considered: ρ = 1.25 kg/m3. Note that by definition 1 N = 1 kg⋅m/s2.

Peak velocity pressure

The peak velocity pressure qp(ze) at reference height ze includes mean and short-term velocity fluctuations. It is determined according to EN1991-1-4 equation 4.8:

qp(ze) = (1 + 7⋅Iv(ze)) ⋅ (1/2) ⋅ ρ ⋅ vm(ze)2 = (1 + 7⋅0.2054) ⋅ (1/2) ⋅ 1.25 kg/m3 ⋅ (32.37 m/s)2 = 1597 N/m2
⇒ qp(ze) = 1.597 kN/m2

Note that by definition 1 N = 1 kg⋅m/s2.

Calculation of wind forces on the structure

Structural factor

The structural factor cscd is determined in accordance with EN1991-1-4 Section 6. A value of cscd = 1.0 is generally conservative for small structures not susceptible to wind turbulence effects. In the following calculations, the structural factor is considered as cscd = 1.000.

Force coefficient

The force coefficient cf is given in EN1991-1-4 Sections 7 and 8 depending on the type of structure or structural element. According to EN1991-1-4 §7.4.3, for signboards with zg ≥ h / 4 or b / h ≤ 1, the force coefficient is cf = 1.800.

Total wind force

The wind force on the structure Fw for the overall wind effect is estimated according to the force coefficient method as specified in EN1991-1-4 §5.3.

Fw = cscd ⋅ cf ⋅ qp(ze) ⋅ Aref = 1.000 ⋅ 1.800 ⋅ 1.597 kN/m2 ⋅ 30.00 m2 = 86.216 kN

The total wind force Fw takes into account the overall wind effect. The corresponding effective wind pressure weff on the reference wind area Aref is equal to:

weff = Fw / Aref = 86.216 kN / 30.00 m2 = 2.874 kN/m2

This effective pressure weff = 2.874 kN/m2 is appropriate for global verifications of the structure according to the force coefficient method. It is not appropriate for local verifications of structural elements. For the latter case appropriate wind pressure on local surfaces must be estimated according to the relevant pressure coefficients, as specified in EN1991-1-4 §5.2.

Overturning moment

According to EN1991-1-4 §7.4.3 the resultant force normal to the signboard should be taken to act at the height of the center of the signboard. The total overturning moment Mw acting at the base of the structure is equal to:

Mw = Fw ⋅ (zg + h / 2) = 86.216 kN ⋅ (5.000 m + 3.000 m / 2) = 560.40 kNm

The overturning moment corresponds to the wind action total effect, i.e. it is the total overturning moment for all the base supports.

Horizontal eccentricity

According to EN1991-1-4 §7.4.3 and the National Annex, the resultant force normal to the signboard should be taken to act with a horizontal eccentricity e. In this calculation, the following normalized eccentricity is considered e/b = ±0.250, where b is the width of the signboard wind-loaded area. The total torsional moment Tw acting at the base of the structure is equal to:

Tw = ±0.250 ⋅ b ⋅ Fw = ±0.250 ⋅ 10.000 m ⋅ 86.216 kN = 215.54 kNm

The torsional moment corresponds to the wind action total effect, i.e. it is the total torsional moment for all the base supports.

Conclusion

Wind load analysis is a crucial step in ensuring the safety and durability of signboards. By understanding wind forces, employing appropriate analysis methods, and considering structural design principles, engineers can guarantee structurally sound signboards that stand the test of time.

Surface Erosion on Embankments and Slopes

Soil erosion, defined as the detachment and transport of soil particles by water, wind, or other external forces, presents a significant challenge to agricultural productivity, livability, transportation, and environmental health. Surface erosion of cropland diminishes its potential yield, while the eroded sediments degrade the quality of downstream waterways such as streams, lakes, and reservoirs. Similarly, on roadside embankments, erosion creates rills and gullies, exacerbating surface runoff and eventually leading to slope instability and failure.

surface erosion 2
Surface erosion on an embankment

The United States Department of Agriculture (USDA) developed the Universal Soil Loss Equation (USLE) in response to this pressing issue. This widely adopted model predicts the average annual rate of sheet and rill erosion on agricultural land, taking into account key factors such as rainfall patterns, soil characteristics, topographical features, crop selection, and agricultural practices. Mathematically expressed as:

A = R × K × (LS) × C × P

where:
A = average annual soil loss; it is conventionally expressed in tons/ac/yr,
R = rainfall and runoff factor; it depends on the rainfall intensity and duration,
K = soil erodibility factor; it represents a soil’s ability to resist erosion and is determined by the soil texture, soil structure, organic matter content, and soil permeability,
L = slope length,
S = steepness factor,
C = cover and management factor; it is the ratio of soil loss in an area with specified cover and management to the corresponding soil loss in a clean-tilled and continuously fallow condition. For bare ground, C = 1.0,
P = support practice factor; it is the ratio of soil loss with a support practice such as contouring, strip-cropping, or implementing terraces compared to up-and-down-the-slope cultivation. For construction sites such as roadside embankment, P is not used in the equation.

In the year 1996, the United States Department of Agriculture (USDA) recognized the limitations of the earlier Universal Soil Loss Equation (USLE) and introduced its refinement, the Revised Universal Soil Loss Equation (RUSLE). While retaining the fundamental structure and factors of the USLE, the RUSLE incorporated significant advancements in the technology used to evaluate each factor and introduced new data sources for improved accuracy.

Key improvements in the RUSLE include:

  • Enhanced Rainfall-Runoff Erosivity Factor (R): An expanded database for R provided a more comprehensive representation of rainfall patterns across diverse regions.
  • Time-Varying Soil Erodibility Factor (K): Revised K values incorporate the impact of freeze-thaw cycles and soil consolidation for a more dynamic representation of soil susceptibility to erosion.
  • Refined Topographic Factor (LS): The LS factor was adjusted to explicitly reflect the ratio of rill to interrill erosion, offering a more precise estimation of topographical influence.
  • Continuous Cover-Management Factor (C): Replacing the seasonal approach, C became a continuous function calculated by multiplying four subfactors, accounting for the time-evolving impact of crop cover and residue on erosion control.
  • Expanded Support Practices Factor (P): The scope of P was broadened to encompass conditions specific to rangelands, contouring, strip-cropping, and terracing, enabling a more nuanced assessment of management practices in mitigating erosion.

Surface Erosion Control Measures

There are several methods of controlling surface erosion and some of them are the use of ripraps, vegetative cover, composting, and geosynthetics. These methods are discussed in the sections below.

Riprap

The United States Federal Highway Administration (1989) defines riprap as “a flexible lining or facing for channels or banks, consisting of a well-graded mixture of rock, broken concrete, or other suitable material, typically placed by dumping or handwork, to provide erosion protection.” It finds widespread application in protecting and stabilizing embankments, side slopes of waterways (rivers, channels, lakes, etc.), dams, and drainage elements (slope and storm drains).

riprap
Rock riprap

Riprap revetments encompass a variety of options, including:

  • Rock Riprap: The most common surface erosion protection method for river and channel banks. Angular, well-graded stones interlock, forming a robust unit that resists erosion due to their weight and combined mass. However, rounded rock on steeper slopes (>2:1) can be unstable, requiring alternative materials like geosynthetic matting.
  • Wire-Enclosed Rock: Offers enhanced stability compared to standard rock riprap, particularly on steeper slopes.
  • Grouted Rock: Grouting binds the stones together, creating a monolithic structure with superior erosion resistance but reduced flexibility.
  • Precast Concrete Block Revetments: Offer efficient placement and consistent quality but may not blend aesthetically with the environment.
  • Paved Lining: Provides superior erosion protection but can be costly and alter aquatic habitat.

Designing rock riprap effectively requires careful consideration of various factors, including:

  • Rock size
  • Rock gradation
  • Riprap layer thickness
  • Filter design
  • Material quality
  • Edge treatment
  • Construction considerations

Several government agencies offer guidelines for riprap design. Some key design criteria for ripraps are;

  • Gradation: Utilize a well-graded mixture of rock sizes for optimal interlocking and stability. Avoid uniform-sized stones.
  • Stone Quality: Select durable riprap material resistant to freeze-thaw cycles. Most igneous rocks like granite exhibit suitable durability.
  • Riprap Depth: Ensure the riprap layer is at least twice the thickness of the largest stone diameter used.
  • Filter Material: Implement a filter material, typically a synthetic fabric or gravel layer, beneath the riprap to prevent underlying soil erosion.
  • Riprap Limits: Extend riprap to the maximum expected flow depth or a point suitable for vegetation-based erosion control.
  • Curved Flow Channels: In curved sections, extend riprap five times the channel bottom width upstream and downstream of the curve’s beginning and end, covering the entire curve.
  • Riprap Size: Select rock size based on the anticipated shear stress from water flow. Sizes typically range from 5 cm to 60 cm in diameter.

By adhering to these recommendations, designers can ensure the effectiveness and longevity of rock riprap installations for various erosion control applications.

Compost

The strategic application of compost, a stable amendment produced by microbial decomposition of organic matter, offers valuable material for mitigating erosion in susceptible areas and accelerating vegetation establishment. Composting not only diverts waste from landfills but also transforms it into useful resources with economic and environmental benefits.

A range of compost types has been successfully employed for surface erosion control on embankments and natural slopes:

  • Green material compost: Derived from yard trimmings, clippings, and agricultural byproducts.
  • Manure compost: Sourced from dairy or poultry manure.
  • Co-compost: Blends biosolids with green materials.
  • Wood chip and forestry residual composts: Utilize wood-based waste materials.
  • Food scraps and municipal solid waste composts: Offer additional possibilities, though requiring careful assessment.

Due to varying sources and manufacturing processes, compost characteristics can differ significantly in terms of:

  • pH
  • Soluble salts
  • Moisture content
  • Organic matter content
  • Maturity
  • Stability
  • Particle size
  • Pathogen and physical contaminant presence

Selecting suitable compost for engineering applications necessitates considering specifications set by organizations like the USDA and the USCC. Their “Test Methods for the Examination of Composting and Compost” guide ensures the quality and suitability of the final product. By carefully selecting and applying compost, land management professionals can harness its potential to protect soil, promote vegetation growth, and contribute to sustainable infrastructure solutions.

Vegetation

The utilization of vegetative cover is a prominent method of mitigating soil erosion. Its primary functionalities encompass the protection of the soil surface from the impact of raindrops, the provision of a barrier against the erosive effects of overland flow, and the reduction of the erosive potential of flowing water through attenuation of its velocity. The complex root systems of vegetation contribute to the stabilization of the soil, thereby enhancing its resistance to erosion, fostering infiltration rates, and minimizing runoff.

vegetation can be used for erosion control
Vegetation can be used for erosion control

Key attributes associated with vegetative cover include its cost-effectiveness, ease of establishment, and aesthetic value. While frequently employed in conjunction with alternative erosion control techniques (such as compost blankets, geosynthetic covers, and mulches), the design and implementation of vegetative cover necessitate the consideration of several critical factors:

  • Soil Characteristics: These encompass attributes such as acidity, moisture retention capacity, drainage, texture, organic matter content, and fertility.
  • Site Conditions: Factors like slope gradient and the existing extent of vegetative cover play a pivotal role.
  • Climate: Considerations related to temperature, wind patterns, and precipitation levels are essential.
  • Species Selection: The selection of appropriate plant species is contingent upon regional climate, planting season, water requirements, soil preparation, weed management, anticipated post-construction land use, and projected maintenance levels (including irrigation and associated costs).
  • Establishment Methods: Techniques employed for the successful establishment and growth of vegetation.
  • Maintenance Procedures: Practices implemented to ensure the ongoing health and effectiveness of the vegetative cover.

Erosion Control Using Geosynthetics

The utilization of geosynthetics has witnessed a significant rise in popularity in erosion and sediment control, as well as slope stabilization. This proliferation has been fueled by the development of a diverse array of methods and the ongoing emergence of innovative approaches, including degradable rolled erosion control products (RECPs), nondegradable RECPs, and hard armouring techniques.

geosynthetics in erosion control
Geosynthetics in surface erosion control

Degradable RECPs offer the potential for enhancing the establishment of vegetation on rehabilitated lakeshores, riverbanks, and newly constructed roadways. Their application is particularly suited to scenarios where vegetation alone is anticipated to provide sufficient long-term protection once the RECP has degraded.

Conversely, nondegradable RECPs offer long-term reinforcement to vegetation, making them ideal for more demanding erosion control scenarios requiring immediate and high-performance protection. These materials achieve their function by permanently reinforcing the vegetative root structure, thereby enhancing the erosion resistance of soil, rock, and other underlying materials.
It is noteworthy that geosynthetic erosion control measures often fulfil multiple functions concurrently. These functionalities encompass surface runoff collection and drainage, filtration, separation, reinforcement, and the facilitation of vegetation establishment and maintenance.

Conclusion

Surface erosion, the detachment and transportation of soil particles by wind or water, poses a significant environmental and economic challenge. Unsustainable land management practices, deforestation, and intense precipitation events exacerbate this natural process, leading to topsoil loss, decreased fertility, and downstream sedimentation.

Fortunately, various control measures can be implemented to minimize erosion’s impact. Rock riprap can be used on slopes and embankments to control surface erosion. Vegetation cover, a cost-effective and aesthetically pleasing approach, protects the soil from raindrop impact and overland flow. Additionally, geosynthetics offer reinforcement and enhanced vegetation establishment, particularly in critical areas. By employing strategies tailored to specific landscapes and climatic conditions, we can effectively mitigate surface erosion and safeguard our valuable soil resources.

Establishing Datum and Taking Levels on Site

Establishing an accurate and reliable datum and subsequently taking precise levels on site are fundamental aspects of various construction and surveying projects. A datum acts as a fixed reference point from which all vertical measurements on a site are determined.

Establishing a clear and stable datum ensures consistency and accuracy throughout the project lifecycle, from excavation and foundation laying to building construction and finishing works. Precise levelling involves measuring the elevation of points relative to the established datum, allowing for accurate setting out of structures, drainage systems, and other critical elements. This article outlines the key principles and procedures involved in establishing datum and taking levels on construction sites.

image 9

Establishment of a Datum

For accuracy in construction, it is essential that all levels in a building are taken from a fixed point called a datum. This point must be established at the onset of the construction work, during the setting out operation. Where feasible, the datum should be related to an ordnance benchmark. This symbol resembles an arrow with a horizontal mark above the arrow as shown in Figure 1.

image 7
Common types of benchmark.

The centreline of the horizontal is the precise elevation denoted on an Ordnance Survey map. Ordnance benchmarks are typically located incised or embedded within the sides of walls and buildings. Where there are no benchmarks on or near the site, an appropriate reference point must be designated. A project datum or interim control point could be a concrete monument or a permanent concrete base established on the project site.

Therefore, several methods can be employed to establish a datum, depending on the project requirements and local regulations. Common approaches include:

  • Transferring from Ordnance Benchmarks (OBMs): Utilizing existing, fixed reference points established by national survey agencies.
  • Direct Connection to a Stable Structure: Referencing a permanent and stable structure on site, such as a building foundation or an established control point.
  • Arbitrary Datum: Setting a convenient point on site as the reference, clearly documented and protected throughout the project. Sometimes, the connecting roadway to the site is conveniently taken as the reference point.

The datum on a site, representing the reference height, can be arbitrarily assigned an elevation of 0.00 meters, regardless of its physical location with respect to ground level. This offers flexibility in assigning positive elevations to subsequent levels throughout the building. For example, if the datum is set at 0.00 m, the top of the ground floor level could be designated as +0.6 m (meaning that the ground floor level is 600 mm above the datum), followed by the first floor at +3.6 m, and so on, as the structure progresses upwards.

Conversely, any feature located below ground will have a negative elevation relative to the datum, indicated by a preceding minus sign (e.g., -1.2 m for the depth of foundation). However, it is possible to arrange the levels such that a positive value is maintained throughout the project.

It is important to note that these elevations typically refer to finished floor levels (FFL), signifying the final height of the floor surface. However, other points of interest can be designated using this system as well, such as finished structural levels (FSL).

The key considerations in the selection and adoption of a datum on site are;

  • Stability: The chosen datum point must be stable and unlikely to be disturbed by construction activities.
  • Accessibility: The point should be readily accessible for repeated measurements and transfer of levels.
  • Clarity: The datum definition and location must be clearly communicated and documented for all stakeholders.

Taking Levels

Levelling is a fundamental surveying technique employed to ascertain the height differential between two points. This process serves two primary purposes:

  1. Elevation determination: Precisely establishing the elevation of a point relative to a fixed reference plane known as a datum.
  2. Target elevation achievement: Positioning a point at a predetermined elevation with reference to the same datum.

Precise levelling involves measuring the elevation of points relative to the established datum, allowing for accurate setting out of structures, drainage systems, and other critical elements.

The primary instruments used for levelling operations are an engineer’s level (dumpy level) and a levelling staff. The engineer’s level is essentially a telescope equipped with cross-hairs for precise alignment, mounted on a tripod with a horizontal axis plate. The levelling staff, typically constructed with extendable or folding sections, typically measures 4 meters long. “E” pattern graduations, marked at 10 mm intervals, are commonly used, although some staffs may feature 5 mm graduations. To ensure accuracy, readings are estimated to the nearest millimetre.

levelling instrument
Tripod stand, dumpy level, and levelling staff
image 8
Levelling ’scope, ranging rod and ‘E’ pattern staff

Levelling procedures begin by setting up the instrument on stable ground and taking a sight to a designated benchmark. Next, staff stations are established at predetermined intervals, often following a 10-meter grid pattern. The engineer then takes instrument readings for each staff station. By combining these differential readings with calculations based on the site plan area, the volume of material required for excavation or cut-and-fill operations to level the site can be accurately determined.

image 10
image 11
Rise and fall method:
Staff reading at A = 3.2 m
Staff reading at B = 0.95 m
Ground level at A = 100 m above ordnance datum (AOD)
Level at B = 100 m + rise (− fall if declining)
Level at B = 100 m + (3.200 − 0.950) = 102.250 m.

Alternative height of collimation (HC) method:
HC at A = Reduced level (RL) + staff reading
= 100 m + 3.200 = 103.200 (AOD)
Level at B = HC at A − staff reading at B
= 103.200 − 0.950 = 102.250 m

Conclusion

Establishing a reliable datum and taking precise levels are essential aspects of ensuring project quality and accuracy. By following best practices and adhering to professional standards, surveyors and construction professionals can ensure consistent and dependable results throughout the project lifecycle.

Setting Out of Buildings: Approaches and Best Practices

In the construction of buildings, setting out is the critical first step on the path to successful construction. This process involves translating architectural plans onto the designated building site, and carefully identifying the exact locations and dimensions of foundations, walls, and other structural elements. This article discusses the process of setting out, exploring its methods, tools, and significance in building construction.

Upon gaining access to the designated building site, the contractor shall possess both the site layout plan and detailed drawings outlining the construction of the intended structure(s). Under prevalent building contract models, the onus of ensuring accurate setting out falls squarely upon the contractor. With site possession secured, preparatory measures and the critical process of setting out the building can commence. These activities can be broadly categorized into three distinct phases:

1. Site Clearance: The initial stage necessitates the removal of vegetation, debris, and any obstructive elements from the designated building area. This comprehensive clearing process ensures a level and stable platform, fostering accurate measurements and subsequent construction activities.

2. Building Setting Out: Following the precise dimensions and specifications detailed in the architectural plans, the contractor marks out the intended locations for foundation trenches. Stringent adherence to prescribed lengths, thicknesses, and angles for wall lines is achieved through the utilization of strings, pegs, or temporary structures. Rigorous verification at each step, employing measuring tools and surveying equipment, guarantees optimal alignment and dimensional accuracy.

3. Establishing a Datum Level: A crucial aspect of the setting-out process involves the establishment of a precise datum level. This reference point serves as the foundational elevation for measuring vertical distances throughout the construction process, ensuring consistent levels across the entire structure.

building setting out
Figure 1: Typical setting out process

The Site Plan

Every construction project commences with a prepared site plan, typically drawn to a scale of 1:500. This document maps existing site features, property lines, proposed buildings, setbacks, surrounding streets, roads, services, and ancillary works like car parks, retaining walls, and landscaping. It may even show new ground levels to guide development.

typical site plan 1
Figure 2: Typical generic site plan of a proposed construction

Setting Out

While the site plan serves as a drafted blueprint, its true merit lies in its practical implementation. The success hinges on the ability of onsite personnel to accurately translate the plan’s directives into physical reality. This process, known as setting out, ensures foundations are laid at the designated level and ground floors precisely match the intended height above the finished ground level. Each step relies on the accurate transfer of information from the plan to the actual construction site.

Constraints and Reference Points

The architect or engineer tasked with planning the site layout often encounters restrictions known as “building lines.” These invisible lines dictate the building’s frontage, requiring a clear depiction of the site plan with precise referencing to fixed points.

Typical site plan with complete dimensions and details
Figure 3: Typical site plan with complete dimensions and details

Examples include road or pavement kerb lines and extensions of existing building frontages. Figure 3 exemplifies a typical site plan layout. In the absence of designated building lines, the building’s corner positions are determined by dimensions carefully measured from at least two established fixed points.

Essential Tools for Setting Out

To effectively execute the setting-out process, a specific toolkit is indispensable:

  • Dumpy level, tripod, and staff: This trio enables precise levelling and height measurements.
  • Wooden pegs: Sturdy pegs facilitate marking key points.
  • Builder’s square: Useful for checking the orthogonality of angles
  • Hammers and nails: Securing pegs efficiently requires hammering skills.
  • Measuring tapes: Precise distance measurement is crucial.
  • Builder’s line and level: This combination ensures proper alignment and horizontal reference.
  • Measuring rods: Additional tools for accurate measurement tasks.
  • Crosscut hand saw: Cutting materials for marking purposes.
  • Timber boards: Useful for creating temporary structures or markers.

Process of Building Setting Out

The following established process is used in the setting out of buildings;

Elements of a proper building setting out
Figure 4: Elements of a proper building setting out

(1) Locating Fixed Reference Points (Baseline): The initial stage of setting out on a construction site involves identifying and verifying existing reference points employed during the preliminary survey. These points, often materialized as nails, pins, hooks, or markings, serve as crucial anchors for subsequent measurements. Re-measuring these points confirms their accuracy and ensures a reliable foundation for further site layout.

(2) Marking Building Corners and Baselines: For projects lacking predefined building lines, the initial step involves physically marking the building’s corners using wooden pegs with nails driven into their tops. Steel tape measurements taken from known fixed points, referencing dimensions provided in the site plan, guide the precise placement of these initial markers. Repeating measurements and ensuring their consistency further enhance accuracy.

image 6
Figure 5: Marking building corners

(3) Utilizing Building Lines for Corner Placement: When building lines are present, their fixed positions allow for the deployment of a builder’s line stretched between nails marking the line’s ends. By measuring along this line with a steel tape, the locations of building corners can be established. Again, pegs and nails mark these corner points for easy visualization and reference.

(4) Employing Pythagoras for Precise Positioning: With two building corners accurately defined, the remaining corners can be determined using the Pythagorean theorem applied to right-angled triangles formed by the existing points (Figure 6). Once all four corners are marked with pegs, a final verification step involves diagonally measuring the resulting rectangle to ensure minimal discrepancies.

image 5
Figure 6: Pythagorean theorem

(5) Addressing Limitations of Basic Markers: The initial placement of corner markers using pegs and nails faces limitations, namely potential disturbance during subsequent construction activities and the lack of vertical alignment information. To overcome these limitations and establish robust reference points, the use of profile boards is necessary (Figure 7).

image 4
Figure 7: Profile boards

(6) Utilizing Profile Boards for Enhanced Functionality: Each profile board set is positioned at a building corner, strategically “looking” along two adjacent walls. These boards offer several advantages:

  • Undisturbed by Subsequent Work: They are positioned outside the excavation area, ensuring their preservation throughout construction.
  • Vertical and Horizontal Alignment: They provide reference points for both horizontal dimensions and vertical elevations.
  • Repeatability: They facilitate the precise re-establishment of corner locations, measurements, and levels if needed.

While the builder’s lines strung between profile boards might initially hinder excavation activities, alternative methods for marking out excavation boundaries are employed during the later stages of foundation construction.

Digital Setting Out Equipment

While traditional methods using pegs and profiles remain prevalent, advancements in technology offer alternative approaches for setting out on construction sites. Large companies leveraging Electronic Position and Distance Measurement (EPDM) equipment can optimize efficiency and potentially eliminate the need for extensive use of temporary markers.

In such scenarios, one or two strategically placed pegs with nails, protected from disturbance, can serve as enduring reference points throughout the construction process. These key markers, established during the initial survey, facilitate the precise layout of various site elements, encompassing roads, sewers, house drains, and even the buildings themselves. This technology-driven approach streamlines the setting-out process while upholding accuracy and efficiency.

Conclusion

Setting out, though seemingly simple, is a cornerstone of successful construction. Its proper execution requires expertise, precision, and the use of the right tools. By understanding the process, embracing its significance, and leveraging available technologies, construction professionals can ensure a good and accurate alignment and positioning for every structure they build.

Von Mises Stress and the Design of Steel Structures

In structural engineering, understanding stress and its impact on the materials to be used for construction is very important. One of the most widely used theories for assessing material failure is the Von-Mises stress criterion. In this brief article, we explore the physical significance of Von-Mises stress and its application in the design of steel structures.

Von Mises stress is a scalar value derived from the multi-axial stress state that provides a simplified metric for predicting yielding in ductile materials. The stress state within a material under load is not always a simple uniaxial tension or compression.

In most practical scenarios, a combination of normal and shear stresses act simultaneously, resulting in a multi-axial stress state. Analyzing and visualizing such complex stress states can be challenging. The von Mises yield criterion, proposed by Richard von Mises in 1913, offers a simplified approach to assess the potential for yielding in ductile materials under multi-axial loading.

Theoretical Foundation

The von Mises stress is based on the distortion energy theory, which postulates that yielding occurs when the distortion energy per unit volume reaches a critical value. Distortion energy refers to the energy stored in the material due to its deformation (excluding the volumetric change associated with hydrostatic pressure). Mathematically, the von Mises stress (σvm) is defined as:

σVM = √(σ² + σ² + σ² – σσ – σσ – σσ)

von mises stress

Application of von Mises Stress in the Design of Steel Structures

Steel structures experience complex, multi-axial stress states – a far cry from the uniaxial tension or compression encountered in textbooks. Analyzing and visualizing these variable stress states can be cumbersome. The genius of von Mises stress lies in its ability to simplify this complexity into a single scalar value. By focusing on distortion energy, a measure of deformation excluding volumetric changes, it essentially condenses the multi-axial stress state into a single, meaningful indicator of potential yielding.

For ductile materials like steel, exceeding the yield strength signifies the onset of plastic deformation. By comparing the calculated von Mises stress at critical points in the structure with the steel’s yield strength, engineers gain invaluable insights:

The von Mises stress plays a very important role in various engineering design and analysis scenarios:

  • Finite Element Analysis (FEA): In FEA software, complex structures are discretized into small elements, and stress tensors are calculated at each element point. The von Mises stress is often used as a failure criterion by comparing it to the material’s yield strength. If the von Mises stress exceeds the yield strength at any point, it indicates potential plastic deformation or yielding.
  • Pressure Vessel Design: Pressure vessels experience complex stress states due to internal pressure and external loads. Analyzing the von Mises stress distribution helps ensure the vessel remains within its safe operating limits and prevents catastrophic failure.
  • Bridges and Buildings: From towering bridges to intricate beam-column connections, engineers rely on von Mises stress to assess the load-carrying capacity of steel members, optimizing their design to withstand diverse loading conditions like wind, seismic forces, and live loads.

EN 1993-1-5 (Part 1-5 of Eurocode 3) entitled “Plated Structural Elements”, establishes the regulations for preventing local buckling in steel plated structures. This section presents designers with two primary design methodologies: the “Effective Width Method” and the “Reduced Stress Method“.

The Reduced Stress Method offers a simplified approach compared to the general form, making it particularly suitable for serviceability checks and designing non-uniform members such as tapered beams, webs with openings, and plates with non-orthogonal stiffeners. This method assumes a linear stress distribution up to the buckling limit of the first-yielding plate element. The entire cross-section remains fully effective until this stress limit is reached.

The Reduced Stress Method can be employed to determine stress limits for both stiffened and unstiffened plates. It incorporates the von Mises criterion to account for the interaction between various stress types within the plate.

Furthermore, Eurocode 3 Part 6, permits the use of ”stress design” approach for the limit state design of steel shells. When employing the stress design approach, limit states must be evaluated across three distinct stress categories: primary, secondary, and local. This categorization typically relies on the von Mises equivalent stress at specific points. However, it is very important to recognize that this value is not suitable for assessing buckling stresses.

Factor of Safety

If we define the safety factor as N = Failure Stress / Analysed Stress

For Von-Mises Stresses, the safety factor is computed using;
N = fy / σvm = Yield stress/von Mises stress

image 2

For instance, if the steel plate above is to be constructed with steel grade S275 (fy = 275 N/mm2), the factor of safety using von Mises criteria is;

Factor of Safety = (0.65 × 275)/38.5 = 4.64

In this case, the failure stress is taken as 0.65fy.

Limitations and Considerations

It is important to remember that the von Mises stress is a simplified criterion and has certain limitations:

  • Material Dependence: The von Mises criterion is primarily applicable to ductile metals. It may not be accurate for brittle materials or materials with significant pressure sensitivity.

  • Anisotropy: The criterion assumes isotropic material behaviour, meaning the material properties are the same in all directions. If a material exhibits anisotropic behaviour, alternative yield criteria like Tresca or Hill might be necessary.
  • Temperature Dependence: The yield strength of materials varies with temperature. The von Mises stress should be considered in conjunction with temperature-dependent material properties for accurate failure prediction.

Conclusion

Understanding the concept of von Mises stress is fundamental for engineers and scientists working with materials under complex loading conditions. This simplified metric provides a valuable tool for assessing potential yielding and guiding design decisions. However, it is important as well to acknowledge and consider the limitations associated with this criterion for accurate and reliable engineering analysis.